Peak Reversal v3# Peak Reversal v3
## Summary
Peak Reversal v3 adds new configurability, clearer visuals, and a faster trader workflow. The release introduces a new Squeeze Detector , expanded Keltner Channels , and streamlined Momentum signals , with no repaints and improved performance. The menus have been reorganized and simplified. Color swatches have been added for better customization. All other colors will be derived from these swatches.
## Highlights
New Squeeze Detector to mark low-volatility periods and prepare for breakouts.
New: Bands are now fully configurable with independent MA length, ATR length, and multipliers.
Five moving average bases for bands: EMA (from v2), SMA, RMA, VMA, HMA.
Simplified color system: three swatches drive candles, on-chart marks, and band fill.
Reorganized menu with focused sections and tooltips for each parameter making the entire trader experience more intuitive.
No repaints and faster performance across calculations.
## Overview
Configuration : Pick from three color swatches and apply them to candles, plotted characters, and band fill for consistent chart context. Use the reorganized menu to reach Keltner settings, momentum signals, and squeeze detection without extra clicks; tooltips clarify each input.
Bands and averages: Choose the band basis from EMA, SMA, RMA, VMA, or HMA to match your strategy. Configure two bands independently by setting MA length, ATR length, and band multipliers for the inner and outer envelopes.
Signals : Select the band responsible for momentum signals. Choose wick or close as the price source for entries and exits. Control the window for extreme momentum with “Max Momentum Bars,” a setting now exposed in v3 for direct tuning.
Squeeze detection : The Squeeze Detector normalizes band width and uses percentile ranking to highlight volatility compression. When the market falls below a user-defined threshold, the indicator colors the region with a gradient to signal potential expansion.
## Details about major features and changes
### New
Squeeze Detector to highlight low-volatility conditions.
Five MA bases for bands: EMA, SMA, RMA, VMA, HMA.
“Max Momentum Bars” to cap the bars used for extreme momentum.
### Keltner channel improvements
Refactored Keltner settings for flexible inner and outer band control.
MA type selection added; band calculations updated for consistency.
Removed the third Keltner band to reduce noise and simplify setup.
### Display and signals
Gradient fills for band breakouts, mean deviations, and squeeze periods.
“Show Mean EMA?” set to true and default “Signal Band” set to “Inner.”
Clearer tooltips and input descriptions.
### Reliability and performance
No more repaints. The indicator waits for confirmation before drawing occurs.
Faster execution through targeted refactors.
All algorithms have been reviewed and now use a consistent logic, naming, and structure.
Cerca negli script per "band"

_mr_beach Sunday Entwicklung Version 1_mr_beach Sunday Development Version 1
Short Description (for TradingView publication):
This indicator combines EMA crossovers, VWAP with standard deviation bands, gap detection, pivot-based support & resistance, and VWAP distance labels in a single overlay. Perfect for discretionary traders aiming to efficiently identify gap fills, trend reversals, and key price levels. All components can be toggled on/off via the settings menu.
Full Indicator Description:
🧠 Purpose of the Indicator:
This all-in-one tool merges several analytical features to visualize trend direction, market structure, key price levels (e.g., gaps, VWAP distance, pivot support), and entry signals at a glance.
🔧 Integrated Features:
EMA20 / EMA50: Trend detection via moving averages. Crossover signals indicate potential entries.
VWAP + Band: Volume-weighted average price with visual deviation bands.
GAP-Up / GAP-Down: Price gaps are highlighted in color (brown/yellow), optionally showing only open ones.
VWAP Distance Label: Displays the current price’s percentage deviation from the VWAP as a chart label.
Buy/Sell Signals: Triggered by EMA20 and EMA50 crossovers.
HH/LL SL-Marker: Identifies local highs/lows using pivots.
Support & Resistance: Automatically calculated pivot zones.
Customizable Visibility: All features can be toggled in the settings menu.
Dummy Plot: plot(na) ensures error-free compilation.
⚙️ Settings Menu Options:
Show VWAP: Displays VWAP and deviation bands.
Show EMA20 / EMA50: Shows the moving averages.
Show Gaps: Enables gap detection.
Show Only Open Gaps: Hides already filled gaps.
Show VWAP Distance: Activates VWAP deviation label.
Support & Resistance: Displays pivot-based zones as support/resistance.
🔔 Alerts:
‘Mads Morningstar Signal’: Buy/Sell alerts based on EMA crossover.
📈 Use Cases:
Trend-following setups using EMA crossover
Gap-fill trading strategies
VWAP reversion trades
SL/TP based on HH/LL or pivot levels
Visual chart preparation for scalping, intraday, or swing trading
🛠 Suggested Extensions:
Gap table showing open levels
Take-Profit/Stop-Loss strategy
Alerts for new gap formation
Strategy tester module with gap-based entries

ZLMA Keltner ChannelThe ZLMA Keltner Channel uses a Zero-Lag Moving Average (ZLMA) as the centerline with ATR-based bands to track trends and volatility.
The ZLMA’s reduced lag enhances responsiveness for breakouts and reversals, i.e. it's more sensitive to pivots and trend reversals.
Unlike Bollinger Bands, which use standard deviation and are more sensitive to price spikes, this uses ATR for smoother volatility measurement.
Background:
Built on John Ehlers’ lag-reduction techniques, this indicator adapts the classic Keltner Channel for dynamic markets. It excels in trending (low-entropy) markets for breakouts and range-bound (high-entropy) markets for reversals.
How to Read:
ZLMA (Blue): Tracks price trends. Above = bullish, below = bearish.
Upper Band (Green): ZLMA + (Multiplier × ATR). Cross above signals breakout or overbought.
Lower Band (Red): ZLMA - (Multiplier × ATR). Cross below signals breakout or oversold.
Channel Fill (Gray): Shows volatility. Narrow = low volatility, wide = high volatility.
Signals (Optional): Enable to show “Buy” (green) on upper band crossovers, “Sell” (red) on lower band crossunders.
Strategies: Trade breakouts in trending markets, reversals in ranges, or use bands as trailing stops.
Settings:
ZLMA Period (20): Adjusts centerline responsiveness.
ATR Period (20): Sets volatility period.
Multiplier (2.0): Controls band width.
If you are still confused between the ZLMA Keltner Channels and Bollinger Bands:
Keltner Channel (ZLMA): Uses ATR for bands, which smooths volatility and is less reactive to sudden price spikes. The ZLMA centerline reduces lag for faster trend detection.
Bollinger Bands: Uses standard deviation for bands, making them more sensitive to price volatility and prone to wider swings in high-entropy markets. Typically uses an SMA centerline, which lags more than ZLMA.

True Range eXpansion🕯️ TRX — True Range eXpansion
Clean Candle Bodies · Volatility Bands · Adaptive Range Envelope System
Not your grandfather’s candles. Not your brokerage’s bands.
----------------------------------------------------
TRX begins with a simple concept: visualize the true range of every candle, without the noise of flickering wicks.
From there, it grows into a fully adaptive price visualization framework.
What started as a candle-only visualizer evolved into a modular, user-controlled price engine.
From wickless candle clarity to dynamic volatility envelopes, TRX adapts to you.
There are plenty of band and channel indicators out there — Bollinger, Keltner, Donchian, Envelope, the whole crew.
But none of them are built on the true candle range, adaptive ATR shaping, and full user control like TRX.
This isn’t just another indicator — it’s a new framework.
Most bands and channels are based on close price and statistical deviation — useful, but limited.
TRX uses the full true range of each candle as its foundation, then applies customizable smoothing and directional ATR scaling to form a dynamic, volatility-reactive envelope.
The result? Bands that breathe with the market — not lag behind it.
----------------------------------------------------
🔧 Core Features:
🕯️ True Range Candles — Each candle is plotted from low to high, body-only, colored by open/close.
📈 Adjustable High/Low Moving Averages — Select your smoothing style: SMA, EMA, WMA, RMA, or HMA.
🌬️ ATR-Based Expansion — Bands dynamically breathe based on market volatility.
🔀 Per-Band Multipliers — Fine-tune expansion individually for the upper and lower bands.
⚖️ Basis Line — Optional centerline between bands for structure tracking and equilibrium zones.
🎛️ Full Visual Control — Width, transparency, color, on/off toggles for each element.
----------------------------------------------------
🧠 Default Use Case:
With the included default settings, TRX behaves like an evolved Bollinger Band system — based on True Range candle structure, not just close price and standard deviation.
----------------------------------------------------
🔄 How to Zero Out the Bands (for Minimalist Use):
Want just candles? A clean MA? Single band? You got it.
➤ Use TRX like a clean moving average:
• Set ATR Multiplier to 0
• Set both Band ATR Adjustments to 0
• Leave the Basis Line ON or OFF — your call
➤ Show only candles (no bands at all):
• Turn off "Show High/Low MAs"
• Turn off Basis Line
➤ Single-line ceiling or floor tracking:
• Set one band’s Transparency to 100
• Use the remaining band as a price envelope or support/resistance guide
----------------------------------------------------
🧬 Notes:
TRX can be made:
• Spiky or silky (via smoothing & ATR)
• Wide or tight (via multipliers)
• Subtle or aggressive (via color/transparency)
• Clean as a compass or dirty as a chaos meter
Built by accident. Tuned with intention.
Released to the world as one of the most adaptable and expressive visual overlays ever made.
Created by Sherlock_MacGyver

LGMM (flat buffers) — multivariate poly + latent statesLGMM POLYNOMIAL BANDS — DISCOVER THE MARKET’S HIDDEN STATES
Overview
Latent-Gaussian-Mixture-Models (LGMMs) view price action as a mix of several invisible regimes: trending up, drifting sideways, sudden volatility spikes, and so on.
A Gaussian Mixture learns these states directly from data and outputs, for every bar, the probability that the market is in each state.
This indicator feeds those probabilities into a rolling polynomial regression that draws a fair-value line, then builds adaptive upper and lower bands.
Band width expands when recent residuals are large *and* when the state mix is uncertain, and contracts when price is calm or one regime clearly dominates.
Crossing back into the band from below generates a buy flag; crossing back into the band from above generates a sell flag (or take-profit for longs).
Key Inputs
Price source – default is Close; you can choose HL2, OHLC4, etc.
Training window (bars) – look-back length for every retrain. 252 bars (one trading year) is a balanced default for US stocks on daily timeframe. Use fewer bars for intraday charts (say 7*24=168 for 1H bars on crypto), more for weekly periods.
Polynomial degree – 1 for a straight trend line, 2 for a curved fit. Curved fits are better when the symbol shows persistent drift.
Hidden states K – number of regimes the mixture tracks (1 to 3). Three states often map well to up-trend, chop, down-trend.
Band width ×σ – multiplier on the entropy-weighted standard deviation. Smaller values (1.5-2) give more trades; larger values (2.5-3) give fewer, higher-conviction trades.
Offline μ,σ pairs (optional) – paste component means and sigmas from an offline LGMM (format: mu1,sigma1;mu2,sigma2;…). Leave blank to let the script use its built-in approximation.
Quick Start
Add the indicator to a chart and wait until the initial Training window has filled.
Watch for green BUY triangles when price closes back above the lower band and red SELL triangles when price closes back below the upper band.
Fine-tune:
– Increase Training window to reduce noise.
– Decrease Band width ×σ for more frequent signals.
– Experiment with Hidden states K; more states capture richer behaviour but need longer windows to stay reliable.
Tips
Bands widen automatically in chaotic periods and tighten when one regime dominates.
Combine with a volume filter or a higher-time-frame trend to reduce whipsaws.
If you already run an LGMM in Python or Matlab, paste its component parameters for a perfect match between your back-test and the TradingView plot.
Works on all markets and time-frames, provided you have at least five times the Training window’s bars in history.
Happy trading!

Green*DiamondGreen*Diamond (GD1)
Unleash Dynamic Trading Signals with Volatility and Momentum
Overview
GreenDiamond is a versatile overlay indicator designed for traders seeking actionable buy and sell signals across various markets and timeframes. Combining Volatility Bands (VB) bands, Consolidation Detection, MACD, RSI, and a unique Ribbon Wave, it highlights high-probability setups while filtering out noise. With customizable signals like Green-Yellow Buy, Pullback Sell, and Inverse Pullback Buy, plus vibrant candle and volume visuals, GreenDiamond adapts to your trading style—whether you’re scalping, day trading, or swing trading.
Key Features
Volatility Bands (VB): Plots dynamic upper and lower bands to identify breakouts or reversals, with toggleable buy/sell signals outside consolidation zones.
Consolidation Detection: Marks low-range periods to avoid choppy markets, ensuring signals fire during trending conditions.
MACD Signals: Offers flexible buy/sell conditions (e.g., cross above signal, above zero, histogram up) with RSI divergence integration for precision.
RSI Filter: Enhances signals with customizable levels (midline, oversold/overbought) and bullish divergence detection.
Ribbon Wave: Visualizes trend strength using three EMAs, colored by MACD and RSI for intuitive momentum cues.
Custom Signals: Includes Green-Yellow Buy, Pullback Sell, and Inverse Pullback Buy, with limits on consecutive signals to prevent overtrading.
Candle & Volume Styling: Blends MACD/RSI colors on candles and scales volume bars to highlight momentum spikes.
Alerts: Set up alerts for VB signals, MACD crosses, Green*Diamond signals, and custom conditions to stay on top of opportunities.
How It Works
Green*Diamond integrates multiple indicators to generate signals:
Volatility Bands: Calculates bands using a pivot SMA and standard deviation. Buy signals trigger on crossovers above the lower band, sell signals on crossunders below the upper band (if enabled).
Consolidation Filter: Suppresses signals when candle ranges are below a threshold, keeping you out of flat markets.
MACD & RSI: Combines MACD conditions (e.g., cross above signal) with RSI filters (e.g., above midline) and optional volume spikes for robust signals.
Custom Logic: Green-Yellow Buy uses MACD bullishness, Pullback Sell targets retracements, and Inverse Pullback Buy catches reversals after downmoves—all filtered to avoid consolidation.
Visuals: Ribbon Wave shows trend direction, candles blend momentum colors, and volume bars scale dynamically to confirm signals.
Settings
Volatility Bands Settings:
VB Lookback Period (20): Adjust to 10–15 for faster markets (e.g., 1-minute scalping) or 25–30 for daily charts.
Upper/Lower Band Multiplier (1.0): Increase to 1.5–2.0 for wider bands in volatile stocks like AEHL; decrease to 0.5 for calmer markets.
Show Volatility Bands: Toggle off to reduce chart clutter.
Use VB Signals: Enable for breakout-focused trades; disable to focus on Green*Diamond signals.
Consolidation Settings:
Consolidation Lookback (14): Set to 5–10 for small caps (e.g., AEHL) to catch quick consolidations; 20 for higher timeframes.
Range Threshold (0.5): Lower to 0.3 for stricter filtering in choppy markets; raise to 0.7 for looser signals.
MACD Settings:
Fast/Slow Length (12/26): Shorten to 8/21 for scalping; extend to 15/34 for swing trading.
Signal Smoothing (9): Reduce to 5 for faster signals; increase to 12 for smoother trends.
Buy/Sell Signal Options: Choose “Cross Above Signal” for classic MACD; “Histogram Up” for momentum plays.
Use RSI Div + MACD Cross: Enable for high-probability reversal signals.
RSI Settings:
RSI Period (14): Drop to 10 for 1-minute charts; raise to 20 for daily.
Filter Level (50): Set to 55 for stricter buys; 45 for sells.
Overbought/Oversold (70/30): Tighten to 65/35 for small caps; widen to 75/25 for indices.
RSI Buy/Sell Options: Select “Bullish Divergence” for reversals; “Cross Above Oversold” for momentum.
Color Settings:
Adjust bullish/bearish colors for visibility (e.g., brighter green/red for dark themes).
Border Thickness (1): Increase to 2–3 for clearer candle outlines.
Volume Settings:
Volume Average Length (20): Shorten to 10 for scalping; extend to 30 for swing trades.
Volume Multiplier (2.0): Raise to 3.0 for AEHL’s volume surges; lower to 1.5 for steady stocks.
Bar Height (10%): Increase to 15% for prominent bars; decrease to 5% to reduce clutter.
Ribbon Settings:
EMA Periods (10/20/30): Tighten to 5/10/15 for scalping; widen to 20/40/60 for trends.
Color by MACD/RSI: Disable for simpler visuals; enable for dynamic momentum cues.
Gradient Fill: Toggle on for trend clarity; off for minimalism.
Custom Signals:
Enable Green-Yellow Buy: Use for momentum confirmation; limit to 1–2 signals to avoid spam.
Pullback/Inverse Pullback % (50): Set to 30–40% for small caps; 60–70% for indices.
Max Buy Signals (1): Increase to 2–3 for active markets; keep at 1 for discipline.
Tips and Tricks
Scalping Small Caps (e.g., AEHL):
Use 1-minute charts with VB Lookback = 10, Consolidation Lookback = 5, and Volume Multiplier = 3.0 to catch $0.10–$0.20 moves.
Enable Green-Yellow Buy and Inverse Pullback Buy for quick entries; disable VB Signals to focus on Green*Diamond logic.
Pair with SMC+ green boxes (if you use them) for reversal confirmation.
Day Trading:
Try 5-minute charts with MACD Fast/Slow = 8/21 and RSI Period = 10.
Enable RSI Divergence + MACD Cross for high-probability setups; set Max Buy Signals = 2.
Watch for volume bars turning yellow to confirm entries.
Swing Trading:
Use daily charts with VB Lookback = 30, Ribbon EMAs = 20/40/60.
Enable Pullback Sell (60%) to exit after rallies; disable RSI Color for cleaner candles.
Check Ribbon Wave gradient for trend strength—bright green signals strong bulls.
Avoiding Noise:
Increase Consolidation Threshold to 0.7 on volatile days to skip false breakouts.
Disable Ribbon Wave or Volume Bars if the chart feels crowded.
Limit Max Buy Signals to 1 for disciplined trading.
Alert Setup:
In TradingView’s Alerts panel, select:
“GD Buy Signal” for standard entries.
“RSI Div + MACD Cross Buy” for reversals.
“VB Buy Signal” for breakout plays.
Set to “Once Per Bar Close” for confirmed signals; “Once Per Bar” for scalping.
Backtesting:
Replay on small caps ( Float < 5M, Price $0.50–$5) to test signals.
Focus on “GD Buy Signal” with yellow volume bars and green Ribbon Wave.
Avoid signals during gray consolidation squares unless paired with RSI Divergence.
Usage Notes
Markets: Works on stocks, forex, crypto, and indices. Best for volatile assets (e.g., small-cap stocks, BTCUSD).
Timeframes: Scalping (1–5 minutes), day trading (15–60 minutes), or swing trading (daily). Adjust settings per timeframe.
Risk Management: Combine with stop-losses (e.g., 1% risk, $0.05 below AEHL entry) and take-profits (3–5%).
Customization: Tweak inputs to match your strategy—experiment in replay to find your sweet spot.
Disclaimer
Green*Diamond is a technical tool to assist with trade identification, not a guarantee of profits. Trading involves risks, and past performance doesn’t predict future results. Always conduct your own analysis, manage risk, and test settings before live trading.
Feedback
Love Green*Diamond? Found a killer setup?

Triple SRSI-MFI Ⅲ - Multi TimeframeTriple SRSI-MFI Ⅲ - Multi Timeframe Indicator
Description
The Triple SRSI-MFI Ⅲ - Multi Timeframe indicator is a powerful tool designed to combine Stochastic RSI (SRSI) and Money Flow Index (MFI) across multiple timeframes (higher, current, and lower). It provides a comprehensive view of market momentum and potential overbought/oversold conditions by calculating a weighted hybrid of SRSI-MFI values from three different timeframes. The indicator also integrates Bollinger Bands to help identify trend direction and volatility.
This indicator is ideal for traders who want to analyze market conditions across multiple timeframes without switching charts. It automatically adjusts settings based on the current timeframe and includes a dynamic weighting system optimized for Bitcoin volatility. Additionally, a real-time information panel displays the market state (buy/sell) and signal strength.
Key Features
Multi-Timeframe Analysis: Combines SRSI-MFI from higher, current, and lower timeframes for a holistic view.
Dynamic Weighting: Automatically adjusts weights for each timeframe based on Bitcoin volatility, with an option for manual customization.
Bollinger Bands Integration: Visualizes trend direction and volatility using Bollinger Bands, with customizable source selection.
Real-Time Info Panel: Displays market state (buy/sell) and signal strength (%) in the top-right corner of the chart.
Customizable Settings: Allows users to tweak MFI source, Bollinger Bands parameters, and visibility of individual components.
How to Use
Add to Chart: Add the "Triple SRSI-MFI Ⅲ - Multi Timeframe" indicator to your chart.
Interpret Signals:
Market State (Buy/Sell): Shown in the info panel. "Buy" when the average SRSI-MFI is above the Bollinger Bands basis, "Sell" when below.
Strength (%): The relative position of the average SRSI-MFI within the Bollinger Bands, scaled from 0% to 100%.
Overbought/Oversold Levels: The indicator plots horizontal lines at 80 (overbought) and 20 (oversold). Use these as potential reversal zones.
Combine with Price Action: Use the indicator in conjunction with price action or other tools for better decision-making.
Adjust Settings: Customize the settings (e.g., Bollinger Bands length, weights, visibility) to match your trading style.
Settings
MFI Source: Select the source for MFI calculation (default: "hlc3"). Options include "close", "open", "high", "low", "hl2", "hlc3", "ohlc4".
Bollinger Bands:
Length: Period for Bollinger Bands calculation (default: 20).
Multiplier: Standard deviation multiplier for the bands (default: 2.0).
Source: Choose which SRSI-MFI value to use for Bollinger Bands ("averageHybrid", "hybrid_higher", "hybrid_current", "hybrid_lower"; default: "hybrid_higher").
Weights:
Auto Weight Enabled: Enable/disable automatic weights based on Bitcoin volatility (default: true).
Higher/Current/Lower Weights: Manually set weights for each timeframe if auto-weight is disabled (defaults: 1.5, 1.0, 0.5).
Indicator On/Off:
Toggle visibility for Higher SRSI-MFI, Current SRSI-MFI, Lower SRSI-MFI, Average SRSI-MFI, and Bollinger Bands.
How It Works
SRSI-MFI Calculation:
Stochastic RSI (SRSI) and Money Flow Index (MFI) are calculated for three timeframes: higher, current, and lower.
The hybrid value (SRSI * (MFI / 100)) is computed for each timeframe.
Weighted Average:
The hybrid values are combined into a weighted average (averageHybrid) using dynamic or manual weights.
Bollinger Bands:
Bollinger Bands are applied to the selected source (e.g., hybrid_higher) to identify trend direction and volatility.
Relative Position:
The position of averageHybrid within the Bollinger Bands is scaled to a percentage (0% to 100%) for strength assessment.
Visualization:
Plots individual SRSI-MFI lines, Bollinger Bands, and overbought/oversold levels.
A real-time info panel provides market state and signal strength.
Notes
This indicator is best used as part of a broader trading strategy. It is not a standalone signal generator and should be combined with other forms of analysis.
The automatic weights are optimized for Bitcoin (BTC) volatility. For other assets, you may need to adjust the weights manually.
The indicator may require sufficient historical data to calculate higher and lower timeframe values accurately.

Ehlers Instantaneous Trendline ATR LevelsOverview
This sophisticated technical analysis tool merges John Ehlers' cutting-edge Instantaneous Trendline methodology with a dynamic ATR-based bands system. The indicator is designed to provide traders with a comprehensive view of market trends while accounting for volatility, making it suitable for both trending and ranging markets. Works on all timeframes and chart types.
Key Features in Detail
1. Ehlers Instantaneous Trendline Implementation
- Advanced algorithm that reduces lag typically associated with moving averages
- Built-in volatility filtering system to minimize false signals
- Adaptive to market conditions through dynamic calculations
- Real-time trend direction identification
2. Multi-layered ATR Band System
- Hierarchical band structure with 18 total bands (9 upper, 9 lower)
- Color-coded visualization system:
Upper bands: Red gradient (darker = further from trendline)
Lower bands: Green gradient (darker = further from trendline)
Central trendline: Yellow for optimal visibility
- Customizable multipliers for each band level
- Independent visibility controls for each band
Configuration Options
Trendline Settings:
- Lower values: More responsive to price changes and faster reacting to break in ATR filter
- Higher values: Smoother trendline with less noise and slower reacting to break in ATR filter
ATR Configuration:
Period: Customizable from 1 to any positive integer
- Longer periods: More stable volatility measurement
- Shorter periods: More reactive to recent volatility changes
Filter Multiplier: Fine-tune volatility filtering
- Higher values: More filtered signals leading to less shift in bands
- Lower values: More sensitive to price movements leading to more band shifts
Practical Applications
1. Trend Analysis
Use the central trendline for primary trend direction
Monitor band crossovers for trend strength confirmation
Track price position relative to bands for trend context
2. Volatility Assessment
Band spacing indicates current market volatility
Width between bands helps identify consolidation vs. expansion phases
Price Extremes
3. Support and Resistance
Each band acts as a dynamic support/resistance level
Multiple timeframe analysis possible adjusting for different timeframe ATR

Red & Green Zone ReversalOverview
The “Red & Green Zone Reversal” indicator is designed to visually highlight potential reversal zones on your chart by using a combination of Bollinger Bands and the Relative Strength Index (RSI).
It overlays on the chart and provides background color cues—red for oversold conditions and green for overbought conditions—along with corresponding alert triggers.
Key Components
Overlay: The indicator is set to overlay the chart, meaning its visual cues (colored backgrounds) are drawn directly on the price chart.
Bollinger Bands Calculation
Period: A 20-period simple moving average (SMA) is calculated from the closing prices.
Standard Deviation Multiplier: A multiplier of 2.0 is applied.
Bands Defined:
Basis: The 20-period SMA.
Deviation: Calculated as 2 times the standard deviation over the same period.
Upper Band: Basis plus the deviation.
Lower Band: Basis minus the deviation.
RSI Calculation
Period: The RSI is computed over a 14-period span using the closing prices.
Thresholds:
Oversold Threshold: 30 (used for the red zone condition).
Overbought Threshold: 70 (used for the green zone condition).
Zone Conditions
Red Zone (Oversold):
Criteria: The price is below the lower Bollinger Band and the RSI is below 30.
Purpose: Highlights a situation where the asset may be deeply oversold, signaling a potential reversal to the upside.
Green Zone (Overbought):
Criteria: The price is above the upper Bollinger Band and the RSI is above 70.
Purpose: Indicates that the asset may be overbought, potentially signaling a reversal to the downside.
Visual and Alert Components
Background Coloring:
Red Background: Applied when the red zone condition is met (using a semi-transparent red).
Green Background: Applied when the green zone condition is met (using a semi-transparent green).
Alerts:
Red Alert: An alert condition titled “Deep Oversold Alert” is triggered with the message “Deep Oversold Signal triggered!” when the red zone criteria are satisfied.
Green Alert: Similarly, an alert condition titled “Deep Overbought Alert” is triggered with the message “Deep Overbought Signal triggered!” when the green zone criteria are met.
Important Disclaimers
Not Financial Advice:
This indicator is provided for informational and analytical purposes only. It does not constitute trading advice or a recommendation to buy or sell any asset. Traders should use it as one of several tools in their analysis and should perform their own due diligence.
Risk Management:
Trading inherently involves risk. Past performance is not indicative of future results. Always implement appropriate risk management and use stop losses where necessary.
Summary
In summary, the “Red & Green Zone Reversal” indicator uses Bollinger Bands and RSI to detect extreme market conditions. It visually marks oversold (red) and overbought (green) conditions directly on the chart and offers alert conditions to help traders monitor these potential reversal points.
Enjoy!!

Buy/Sell Signals for CM_Williams_Vix_FixThis script in Pine Script is designed to create an indicator that generates buy and sell signals based on the Williams VIX Fix (WVF) indicator. Here’s a brief explanation of how this script works:
Main Components:
Williams VIX Fix (WVF) – This volatility indicator is calculated using the formula:
WVF
=
(
highest(close, pd)
−
low
highest(close, pd)
)
×
100
WVF=(
highest(close, pd)
highest(close, pd)−low
)×100
where highest(close, pd) represents the highest closing price over the period pd, and low represents the lowest price over the same period.
Bollinger Bands are used to determine levels of overbought and oversold conditions. They are constructed around the moving average (SMA) of the WVF value using standard deviation (SD).
Ranges based on percentiles help identify extreme levels of WVF values to spot entry and exit points.
Buy and sell signals are generated when the WVF crosses the Bollinger Bands lines or reaches the ranges based on percentiles.
Adjustable Parameters:
LookBack Period Standard Deviation High (pd): The lookback period for calculating the highest closing price.
Bolinger Band Length (bbl): The length of the period for constructing the Bollinger Bands.
Bollinger Band Standard Devaition Up (mult): The multiplier for the standard deviation used for the upper Bollinger Band.
Look Back Period Percentile High (lb): The lookback period for calculating maximum and minimum WVF values.
Highest Percentile (ph): The percentile threshold for determining the high level.
Lowest Percentile (pl): The percentile threshold for determining the low level.
Show High Range (hp): Option to display the range based on percentiles.
Show Standard Deviation Line (sd): Option to display the standard deviation line.
Signals:
Buy Signal: Generated when the WVF crosses above the lower Bollinger Band or falls below the lower boundary of the percentile-based range.
Sell Signal: Generated when the WVF crosses below the upper Bollinger Band or rises above the upper boundary of the percentile-based range.
These signals are displayed as triangles below or above the candles respectively.
Application:
The script can be used by traders to analyze market conditions and make buying or selling decisions based on volatility and price behavior.

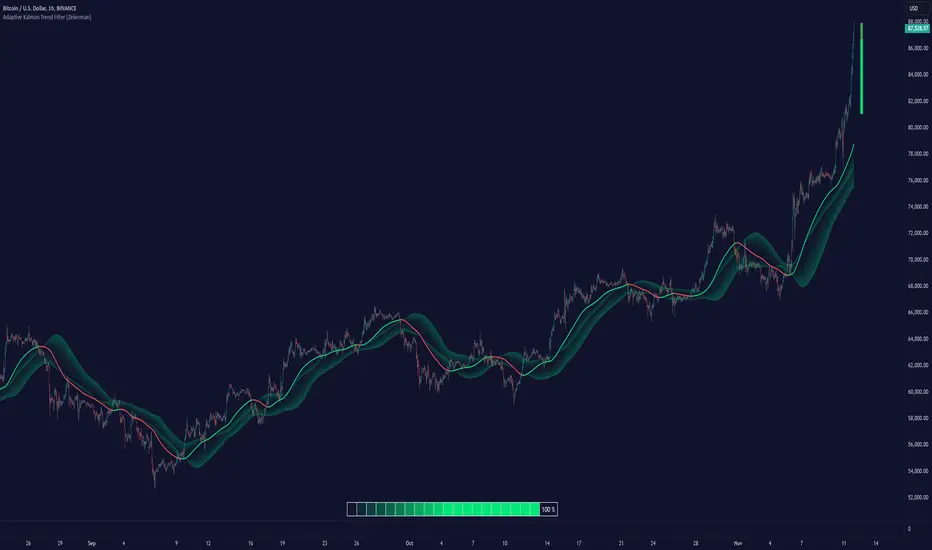
Adaptive Kalman Trend Filter (Zeiierman)█ Overview
The Adaptive Kalman Trend Filter indicator is an advanced trend-following tool designed to help traders accurately identify market trends. Utilizing the Kalman Filter—a statistical algorithm rooted in control theory and signal processing—this indicator adapts to changing market conditions, smoothing price data to filter out noise. By focusing on state vector-based calculations, it dynamically adjusts trend and range measurements, making it an excellent tool for both trend-following and range-based trading strategies. The indicator's adaptive nature is enhanced by options for volatility adjustment and three unique Kalman filter models, each tailored for different market conditions.
█ How It Works
The Kalman Filter works by maintaining a model of the market state through matrices that represent state variables, error covariances, and measurement uncertainties. Here’s how each component plays a role in calculating the indicator’s trend:
⚪ State Vector (X): The state vector is a two-dimensional array where each element represents a market property. The first element is an estimate of the true price, while the second element represents the rate of change or trend in that price. This vector is updated iteratively with each new price, maintaining an ongoing estimate of both price and trend direction.
⚪ Covariance Matrix (P): The covariance matrix represents the uncertainty in the state vector’s estimates. It continuously adapts to changing conditions, representing how much error we expect in our trend and price estimates. Lower covariance values suggest higher confidence in the estimates, while higher values indicate less certainty, often due to market volatility.
⚪ Process Noise (Q): The process noise matrix (Q) is used to account for uncertainties in price movements that aren’t explained by historical trends. By allowing some degree of randomness, it enables the Kalman Filter to remain responsive to new data without overreacting to minor fluctuations. This noise is particularly useful in smoothing out price movements in highly volatile markets.
⚪ Measurement Noise (R): Measurement noise is an external input representing the reliability of each new price observation. In this indicator, it is represented by the setting Measurement Noise and determines how much weight is given to each new price point. Higher measurement noise makes the indicator less reactive to recent prices, smoothing the trend further.
⚪ Update Equations:
Prediction: The state vector and covariance matrix are first projected forward using a state transition matrix (F), which includes market estimates based on past data. This gives a “predicted” state before the next actual price is known.
Kalman Gain Calculation: The Kalman gain is calculated by comparing the predicted state with the actual price, balancing between the covariance matrix and measurement noise. This gain determines how much of the observed price should influence the state vector.
Correction: The observed price is then compared to the predicted price, and the state vector is updated using this Kalman gain. The updated covariance matrix reflects any adjustment in uncertainty based on the latest data.
█ Three Kalman Filter Models
Standard Model: Assumes that market fluctuations follow a linear progression without external adjustments. It is best suited for stable markets.
Volume Adjusted Model: Adjusts the filter sensitivity based on trading volume. High-volume periods result in stronger trends, making this model suitable for volume-driven assets.
Parkinson Adjusted Model: Uses the Parkinson estimator, accounting for volatility through high-low price ranges, making it effective in markets with high intraday fluctuations.
These models enable traders to choose a filter that aligns with current market conditions, enhancing trend accuracy and responsiveness.
█ Trend Strength
The Trend Strength provides a visual representation of the current trend's strength as a percentage based on oscillator calculations from the Kalman filter. This table divides trend strength into color-coded segments, helping traders quickly assess whether the market is strongly trending or nearing a reversal point. A high trend strength percentage indicates a robust trend, while a low percentage suggests weakening momentum or consolidation.
█ Trend Range
The Trend Range section evaluates the market's directional movement over a specified lookback period, highlighting areas where price oscillations indicate a trend. This calculation assesses how prices vary within the range, offering an indication of trend stability or the likelihood of reversals. By adjusting the trend range setting, traders can fine-tune the indicator’s sensitivity to longer or shorter trends.
█ Sigma Bands
The Sigma Bands in the indicator are based on statistical standard deviations (sigma levels), which act as dynamic support and resistance zones. These bands are calculated using the Kalman Filter's trend estimates and adjusted for volatility (if enabled). The bands expand and contract according to market volatility, providing a unique visualization of price boundaries. In high-volatility periods, the bands widen, offering better protection against false breakouts. During low volatility, the bands narrow, closely tracking price movements. Traders can use these sigma bands to spot potential entry and exit points, aiming for reversion trades or trend continuation setups.
Trend Based
Volatility Based
█ How to Use
Trend Following:
When the Kalman Filter is green, it signals a bullish trend, and when it’s red, it indicates a bearish trend. The Sigma Cloud provides additional insights into trend strength. In a strong bullish trend, the cloud remains below the Kalman Filter line, while in a strong bearish trend, the cloud stays above it. Expansion and contraction of the Sigma Cloud indicate market momentum changes. Rapid expansion suggests an impulsive move, which could either signal the continuation of the trend or be an early sign of a possible trend reversal.
Mean Reversion: Watch for prices touching the upper or lower sigma bands, which often act as dynamic support and resistance.
Volatility Breakouts: Enable volatility-adjusted sigma bands. During high volatility, watch for price movements that extend beyond the bands as potential breakout signals.
Trend Continuation: When the Kalman Filter line aligns with a high trend strength, it signals a continuation in that direction.
█ Settings
Measurement Noise: Adjusts how sensitive the indicator is to price changes. Higher values smooth out fluctuations but delay reaction, while lower values increase sensitivity to short-term changes.
Kalman Filter Model: Choose between the standard, volume-adjusted, and Parkinson-adjusted models based on market conditions.
Band Sigma: Sets the standard deviation used for calculating the sigma bands, directly affecting the width of the dynamic support and resistance.
Volatility Adjusted Bands: Enables bands to dynamically adapt to volatility, increasing their effectiveness in fluctuating markets.
Trend Strength: Defines the lookback period for trend strength calculation. Shorter periods result in more responsive trend strength readings, while longer periods smooth out the calculation.
Trend Range: Specifies the lookback period for the trend range, affecting the assessment of trend stability over time.
-----------------
Disclaimer
The information contained in my Scripts/Indicators/Ideas/Algos/Systems does not constitute financial advice or a solicitation to buy or sell any securities of any type. I will not accept liability for any loss or damage, including without limitation any loss of profit, which may arise directly or indirectly from the use of or reliance on such information.
All investments involve risk, and the past performance of a security, industry, sector, market, financial product, trading strategy, backtest, or individual's trading does not guarantee future results or returns. Investors are fully responsible for any investment decisions they make. Such decisions should be based solely on an evaluation of their financial circumstances, investment objectives, risk tolerance, and liquidity needs.
My Scripts/Indicators/Ideas/Algos/Systems are only for educational purposes!
[blackcat] L1 Triple EMA ChannelHey, friends! blackcat is here to bring you an interesting and professional article today, talking about the "Triple Exponential Moving Average (TEMA) Channel" - a powerful tool as a trend indicator in volatile markets.
First of all, let's delve into the origins of the TEMA indicator. It was invented by Patrick Mulloy in the mid-90s with the aim to address the lagging issue encountered when using oscillators or Exponential Moving Averages (EMA). The TEMA indicator smooths out short-term fluctuations by utilizing multiple moving averages. What sets it apart is its unique approach of continuously using the EMA's EMA and adjusting for lag in its formula.
In this article, we will primarily focus on the functionality of the TEMA channel as a trend indicator. However, it's worth noting that its effectiveness is diminished in choppy or sideways markets. Instead, the TEMA indicator shines brightest in long-term trend trading. By utilizing TEMA, analysts can easily filter out and disregard periods of volatility, allowing them to focus on the overall trend.
To gain a comprehensive understanding of market trends, it is often recommended to combine TEMA with other oscillators or technical indicators. This combination can help traders and analysts interpret sharp price movements and assess the level of volatility. For example, some analysts suggest combining the Moving Average Convergence Divergence (MACD) with the TEMA channel to evaluate market trends more accurately.
Now, let's explore how the TEMA channel can be used as a tool to showcase interesting features of price support and resistance. In this script, the TEMA channel is represented by three bands: the upper band, the middle band, and the lower band. The upper band is depicted in white, the middle band in yellow, and the lower band in magenta.
So, let's dive deep into the world of the TEMA channel and enjoy the benefits it brings to understanding market trends. Join us on this exciting journey!

No Wick Bull/Bear Candlesticks with Arrow premiumNo Wick Bull/Bear Candlesticks with Arrow premium
This script is for a custom trading indicator called "No Wick Bull/Bear Candlesticks with Arrow premium" developed by ClearTradingMind. It is designed for use with trading platforms that support scripting, such as TradingView. This indicator combines several technical analysis tools to help traders identify potential buy and sell signals in a financial market.
Key Components of the Indicator:
Moving Average (MA): The script allows users to select from various types of moving averages (SMA, EMA, HMA, etc.), which smooth out price data to identify trends. Users can set the length and type of the moving average.
Upper and Lower Bands: These bands are set at a specified deviation percentage above and below the chosen moving average. They help in identifying overbought and oversold conditions.
No Wick Bull/Bear Candlestick Identification:
Bullish Condition: A bullish candlestick is identified when the closing price is higher than the opening price, the low equals the open, and the close is above the moving average.
Bearish Condition: A bearish candlestick is identified when the closing price is lower than the opening price, the high equals the open, and the close is below the moving average.
No Wick: These conditions also imply that the candlesticks have no wicks, suggesting strong buying or selling pressure.
Arrows for Trading Signals:
No lower wick bull bar
No upper wick bear bar
When a bullish condition is met, a green upward-pointing triangle is plotted below the candlestick, indicating a potential buy signal.
When a bearish condition is met, a red downward-pointing triangle is plotted above the candlestick, indicating a potential sell signal.
EMA 20: An additional Exponential Moving Average with a length of 20 periods is plotted for further trend analysis.
Background Color Changes: The script changes the background color to blue if the EMA 20 is above the upper band, and to red if it is below the lower band, providing visual cues about the market trend.
How It Works:
Traders can input their preferences for the moving average type and length, source of the MA (like closing prices), and the deviation percentage for the bands.
The script then calculates the moving average, upper and lower bands, and checks for bullish or bearish candlestick conditions without wicks.
When such conditions are met, it plots arrows to suggest buy or sell signals.
The EMA 20 and background color changes offer additional trend information.
Usage:
This indicator is particularly useful in markets with clear trends. The no wick bull/bear candlesticks indicate strong buying or selling pressure, and the arrows provide clear visual signals for traders to consider entering or exiting positions. As with all trading indicators, it's recommended to use this tool in conjunction with other forms of analysis to confirm trading signals.

Scalp Tool
This script is primarily intended as a scalping tool.
The theory of the tool is based on the fact that the price always returns to its mean.
Elements used:
1. VWMA as a moving average. VWMA is calculated once based on source close and once based on source open.
2. the bands are not calculated like the Bollinger Band, but only a settlement is calculated for the lower bands based on the Lows and for the upper bands based on the Highs. Thus the bands do not become thicker or thinner, but remain in the same measure to the mean value above or below the price.
3. a volume filter on simple calculation of a MA with deviation. Therefore, it can be identified if a volume breakout has occurred.
4. support and resistance zones which are calculated based on the highs and lows over a certain length.
5. RSI to determine oversold and overbought zones. It also tries to capture the momentum by using a moving average (variable selectable) to filter the signals. The theory is that in an uptrend the RSI does not go below 50 and in a downtrend it does not go above 50.
However, this can be very different depending on the financial instrument.
Explanation of the signals:
The main signal in this indicator Serves for pure short-term trading and is generated purely on the basis of the bands and the RSI.
Only the first bands are taken into account.
Buy signal is generated when the price opens below the lower band 1 and closes above the lower band 1 or the RSI crosses a value of 25 from bottom to top.
Sell signal is generated when the price opens above the Upper Band 1 and closes below the Upper Band 1 or the RSI crosses a value of 75 from top to bottom.
The position should be closed when the price hits the opposite band. Alternatively, it can also be closed at the mean.
Other side signals:
1. breakouts:
The indicator includes 2 support and resistance zones, which differ only in length. For the breakout signals, the short version of the R/S is used. A signal is generated when the price breaks through the zones with increased volume. It is then assumed that the price will continue to follow the breakout.
The values of the S/R are adjustable and marked with "BK".
The value under Threshold 2 defines the volume breakout. 4 is considered as the highest value. The smaller the value, the smaller the volume must be during a breakout.
2. bounce
If the price hits a S/R (here the long variant is used with the designation "Support" or "Resistance") and makes a wick with small volume, the script assumes a bounce and generates a Sell or Buy signal accordingly.
The volume can be defined under "Threshold".
The S/R according to the designation as well.
Combined signals:
If the value of the S/R BK and the S/R is the same and the bounce logic of the S/R BK applies and an RSI signal is also generated, a signal is also plotted.
Here the idea was to get very strong signals for possible swing entries.
4. RSI Signals
The script contains two RSI.
RSI 1:
Bullish signal is generated when the set value is crossed from the bottom to the top.
Bearish signal is generated when the set value is crossed from the top to the bottom.
RSI 2:
Bullish signal is generated when the set value is crossed from the top to the bottom.
Bearish signal is generated when the set value is crossed from bottom to top.
For RSI 2 the theory is taken into account according to the description under Used elements point 5
Optical trend filter:
Also an optical trend filter was generated which fills the bands accordingly.
For this the VWMA is used and the two average values of the band.
Color definition:
Gray = Neutral
Red = Bearish
Green = Bullish
If the mean value is above the VWMA and the mean value based on the closing price is above the mean value based on the open price, the band is colored green. It is a bullish trend
If the mean value is below the VWMA and the mean value based on the closing price is below the mean value based on the open price, the band is colored red.
The band is colored gray if the mean value is correspondingly opposite. A sideways phase is assumed.
The script was developed on the basis of the pair BTCUSD in the 15 minute chart and the settings were defined accordingly on it. The display of S/R for forex pairs does not work correctly and should be hidden. The logic works anyway.
When using the script, all options should first be set accordingly to the asset and tested before trading afterwards. It applies of course also here that there is no 100% guarantee.
Also, a strong breakout leads to false signals and overheating of the indicator.

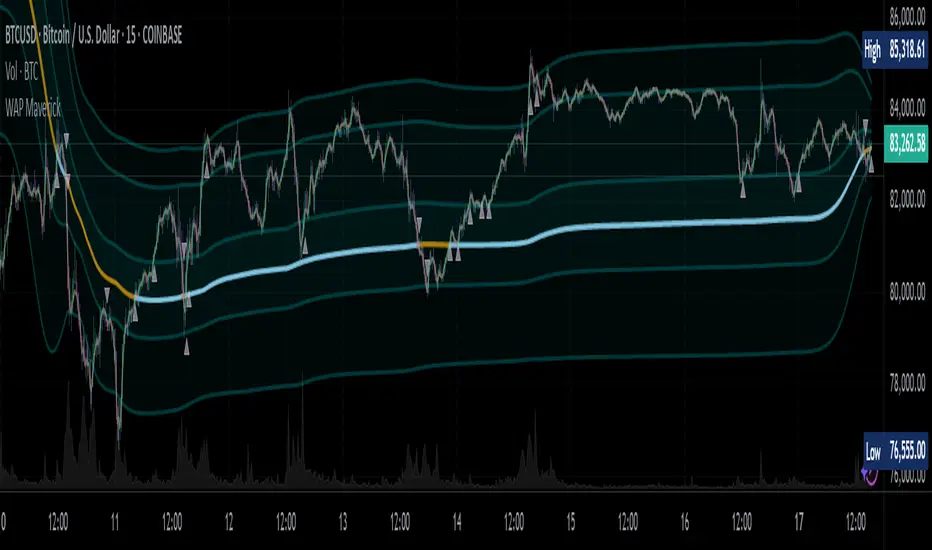
WAP Maverick - (Dual EMA Smoothed VWAP) - [mutantdog]Short Version:
This here is my take on the popular VWAP indicator with several novel features including:
Dual EMA smoothing.
Arithmetic and Harmonic Mean plots.
Custom Anchor feat. Intraday Session Sizes.
2 Pairs of Bands.
Side Input for Connection to other Indicator.
This can be used 'out of the box' as a replacement VWAP, benefitting from smoother transitions and easy-to-use custom alerts.
By design however, this is intended to be a highly customisable alternative with many adjustable parameters and a pseudo-modular input system to connect with another indicator. Well suited for the tweakers around here and those who like to get a little more creative.
I made this primarily for crypto although it should work for other markets. Default settings are best suited to 15m timeframe - the anchor of 1 week is ideal for crypto which often follows a cyclical nature from Monday through Sunday. In 15m, the default ema length of 21 means that the wap comes to match a standard vwap towards the end of Monday. If using higher chart timeframes, i recommend decreasing the ema length to closely match this principle (suggested: for 1h chart, try length = 8; for 4h chart, length = 2 or 3 should suffice).
Note: the use of harmonic mean calculations will cause problems on any data source incorporating both positive and negative values, it may also return unusable results on extremely low-value charts (eg: low-sat coins in /btc pairs).
Long version:
The development of this project was one driven more by experimentation than a specific end-goal, however i have tried to fine-tune everything into a coherent usable end-product. With that in mind then, this walkthrough will follow something of a development chronology as i dissect the various functions.
DUAL-EMA SMOOTHING
At its core this is based upon / adapted from the standard vwap indicator provided by TradingView although I have modified and changed most of it. The first mod is the dual ema smoothing. Rather than simply applying an ema to the output of the standard vwap function, instead i have incorporated the ema in a manner analogous to the way smas are used within a standard vwma. Sticking for now with the arithmetic mean, the basic vwap calculation is simply sum(source * volume) / sum(volume) across the anchored period. In this case i have simply applied an ema to each of the numerator and denominator values resulting in ema(sum(source * volume)) / ema(sum(volume)) with the ema length independent of the anchor. This results in smoother (albeit slower) transitions than the aforementioned post-vwap method. Furthermore in the case when anchor period is equal to current timeframe, the result is a basic volume-weighted ema.
The example below shows a standard vwap (1week anchor) in blue, a 21-ema applied to the vwap in purple and a dual-21-ema smoothed wap in gold. Notably both ema types come to effectively resemble the standard vwap after around 24 hours into the new anchor session but how they behave in the meantime is very different. The dual-ema transitions quite gradually while the post-vwap ema immediately sets about trying to catch up. Incidentally. a similar and slower variation of the dual-ema can be achieved with dual-rma although i have not included it in this indicator, attempted analogues using sma or wma were far less useful however.
STANDARD DEVIATION AND BANDS
With this updated calculation, a corresponding update to the standard deviation is also required. The vwap has its own anchored volume-weighted st.dev but this cannot be used in combination with the ema smoothing so instead it has been recalculated appropriately. There are two pairs of bands with separate multipliers (stepped to 0.1x) and in both cases high and low bands can be activated or deactivated individually. An example usage for this would be to create different upper and lower bands for profit and stoploss targets. Alerts can be set easily for different crossing conditions, more on this later.
Alongside the bands, i have also added the option to shift ('Deviate') the entire indicator up or down according to a multiple of the corrected st.dev value. This has many potential uses, for example if we want to bias our analysis in one direction it may be useful to move the wap in the opposite. Or if the asset is trading within a narrow range and we are waiting on a breakout, we could shift to the desired level and set alerts accordingly. The 'Deviate' parameter applies to the entire indicator including the bands which will remain centred on the main WAP.
CUSTOM (W)ANCHOR
Ever thought about using a vwap with anchor periods smaller than a day? Here you can do just that. I've removed the Earnings/Dividends/Splits options from the basic vwap and added an 'Intraday' option instead. When selected, a custom anchor length can be created as a multiple of minutes (default steps of 60 mins but can input any value from 0 - 1440). While this may not seem at first like a useful feature for anyone except hi-speed scalpers, this actually offers more interesting potential than it appears.
When set to 0 minutes the current timeframe is always used, turning this into the basic volume-weighted ema mentioned earlier. When using other low time frames the anchor can act as a pre-ema filter creating a stepped effect akin to an adaptive MA. Used in combination with the bands, the result is a kind of volume-weighted adaptive exponential bollinger band; if such a thing does not already exist then this is where you create it. Alternatively, by combining two instances you may find potential interesting crosses between an intraday wap and a standard timeframe wap. Below is an example set to intraday with 480 mins, 2x st.dev bands and ema length 21. Included for comparison in purple is a standard 21 ema.
I'm sure there are many potential uses to be found here, so be creative and please share anything you come up with in the comments.
ARITHMETIC AND HARMONIC MEAN CALCULATIONS
The standard vwap uses the arithmetic mean in its calculation. Indeed, most mean calculations tend to be arithmetic: sma being the most widely used example. When volume weighting is involved though this can lead to a slight bias in favour of upward moves over downward. While the effect of this is minor, over longer anchor periods it can become increasingly significant. The harmonic mean, on the other hand, has the opposite effect which results in a value that is always lower than the arithmetic mean. By viewing both arithmetic and harmonic waps together, the extent to which they diverge from each other can be used as a visual reference of how much price has changed during the anchored period.
Furthermore, the harmonic mean may actually be the more appropriate one to use during downtrends or bearish periods, in principle at least. Consider that a short trade is functionally the same as a long trade on the inverse of the pair (eg: selling BTC/USD is the same as buying USD/BTC). With the harmonic mean being an inverse of the arithmetic then, it makes sense to use it instead. To illustrate this below is a snapshot of LUNA/USDT on the left with its inverse 1/(LUNA/USDT) = USDT/LUNA on the right. On both charts is a wap with identical settings, note the resistance on the left and its corresponding support on the right. It should be easy from this to see that the lower harmonic wap on the left corresponds to the upper arithmetic wap on the right. Thus, it would appear that the harmonic mean should be used in a downtrend. In principle, at least...
In reality though, it is not quite so black and white. Rarely are these values exact in their predictions and the sort of range one should allow for inaccuracies will likely be greater than the difference between these two means. Furthermore, the ema smoothing has already introduced some lag and thus additional inaccuracies. Nevertheless, the symmetry warrants its inclusion.
SIDE INPUT & ALERTS
Finally we move on to the pseudo-modular component here. While TradingView allows some interoperability between indicators, it is limited to just one connection. Any attempt to use multiple source inputs will remove this functionality completely. The workaround here is to instead use custom 'string' input menus for additional sources, preserving this function in the sole 'source' input. In this case, since the wap itself is dependant only price and volume, i have repurposed the full 'source' into the second 'side' input. This allows for a separate indicator to interact with this one that can be used for triggering alerts. You could even use another instance of this one (there is a hidden wap:mid plot intended for this use which is the midpoint between both means). Note that deleting a connected indicator may result in the deletion of those connected to it.
Preset alertconditions are available for crossings of the side input above and below the main wap, alongside several customisable alerts with corresponding visual markers based upon selectable conditions. Alerts for band crossings apply only to those that are active and only crossings of the type specified within the 'crosses' subsection of the indicator settings. The included options make it easy to create buy alerts specific to certain bands with sell alerts specific to other bands. The chart below shows two instances with differing anchor periods, both are connected with buy and sell alerts enabled for visible bands.
Okay... So that just about covers it here, i think. As mentioned earlier this is the product of various experiments while i have been learning my way around PineScript. Some of those experiments have been branched off from this in order to not over-clutter it with functions. The pseudo-modular design and the 'side' input are the result of an attempt to create a connective framework across various projects. Even on its own though, this should offer plenty of tweaking potential for anyone who likes to venture away from the usual standards, all the while still retaining its core purpose as a traders tool.
Thanks for checking this out. I look forward to any feedback below.
Grok/Claude AI Neural Fusion Pro * Grok/Claude X SeriesGrok/Claude AI Neural Fusion Pro
This is a TradingView indicator that combines multiple technical analysis methods into a unified scoring system to identify trading opportunities. Despite the "Neural" and "AI" branding, it's not actually using machine learning — it's a sophisticated blend of traditional indicators weighted together to produce a single decision-aiding score.
Core Philosophy
The indicator attempts to answer the question: "How bullish or bearish is the current market environment, and when should I consider entering a trade?"
It does this by calculating a "GXS Score" (ranging from -1 to +1) that aggregates five different market dimensions: trend strength, momentum, volume, price structure, and price action quality. Each dimension contributes to the final score based on user-defined weights.
The Dynamic Bands System
Rather than using standard Bollinger Bands, this indicator creates adaptive bands that expand and contract based on market conditions. The bands are built around a midpoint calculated from Heikin Ashi candles (smoothed price bars that filter out noise), then extended outward using ATR (Average True Range) multiplied by a dynamic factor.
What makes these bands "dynamic" is that the multiplier adjusts based on two factors: the Chaikin Oscillator (which measures buying/selling pressure through accumulation/distribution) and ADX (trend strength). When there's strong directional pressure or a powerful trend, the bands widen to accommodate larger price swings. In quieter markets, they tighten.
The Five Scoring Components
The GXS Score is built from five weighted components:
ComponentDefault WeightWhat It MeasuresTrend Strength30%ADX direction and magnitude — is there a real trend, and which way?Momentum25%RSI, MACD, Stochastic, CCI, Rate of Change, plus divergence detectionVolume20%On-Balance Volume slope and whether volume confirms price movementPrice Structure15%Where price sits within the bands, plus volatility regimePrice Action10%Ratio of bullish vs bearish candles over recent bars
Trend Strength Component
This component only contributes to the score when ADX indicates a trending market (above the threshold, default 24). If DI+ exceeds DI-, the score tilts bullish; if DI- dominates, it tilts bearish. In ranging markets, this component essentially zeros out, preventing false trend signals during choppy conditions.
Momentum Component
This is the most complex component, combining six sub-indicators. RSI is normalized around the 50 level. MACD histogram is standardized against its own volatility. Stochastic and CCI contribute bonus points at extreme levels (oversold/overbought). Rate of Change adds directional bias for strong moves. Finally, divergence detection looks for situations where price makes new highs/lows but RSI doesn't confirm — a classic reversal warning.
Volume Component
The indicator tracks On-Balance Volume (a cumulative measure of buying vs selling pressure) and compares it to its moving average. When OBV is rising above its average during an uptrend, that's confirmation. The volume rate of change also contributes — surging volume adds conviction to signals.
Price Structure Component
This measures where the current price sits within the dynamic bands. If price is in the bottom 20% of the band range, that's bullish (potential bounce zone). If it's in the top 20%, that's bearish (potential resistance). The component also factors in volatility regime — low volatility environments get a slight bullish bias (breakouts tend to follow compression), while high volatility gets a bearish bias (exhaustion risk).
Price Action Component
A simple measure of recent candle character. If 70%+ of the last 10 candles were bullish (closed higher than they opened), the score tilts positive. Heavy bearish candle dominance tilts it negative.
Signal Generation
Buy and sell signals are generated when price touches or breaches the dynamic bands, but only if several filters pass:
ADX Filter (optional): Requires the market to be trending, avoiding signals in choppy conditions
RSI Filter (optional): For buys, RSI must be oversold (below 30); for sells, RSI must be overbought (above 70)
Cooldown Period: Prevents signal spam by requiring a minimum number of bars between signals (default 6)
The indicator also tracks "zones" based purely on the GXS Score. When the score exceeds the buy threshold (default 0.12) during a trending market, a green cloud appears between the bands. When it drops below the sell threshold (default -0.12), a red cloud appears. These zones indicate favorable conditions even without a specific band-touch signal.
Trend Strength Meter
Separate from the GXS Score, the indicator calculates a "Trend Strength" percentage (0-100%) displayed in the info table. This combines ADX strength (40% weight), slope consistency (30% — how steady is the price direction), volume alignment (20% — is volume confirming the move), and momentum agreement (10% — are multiple indicators pointing the same direction). This helps traders gauge how reliable the current trend is.
Visual Elements
The indicator provides multiple visual layers that can be toggled on or off:
Dynamic bands (blue midline, red upper, green lower)
Signal clouds between the bands when in buy/sell zones
Background shading indicating bullish (green) or bearish (red) regime
Triangle arrows at signal points with configurable sizes
Price labels showing exact entry prices at signals
ADX strength dots at the bottom (white = weak, orange = moderate, blue = strong)
Info table with current readings for all key metrics
Debug panel (optional) showing individual component scores
Summary
This is essentially a "committee voting" system where multiple technical indicators each cast votes on market direction, and those votes are weighted and summed into a single score. The dynamic bands provide context for where price is relative to recent volatility, while the various filters help avoid low-quality signals. It's designed for traders who want a synthesized view of market conditions rather than watching a dozen separate indicators.

Abacus Community Williams %R + Bollinger %B📌 Indicator Description (Professional & Clear)
Williams %R + Bollinger %B Momentum Indicator (ThinkOrSwim Style)
This custom indicator combines Williams %R and Bollinger %B into a single, unified panel to provide a powerful momentum-and-positioning view of price action. Modeled after the ThinkOrSwim version used by professional traders, it displays:
✅ Williams %R (10-period) – Yellow Line
This oscillator measures the market's position relative to recent highs and lows.
It plots on a 0% to 100% scale, where:
80–100% → Overbought region
20–0% → Oversold region
50% → Momentum equilibrium
Williams %R helps identify exhaustion, trend strength, and potential reversal zones.
✅ Bollinger %B (20, 2.0) – Turquoise Histogram Bars
%B shows where price is trading relative to the Bollinger Bands:
Above 50% → Price is in the upper half of the band (bullish pressure)
Below 50% → Price is in the lower half (bearish pressure)
Near 100% → Price pushing upper band (possible breakout)
Near 0% → Price testing lower band (possible breakdown)
The histogram visually represents momentum shifts in real time, creating a clean profile of volatility and strength.
🎯 Why This Combination Works
Together, Williams %R and Bollinger %B reveal:
Momentum direction
Overbought/oversold conditions
Volatility compression & expansion
Trend continuation vs reversal zones
High-probability inflection points
Williams %R shows oscillation and exhaustion, while %B shows pressure inside volatility bands.
The combination helps identify whether momentum supports the current trend or is weakening.
🔍 Use Cases
Detect early trend reversals
Validate breakouts and breakdowns
Spot momentum failure in price extremes
Confirm pullbacks and continuation setups
Time entries and exits with higher precision
💡 Best For
Swing traders
Momentum traders
Trend-followers
Options traders (for timing premium decay or volatility expansion)

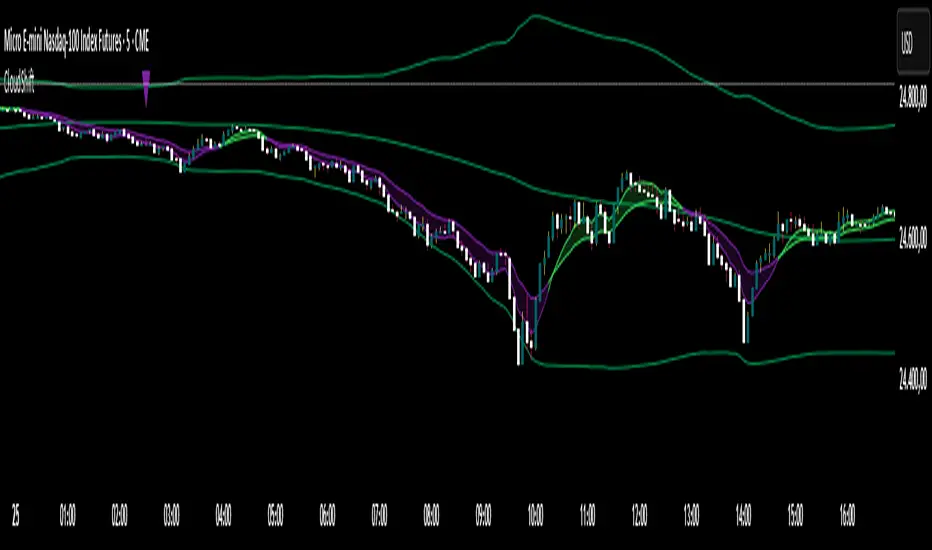
CloudShiftCloudShift + Bollinger Bands
This version of CloudShift now includes fully optimized Bollinger Bands with all three dynamic lines:
Upper Band: Highlights expansion during volatility spikes.
Lower Band: Identifies compression and accumulation zones.
Centerline (Basis): A smooth reference of the moving average, providing better visual balance and directional context.
The bands are drawn with thin, clean lime lines, designed to integrate perfectly with the cloud logic — keeping your chart minimalist yet powerful.
This update enhances the CloudShift indicator by providing a clear visual framework of market volatility and structure without altering its original logic.
Recommended for use on: NASDAQ, S&P 500, and other high-volatility futures.
Recommended timeframe: 5–15 minutes.
RSI Pivots with Divergence Overlay█ OVERVIEW
The RSI Pivots with Divergence Overlay indicator is an advanced tool based on RSI, displaying dynamic bands on the price chart to simplify the identification of overbought and oversold conditions. Pivot points and divergences between them are derived from these bands, providing a comprehensive view of the market and enabling the creation of various trading strategies based on this single indicator.
█ CONCEPTS
Areas where RSI exits the bands are often reversal points in the market. The concept of this indicator is to highlight places where the probability of a trend reversal increases. Therefore, pivots and divergences have been added to better identify these key moments. Additionally, the bands allow viewing the market context in relation to the RSI indicator, facilitating analysis of momentum and volatility.
█ KEY FEATURES
Dynamic Bands and RSI Signals: The bands are calculated based on the closing price and RSI value, with dynamic scaling adjusted to market volatility. The upper band corresponds to overbought levels, the lower to oversold, and the midline is their average. The price level relative to the bands serves as a visual RSI signal, indicating potential overbought or oversold conditions.
Pivot Points: The indicator identifies local price highs and lows in relation to RSI levels. The pivot level is taken from the high/low of the candle. A high pivot is detected when the high of the candle reaches a local maximum after crossing the upper RSI level (overbought), signaling a potential reversal. A low pivot appears after a local price minimum following a drop below the lower RSI level (oversold), indicating a possible uptrend reversal. The pivot length (default 2 bars) defines the search range for these extremes, meaning that with a length of 2, a potential divergence signal will appear with a 2-candle delay, as this is the minimum time required to confirm a local pivot. Pivot lines are drawn on the chart, and labels display the RSI value (from the close of the candle) and price at the detection moment. Pivot lines disappear after the detection of the next low pivot for lower lines and high pivot for upper lines, but unbreached lines or those with high volume may still serve as support or resistance levels.
Divergence Detection: The indicator automatically detects divergences to predict trend changes. Bearish divergence occurs when the price forms a higher high pivot, but the RSI (from the close of the candle) is lower than in the previous pivot, indicating weakening upward momentum and a potential bearish reversal. Bullish divergence appears when the price forms a lower low pivot, but the RSI is higher, suggesting building momentum and a possible bullish reversal. Divergences are marked in pivot labels (e.g., "Bear Div" or "Bull Div") and supported by alerts upon detection.
Return Signals: The indicator generates buy and sell signals based on RSI (price) returning to the bands after extreme conditions, independently of pivots and divergences. A buy signal is triggered when RSI (price) crosses above the lower level (exiting oversold), suggesting a potential price rise toward the midline or upper band. A sell signal occurs when RSI (price) falls below the upper level (exiting overbought), indicating a possible price drop toward the lower band. Signals are visualized as arrows (up/down triangles) on the chart, with customizable colors.
█ CONFIGURATION
The indicator offers extensive customization options:
RSI Length (rsiLength): Sets the number of periods used to calculate RSI (default 14).
RSI Upper Level (rsiUpper): Defines the overbought threshold (default 70).
RSI Lower Level (rsiLower): Defines the oversold threshold (default 30).
Band Scaling (scale): Determines the scaling multiplier for bands based on market volatility (default 15.0).
SMA Length for Candle Midpoint (length): Number of periods for calculating the moving average of candle midpoints (default 200). This parameter is used to smooth price data, enabling more accurate volatility assessment and band width adjustment to market dynamics.
Pivot Length (pivotLength): Sets the range (in bars) for detecting local price extremes (default 2).
Pivot Label Offset (pivotLabelOffset): Multiplier for the candle range to position pivot labels (default 0.3).
Show Bands (showBands): Enables/disables the display of bands on the chart.
Show Fill (showFill): Enables/disables the fill between bands and the midline.
Show Pivot Lines (showPivotLines): Enables/disables pivot lines on the chart.
Show Pivot Labels (showPivotLabels): Enables/disables labels with RSI and price values at pivots.
Show Return Signals (showReturnSignals): Enables/disables the display of buy and sell signals.
Colors and Style: Customizable colors for bands, fills, pivot lines, labels, and line widths (default 1).
█ USAGE
The indicator performs best when combined with other technical analysis tools, such as Fibonacci levels, moving averages, or trendlines, to confirm pivot, divergence, and return signals. It enables traders to identify key reversal points, detect hidden trend weaknesses through divergences, and confirm trade entries with return signals.
Usage Examples:
Price bounces off a previous pivot with high volume – this increases the probability of a trend change or correction.
A similar situation when RSI is outside the bands strengthens the signal.
If divergence occurs in addition, we have further confirmation.
This can be combined with Fibonacci levels to check if Fibo zones overlap with pivot lines – this may increase the chance of a strong price reaction.
█ ALERTS
The indicator supports alerts for:
Buy and sell signals (RSI returning to bands).
Detection of bearish and bullish divergences.

OB/OS adaptative v1.1# OB/OS Adaptative v1.1 - Multi-Timeframe Adaptive Overbought/Oversold Indicator
## Overview
The `tradingview_indicator_emas.pine` script is a sophisticated multi-timeframe indicator designed to identify dynamic overbought and oversold levels in financial markets. It combines EMA (Exponential Moving Average) crossovers and Bollinger Bands across monthly, weekly, and daily timeframes to create adaptive support and resistance levels that adjust to changing market conditions.
## Core Functionality
### Multi-Timeframe Analysis
The indicator analyzes three timeframes simultaneously:
- **Monthly (M)**: Long-term trend identification
- **Weekly (W)**: Intermediate-term trend identification
- **Daily (D)**: Short-term volatility measurement
### Technical Indicators Used
- **EMA 9 and EMA 20**: For trend identification and momentum assessment
- **Bollinger Bands (20-period)**: For volatility measurement and extreme level identification
- **Price action**: For confirmation of level validity and signal generation
## Key Features
### Adaptive Level Calculation
The indicator dynamically determines overbought and oversold levels based on market structure and trend bias:
#### Monthly Level Logic
- **Bullish Bias** (when monthly open > EMA20):
- Oversold = lower of EMA9 or EMA20
- Overbought = upper of EMA9 or Bollinger Upper Band
- **Bearish/Neutral Bias** (when monthly open ≤ EMA20):
- Oversold = Bollinger Lower Band
- Overbought = upper of EMA20 or EMA9
#### Weekly Level Logic
- **Bullish Bias** (when weekly open > EMA20):
- Oversold = lower of EMA9 or EMA20
- Overbought = Bollinger Upper Band
- **Bearish/Neutral Bias** (when weekly open ≤ EMA20):
- Oversold = Bollinger Lower Band
- Overbought = upper of EMA20 or EMA9
#### Daily Level Logic
- Simple Bollinger Bands:
- Oversold = Bollinger Lower Band
- Overbought = Bollinger Upper Band
### Final Level Determination
The indicator combines all three timeframes through a weighted averaging process:
1. Calculates initial values as the average of monthly, weekly, and daily levels
2. Ensures mathematical consistency by enforcing overbought_final ≥ oversold_final using min/max functions
3. Calculates a midpoint average level as the center of the range
### Visual Elements
- **Dynamic Lines**: Draws horizontal lines for current and previous period overbought, oversold, and average levels
- **Labels**: Places clear textual labels at the start of each period
- **Color Coding**:
- Red for overbought levels (resistance)
- Green for oversold levels (support)
- Blue for average levels (pivot point)
- **Transparency**: Previous period lines use semi-transparent colors to distinguish between current and historical levels
### Update Mechanism
- **Calculation Day**: User-defined day of the week (default: Monday)
- On the specified calculation day, the indicator:
- Updates all levels based on previous bar's data
- Draws new lines extending forward for a user-defined number of days
- Maintains previous period lines for comparison and trend analysis
- Automatically deletes and recreates lines to ensure clean visualization
### Proximity Detection
- Alerts when price approaches overbought/oversold levels (configurable distance in percentage)
- Helps identify potential reversal zones before actual crossovers occur
- Distance thresholds are user-configurable for both overbought and oversold conditions
### Alert Conditions
The indicator provides four distinct alert types:
1. **Cross below oversold**: Triggered when price crosses below the oversold level
2. **Cross above overbought**: Triggered when price crosses above the overbought level
3. **Near oversold**: Triggered when price approaches the oversold level within the configured distance
4. **Near overbought**: Triggered when price approaches the overbought level within the configured distance
### Debug Mode
When enabled, displays comprehensive debug information including:
- Current values for all levels (oversold, overbought, average)
- Timeframe-specific calculations and raw data points
- System status information (current day, calculation day, etc.)
- Lines existence and timing information
- Organized in multiple labels at different price levels to avoid overlap
## Configuration Parameters
| Parameter | Default Value | Description |
|---------|---------------|-------------|
| Short EMA (9) | 9 | Length for short-term EMA calculation |
| Long EMA (20) | 20 | Length for long-term EMA calculation |
| BB Length | 20 | Period for Bollinger Bands calculation |
| Std Dev | 2.0 | Standard deviation multiplier for Bollinger Bands |
| Distance to overbought (%) | 0.5 | Percentage threshold for "near overbought" alerts |
| Distance to oversold (%) | 0.5 | Percentage threshold for "near oversold" alerts |
| Calculation day | Monday | Day of week when levels are recalculated |
| Lookback days | 7 | Number of days to extend previous period lines backward |
| Forward days | 7 | Number of days to extend current period lines forward |
| Show Debug Labels | false | Toggle for comprehensive debug information display |
## Trading Applications
### Primary Use Cases
1. **Reversal Trading**: Identify potential reversal zones when price approaches overbought/oversold levels
2. **Trend Confirmation**: Use the adaptive nature of levels to confirm trend strength and direction
3. **Position Sizing**: Adjust position size based on distance from key levels
4. **Stop Placement**: Use opposite levels as dynamic stop-loss references
### Strategic Advantages
- **Adaptive Nature**: Levels adjust to changing market volatility and trend structure
- **Multi-Timeframe Confirmation**: Signals are validated across multiple timeframes
- **Visual Clarity**: Clear color-coded lines and labels enhance decision-making
- **Proactive Alerts**: "Near" conditions provide early warnings before crossovers
## Implementation Details
### Data Security
Uses `request.security()` function to fetch data from higher timeframes (monthly, weekly) while maintaining proper bar indexing with ` ` offset for open prices.
### Performance Optimization
- Uses `var` keyword to declare persistent variables that maintain state across bars
- Efficient line and label management with proper deletion before recreation
- Conditional execution of debug code to minimize performance impact
### Error Handling
- Comprehensive NA (not available) checks throughout the code
- Graceful degradation when data is unavailable for higher timeframes
- Mathematical safeguards to prevent invalid level calculations
## Conclusion
The OB/OS Adaptative v1.1 indicator represents a sophisticated approach to identifying market extremes by combining multiple technical analysis concepts. Its adaptive nature makes it particularly useful in trending markets where static levels may be less effective. The multi-timeframe approach provides a comprehensive view of market structure, while the visual elements and alert system enhance its practical utility for active traders.

Squeeze & Breakout Confirmation StrategyThis strategy focuses on identifying periods of low volatility (Bollinger Band Squeeze) and then confirming the direction of the subsequent breakout with momentum, volume, and candle strength.
Concepts Applied: Bollinger Bands (Squeeze), RSI (Momentum), Market Volume (Conviction), Candle Size (Strength)
Buy Signal:
Bollinger Band Squeeze: Look for a period where the Bollinger Bands contract significantly, indicating low volatility and consolidation. The bands should be very close to the price action.
RSI Breakout: After the squeeze, wait for the price to break decisively above the upper Bollinger Band. Simultaneously, the RSI should break above 60 (or even 70), indicating strong bullish momentum.
Volume Surge: The breakout candle should be accompanied by a significant increase in trading volume, ideally above its recent average, confirming strong buying interest.
Strong Bullish Candle: The breakout candle itself should be a large, bullish candle (e.g., a strong green candle with a small upper wick or a bullish engulfing pattern), demonstrating buyer conviction.
Sell Signal (Short):
Bollinger Band Squeeze: Look for a period where the Bollinger Bands contract significantly.
RSI Breakdown: After the squeeze, wait for the price to break decisively below the lower Bollinger Band. Simultaneously, the RSI should break below 40 (or even 30), indicating strong bearish momentum.
Volume Surge: The breakdown candle should be accompanied by a significant increase in trading volume, ideally above its recent average, confirming strong selling interest.
Strong Bearish Candle: The breakdown candle itself should be a large, bearish candle (e.g., a strong red candle with a small lower wick or a bearish engulfing pattern), demonstrating seller conviction.

Elastic Volume-Weighted Student-T TensionOverview
The Elastic Volume-Weighted Student-T Tension Bands indicator dynamically adapts to market conditions using an advanced statistical model based on the Student-T distribution. Unlike traditional Bollinger Bands or Keltner Channels, this indicator leverages elastic volume-weighted averaging to compute real-time dispersion and location parameters, making it highly responsive to volatility changes while maintaining robustness against price fluctuations.
This methodology is inspired by incremental calculation techniques for weighted mean and variance, as outlined in the paper by Tony Finch:
📄 "Incremental Calculation of Weighted Mean and Variance" .
Key Features
✅ Adaptive Volatility Estimation – Uses an exponentially weighted Student-T model to dynamically adjust band width.
✅ Volume-Weighted Mean & Dispersion – Incorporates real-time volume weighting, ensuring a more accurate representation of market sentiment.
✅ High-Timeframe Volume Normalization – Provides an option to smooth volume impact by referencing a higher timeframe’s cumulative volume, reducing noise from high-variability bars.
✅ Customizable Tension Parameters – Configurable standard deviation multipliers (σ) allow for fine-tuned volatility sensitivity.
✅ %B-Like Oscillator for Relative Price Positioning – The main indicator is in form of a dedicated oscillator pane that normalizes price position within the sigma ranges, helping identify overbought/oversold conditions and potential momentum shifts.
✅ Robust Statistical Foundation – Utilizes kurtosis-based degree-of-freedom estimation, enhancing responsiveness across different market conditions.
How It Works
Volume-Weighted Elastic Mean (eμ) – Computes a dynamic mean price using an elastic weighted moving average approach, influenced by trade volume, if not volume detected in series, study takes true range as replacement.
Dispersion (eσ) via Student-T Distribution – Instead of assuming a fixed normal distribution, the bands adapt to heavy-tailed distributions using kurtosis-driven degrees of freedom.
Incremental Calculation of Variance – The indicator applies Tony Finch’s incremental method for computing weighted variance instead of arithmetic sum's of fixed bar window or arrays, improving efficiency and numerical stability.
Tension Calculation – There are 2 dispersion custom "zones" that are computed based on the weighted mean and dynamically adjusted standard student-t deviation.
%B-Like Oscillator Calculation – The oscillator normalizes the price within the band structure, with values between 0 and 1:
* 0.00 → Price is at the lower band (-2σ).
* 0.50 → Price is at the volume-weighted mean (eμ).
* 1.00 → Price is at the upper band (+2σ).
* Readings above 1.00 or below 0.00 suggest extreme movements or possible breakouts.
Recommended Usage
For scalping in lower timeframes, it is recommended to use the fixed α Decay Factor, it is in raw format for better control, but you can easily make a like of transformation to N-bar size window like in EMA-1 bar dividing 2 / decayFactor or like an RMA dividing 1 / decayFactor.
The HTF selector catch quite well Higher Time Frame analysis, for example using a Daily chart and using as HTF the 200-day timeframe, weekly or monthly.
Suitable for trend confirmation, breakout detection, and mean reversion plays.
The %B-like oscillator helps gauge momentum strength and detect divergences in price action if user prefer a clean chart without bands, this thanks to pineScript v6 force overlay feature.
Ideal for markets with volume-driven momentum shifts (e.g., futures, forex, crypto).
Customization Parameters
Fixed α Decay Factor – Controls the rate of volume weighting influence for an approximation EWMA approach instead of using sum of series or arrays, making the code lightweight & computing fast O(1).
HTF Volume Smoothing – Instead of a fixed denominator for computing α , a volume sum of the last 2 higher timeframe closed candles are used as denominator for our α weight factor. This is useful to review mayor trends like in daily, weekly, monthly.
Tension Multipliers (±σ) – Adjusts sensitivity to dispersion sigma parameter (volatility).
Oscillator Zone Fills – Visual cues for price positioning within the cloud range.
Posible Interpretations
As market within indicators relay on each individual edge, this are just some key ideas to glimpse how the indicator could be interpreted by the user:
📌 Price inside bands – Market is considered somehow "stable"; price is like resting from tension or "charging batteries" for volume spike moves.
📌 Price breaking outer bands – Potential breakout or extreme movement; watch for reversals or continuation from strong moves. Market is already in tension or generating it.
📌 Narrowing Bands – Decreasing volatility; expect contraction before expansion.
📌 Widening Bands – Increased volatility; prepare for high probability pull-back moves, specially to the center location of the bands (the mean) or the other side of them.
📌 Oscillator is just the interpretation of the price normalized across the Student-T distribution fitting "curve" using the location parameter, our Elastic Volume weighted mean (eμ) fixed at 0.5 value.
Final Thoughts
The Elastic Volume-Weighted Student-T Tension indicator provides a powerful, volume-sensitive alternative to traditional volatility bands. By integrating real-time volume analysis with an adaptive statistical model, incremental variance computation, in a relative price oscillator that can be overlayed in the chart as bands, it offers traders an edge in identifying momentum shifts, trend strength, and breakout potential. Think of the distribution as a relative "tension" rubber band in which price never leave so far alone.
DISCLAIMER:
The Following indicator/code IS NOT intended to be a formal investment advice or recommendation by the author, nor should be construed as such. Users will be fully responsible by their use regarding their own trading vehicles/assets.
The following indicator was made for NON LUCRATIVE ACTIVITIES and must remain as is, following TradingView's regulations. Use of indicator and their code are published for work and knowledge sharing. All access granted over it, their use, copy or re-use should mention authorship(s) and origin(s).
WARNING NOTICE!
THE INCLUDED FUNCTION MUST BE CONSIDERED FOR TESTING. The models included in the indicator have been taken from open sources on the web and some of them has been modified by the author, problems could occur at diverse data sceneries, compiler version, or any other externality.

Optimized Dynamic SupertrendDetailed Explanation of the Optimized Dynamic Supertrend Script
This Supertrend script is designed to dynamically adapt to different market conditions using ATR expansion, volume confirmation, and trend filtering. Below is a step-by-step breakdown of how it works and its functions.
1 ATR-Based Supertrend Calculation
📌 Key Purpose:
The script calculates an adaptive ATR-based Supertrend line, which acts as a dynamic support or resistance level for trend direction.
📌 How it Works:
ATR (Average True Range) is used to measure market volatility.
A dynamic ATR multiplier is applied based on price standard deviation (instead of a fixed value).
The Supertrend is calculated as:
Upper Band: SMA(close, ATR length) + (ATR Multiplier * ATR Value)
Lower Band: SMA(close, ATR length) - (ATR Multiplier * ATR Value)
The Supertrend flips when price crosses and holds beyond the Supertrend line.
🔹 Dynamic Adjustment:
Instead of using a fixed ATR multiplier, the script adjusts it using:
pinescript
Copy
Edit
dynamicFactor = ta.stdev(close, atrLength) / ta.sma(close, atrLength)
atrMultiplier = input(1.5, title="Base ATR Multiplier") * dynamicFactor
High volatility → Wider Supertrend bands (to avoid false signals).
Low volatility → Tighter Supertrend bands (for faster detection).
2 Trend Detection Logic
📌 Key Purpose:
Determines if the market is in a bullish or bearish trend based on price action.
Uses volume sensitivity and ATR expansion to reduce false signals.
📌 How it Works:
pinescript
Copy
Edit
var float supertrend = na
supertrend := close > nz(supertrend , lowerBand) ? lowerBand : upperBand
The Supertrend value updates dynamically.
If price is above the Supertrend line, the trend is bullish (green).
If price is below the Supertrend line, the trend is bearish (red).
3 Volume Sensitivity Confirmation
📌 Key Purpose:
Avoid false trend flips by confirming with volume (approximated using a CVD proxy).
📌 How it Works:
pinescript
Copy
Edit
priceChange = close - close
volumeWeightedTrend = priceChange * volume // Approximate CVD Behavior
trendConfirmed = volumeWeightedTrend > 0 ? close > supertrend : close < supertrend
Positive price change + High volume → Confirms bullish momentum.
Negative price change + High volume → Confirms bearish momentum.
If there’s low volume, the trend change is ignored to avoid false breakouts.
4 Noise Reduction (Final Trend Confirmation)
📌 Key Purpose:
Filter out weak or choppy price movements using ATR expansion.
📌 How it Works:
pinescript
Copy
Edit
trendUp = trendConfirmed and ta.atr(atrLength) > ta.atr(atrLength)
trendDown = not trendUp
Trend only flips when confirmed by volume + ATR expansion.
If ATR is not expanding, the script ignores weak price movements.
This ensures Supertrend signals align with strong market moves.
5 Can This Be Used on All Timeframes?
✅ YES! This Supertrend is adaptive, meaning it adjusts dynamically based on:
Volatility: Uses ATR expansion to adjust for different market conditions.
Timeframe Sensitivity: Works on any timeframe (1M, 5M, 15M, 1H, 4H, 1D, 1W).
Market Structure: Confirms trend flips using volume & price movement strength.
🚀 Best Timeframes for Trading:
For Scalping (1M - 15M) → Quick execution, best with order flow confirmation.
For Swing Trading (1H - 4H - 1D) → Stronger trend signals, reduced noise.
For High Timeframes (3D - 1W) → Identifies major market shifts.
🔥 Advantages & Disadvantages in Your Trading Setup
✅ Advantages:
✔ Fully Dynamic & Adaptive → Adjusts to different timeframes & volatility.
✔ Reduces False Signals → Uses ATR expansion & volume confirmation.
✔ Precise Trend Reversals → Labels LONG & SHORT entries clearly.
✔ Works on Any Market → Crypto, Forex, Stocks, Commodities.
✔ No Extra Indicators → Pure Supertrend-based (fits your setup).
❌ Disadvantages:
⚠ Lagging Indicator → ATR & volume confirmation add slight delay.
⚠ Needs High Volume to Confirm → Weak volume → no trend flip.
⚠ Choppy Market = Late Entries → Sideways movement can cause delays.
🚀 Final Thoughts:
It’s fully dynamic & adaptive (unlike traditional static Supertrends).
No extra indicators → Uses only Supertrend logic
Refines entry points using volume & ATR confirmation (removes noise).
This ensures you get high-probability trend signals while filtering out weak breakouts! 🎯