TrendMaster Pro 2.3 with Alerts
Hello friends,
A member of the community approached me and asked me how to write an indicator that would achieve a particular set of goals involving comprehensive trend analysis, risk management, and session-based trading controls. Here is one example method of how to create such a system:
Core Strategy Components
Multi-Moving Average System - Uses configurable MA types (EMA, SMA, SMMA) with short-term (9) and long-term (21) periods for primary signal generation through crossovers
Higher Timeframe Trend Filter - Optional trend confirmation using a separate MA (default 50-period) to ensure trades align with broader market direction
Band Power Indicator - Dynamic high/low bands calculated using different MA types to identify price channels and volatility zones
Advanced Signal Filtering
Bollinger Bands Volatility Filter - Prevents trading during low-volatility ranging markets by requiring sufficient band width
RSI Momentum Filter - Uses customizable thresholds (55 for longs, 45 for shorts) to confirm momentum direction
MACD Trend Confirmation - Ensures MACD line position relative to signal line aligns with trade direction
Stochastic Oscillator - Adds momentum confirmation with overbought/oversold levels
ADX Strength Filter - Only allows trades when trend strength exceeds 25 threshold
Session-Based Trading Management
Four Trading Sessions - Asia (18:00-00:00), London (00:00-08:00), NY AM (08:00-13:00), NY PM (13:00-18:00)
Individual Session Limits - Separate maximum trade counts for each session (default 5 per session)
Automatic Session Closure - All positions close at specified market close time
Risk Management Features
Multiple Stop Loss Options - Percentage-based, MA cross, or band-based SL methods
Risk/Reward Ratio - Configurable TP levels based on SL distance (default 1:2)
Auto-Risk Calculation - Dynamic position sizing based on dollar risk limits ($150-$250 range)
Daily Limits - Stop trading after reaching specified TP or SL counts per day
Support & Resistance System
Multiple Pivot Types - Traditional, Fibonacci, Woodie, Classic, DM, and Camarilla calculations
Flexible Timeframes - Auto-adjusting or manual timeframe selection for S/R levels
Historical Levels - Configurable number of past S/R levels to display
Visual Customization - Individual color and display settings for each S/R level
Additional Features
Alert System - Customizable buy/sell alert messages with once-per-bar frequency
Visual Trade Management - Color-coded entry, SL, and TP levels with fill areas
Session Highlighting - Optional background colors for different trading sessions
Comprehensive Filtering - All signals must pass through multiple confirmation layers before execution
This approach demonstrates how to build a professional-grade trading system that combines multiple technical analysis methods with robust risk management and session-based controls, suitable for algorithmic trading across different market sessions.
Good luck and stay safe!
Cerca negli script per "band"

Multi-EnvelopeRMA Multi-Envelope Indicator
The RMA Multi-Envelope Indicator is a technical analysis tool designed for TradingView, utilizing Pine Script v6. It creates eight customizable envelope bands around a 200-period Running Moving Average (RMA) on a 5-minute timeframe, based on current market measurements. Each band has independent upper and lower percentage deviations, preset to: Band 1 (0.42%, 0.46%), Band 2 (0.78%, 0.69%), Band 3 (1.01%, 1.03%), Band 4 (1.36%, 1.39%), Band 5 (1.80%, 1.62%), Band 6 (2.15%, 2.13%), Band 7 (2.93%, 2.81%), and Band 8 (4.65%, 4.18%). Users can adjust the timeframe, moving average type (RMA, SMA, or EMA), length, and colors for the basis line and bands via hex codes (e.g., #FF6D00 for the basis and Band 8) with semi-transparent color.rgb fills. Ideal for identifying support/resistance, overbought/oversold conditions, or trend boundaries on a 5-minute chart.

External Signals Strategy Tester v5External Signals Strategy Tester v5 – User Guide (English)
1. Purpose
This Pine Script strategy is a universal back‑tester that lets you plug in any external buy/sell series (for example, another indicator, webhook feed, or higher‑time‑frame condition) and evaluate a rich set of money‑management rules around it – with a single click on/off workflow for every module.
2. Core Workflow
Feed signals
Buy Signal / Sell Signal inputs accept any series (price, boolean, output of request.security(), etc.).
A crossover above 0 is treated as “signal fired”.
Date filter
Start Date / End Date restricts the test window so you can exclude unwanted history.
Trade engine
Optional Long / Short enable toggles.
Choose whether opposite signals simply close the trade or reverse it (flip direction in one transaction).
Risk modules – all opt‑in via check‑boxes
Classic % block – fixed % Take‑Profit / Stop‑Loss / Break‑Even.
Fibonacci Bollinger Bands (FBB) module
Draws dynamic VWMA/HMA/SMA/EMA/DEMA/TEMA mid‑line with ATR‑scaled Fibonacci envelopes.
Every line can be used for stops, trailing, or multi‑target exits.
Separate LONG and SHORT sub‑modules
Each has its own SL plus three Take‑Profits (TP1‑TP3).
Per TP you set line, position‑percentage to close, and an optional trailing flag.
Executed TP/SLs deactivate themselves so they cannot refire.
Trailing behaviour
If Trail is checked, the selected line is re‑evaluated once per bar; the order is amended via strategy.exit().
3. Inputs Overview
Group Parameter Notes
Trade Settings Enable Long / Enable Short Master switches
Close on Opposite / Reverse Position How to react to a counter‑signal
Risk % Use TP / SL / BE + their % Traditional fixed‑distance management
Fibo Bands FIBO LEVELS ENABLE + visual style/length Turn indicator overlay on/off
FBB LONG SL / TP1‑TP3 Enable, Line, %, Trail Rules applied only while a long is open
FBB SHORT SL / TP1‑TP3 Enable, Line, %, Trail Rules applied only while a short is open
Line choices: Basis, 0.236, 0.382, 0.5, 0.618, 0.764, 1.0 – long rules use lower bands, short rules use upper bands automatically.
4. Algorithm Details
Position open
On the very first bar after entry, the script checks the direction and activates the corresponding LONG or SHORT module, deactivating the other.
Order management loop (every bar)
FBB Stop‑Loss: placed/updated at chosen band; if trailing, follows the new value.
TP1‑TP3: each active target updates its limit price to the selected band (or holds static if trailing is off).
The classic % block runs in parallel; its exits have priority because they call strategy.close_all().
Exit handling
When any strategy.exit() fires, the script reads exit_id and flips the *_Active flag so that order will not be recreated.
A Stop‑Loss (SL) also disables all remaining TPs for that leg.
5. Typical Use Cases
Scenario Suggested Setup
Scalping longs into VWAP‐reversion Enable LONG TP1 @ 0.382 (30 %), TP2 @ 0.618 (40 %), SL @ 0.236 + trailing
Fade shorts during news spikes Enable SHORT SL @ 1.0 (no trail) and SHORT TP1,2,3 on consecutive lowers with small size‑outs
Classic trend‑follow Use only classic % TP/SL block and disable FBB modules
6. Hints & Tips
Signal quality matters – this script manages exits, it does not generate entries.
Keep TV time zone in mind when picking start/end dates.
For portfolio‑style testing allocate smaller default_qty_value than 100 % or use strategy.percent_of_equity sizing.
You can combine FBB exits with fixed‑% ones for layered management.
7. Limitations / Safety
No pyramiding; the script holds max one position at a time.
All calculations are bar‑close; intra‑bar touches may differ from real‑time execution.
The indicator overlay is optional, so you can run visual‑clean tests by unchecking FIBO LEVELS ENABLE.

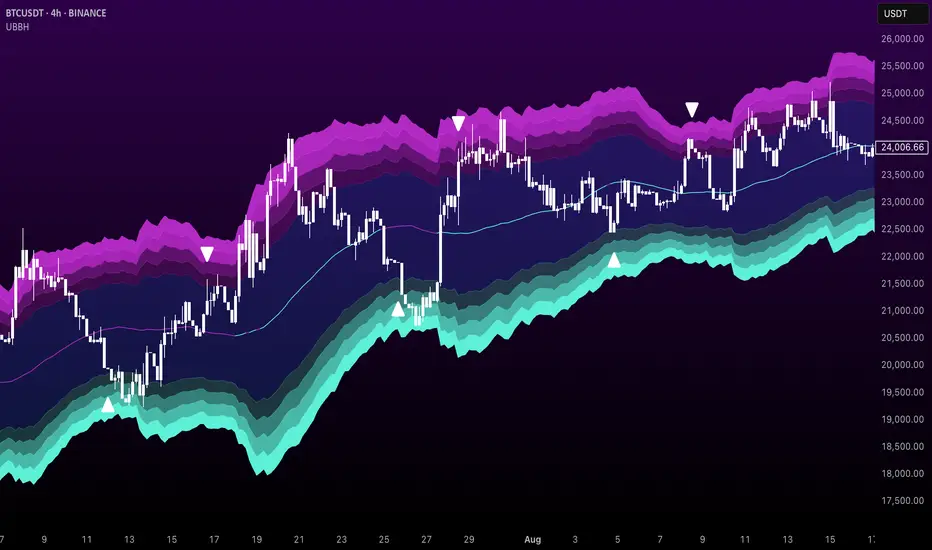
Bollinger Free BarsIdentify Extreme Price Actions with Non-Overlay Visualization
Core Functionality
This indicator detects two types of Bollinger Band breakout patterns without cluttering your chart:
1 ️⃣ Half Breakout Bar (Blue Triangles)
- Triggers when both open & close prices are outside the Bollinger Bands
- Suggests strong directional momentum continuation
2 ️⃣ Complete Breakout Bar (Red Flags)
- Activates when entire price action (including wicks) stays outside the bands
- Signals extreme volatility exhaustion points
Feature Highlights
◾ Smart Band Display
Translucent bands (#2196F3 & #FF9800 with 70% transparency) maintain chart clarity while showing dynamic volatility ranges
◾ Parameter Customization
- Adjustable period (default 20) & deviation multiplier (default 2.0)
- Selectable price source (close/open/high/low)
◾ Statistical Validation
Based on Bollinger Band's 95.4% price containment principle, signals filter out 4.6% extreme market conditions for high-probability scenarios.
Recommended Usage
1. Combine with volume analysis (significant breakout with high volume increases signal reliability)
2. Confirm with trend lines or RSI divergence
3. Adjust transparency via "Style" tab for multi-indicator layouts
Code Safety
- No repainting: All calculations use historical price data only
- No external network requests
- Open-source logic compliant with Pine Script v6 standards
Disclaimer
This tool is for technical analysis education only. Past performance doesn't guarantee future results. Always validate signals with fundamental analysis and proper risk management.

Keltner Channel StrategyOverview
The Keltner Channel Strategy is a powerful trend-following and mean-reversion system that leverages the Keltner Channels, EMA crossovers, and ATR-based stop-losses to optimize trade entries and exits. This strategy has proven to be highly effective, particularly when applied to Gold (XAUUSD) and other commodities with strong trend characteristics.
📈 How It Works
This strategy incorporates two trading approaches: 1️⃣ Keltner Channel Reversal Trades – Identifies overbought and oversold conditions when price touches the outer bands.
2️⃣ Trend Following Trades – Uses the 9 EMA & 21 EMA crossover, with confirmation from the 50 EMA, to enter trades in the direction of the trend.
🔍 Entry & Exit Criteria
📊 Keltner Channel Entries (Reversal Strategy)
✅ Long Entry: When the price crosses below the lower Keltner Band (potential reversal).
✅ Short Entry: When the price crosses above the upper Keltner Band (potential reversal).
⏳ Exit Conditions:
Long positions close when price crosses back above the mid-band (EMA-based).
Short positions close when price crosses back below the mid-band (EMA-based).
📈 Trend Following Entries (Momentum Strategy)
✅ Long Entry: When the 9 EMA crosses above the 21 EMA, and price is above the 50 EMA (bullish momentum).
✅ Short Entry: When the 9 EMA crosses below the 21 EMA, and price is below the 50 EMA (bearish momentum).
⏳ Exit Conditions:
Long positions close when the 9 EMA crosses back below the 21 EMA.
Short positions close when the 9 EMA crosses back above the 21 EMA.
📌 Risk Management & Profit Targeting
ATR-based Stop-Losses:
Long trades: Stop set at 1.5x ATR below entry price.
Short trades: Stop set at 1.5x ATR above entry price.
Take-Profit Levels:
Long trades: Profit target 2x ATR above entry price.
Short trades: Profit target 2x ATR below entry price.
🚀 Why Use This Strategy?
✅ Works exceptionally well on Gold (XAUUSD) due to high volatility.
✅ Combines reversal & trend strategies for improved adaptability.
✅ Uses ATR-based risk management for dynamic position sizing.
✅ Fully automated alerts for trade entries and exits.
🔔 Alerts
This script includes automated TradingView alerts for:
🔹 Keltner Band touches (Reversal signals).
🔹 EMA crossovers (Momentum trades).
🔹 Stop-loss & Take-profit activations.
📊 Ideal Markets & Timeframes
Best for: Gold (XAUUSD), NASDAQ (NQ), Crude Oil (CL), and trending assets.
Recommended Timeframes: 15m, 1H, 4H, Daily.
⚡️ How to Use
1️⃣ Add this script to your TradingView chart.
2️⃣ Select a 15m, 1H, or 4H timeframe for optimal results.
3️⃣ Enable alerts to receive trade notifications in real time.
4️⃣ Backtest and tweak ATR settings to fit your trading style.
🚀 Optimize your Gold trading with this Keltner Channel Strategy! Let me know how it performs for you. 💰📊

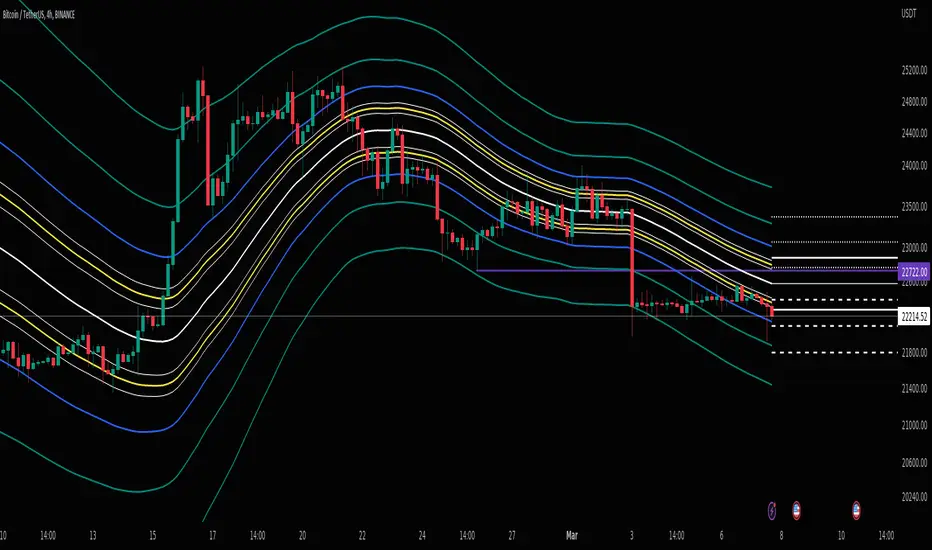
AdvancedLines (FiboBands) - PaSKaL
Overview :
AdvancedLines (FiboBands) - PaSKaL is an advanced technical analysis tool designed to automate the plotting of key Fibonacci retracement levels based on the highest high and lowest low over a customizable period. This indicator helps traders identify critical price zones such as support, resistance, and potential trend reversal or continuation points.
By using AdvancedLines (FiboBands) - PaSKaL , traders can easily spot key areas where the price is likely to reverse or consolidate, or where the trend may continue. It is particularly useful for trend-following, scalping, and range-trading strategies.
Key Features:
Automatic Fibonacci Level Calculation :
- The indicator automatically calculates and plots key Fibonacci levels (0.236, 0.382, 0.5, 0.618, and 0.764), which are crucial for identifying potential support and resistance levels in the market.
Adjustable Parameters :
- Bands Length: You can adjust the bands_length setting to change the number of bars used for calculating the highest high and lowest low. This gives flexibility for using the indicator on different timeframes and trading styles.
- Visibility: The Fibonacci levels, as well as the midline (0.5 Fibonacci level), can be shown or hidden based on your preference.
- Color Customization: You can change the color of each Fibonacci level and background fills to suit your chart preferences.
Fibonacci Levels
- The main Fibonacci levels plotted are:
- 0.236 – Minor support/resistance level
- 0.382 – Moderate retracement level
- 0.5 – Midpoint retracement, often used as a key level
- 0.618 – Golden ratio, considered one of the most important Fibonacci levels
- 0.764 – Strong reversal level, often indicating a continuation or change in trend
Background Fill
- The indicator allows you to fill the background between the Fibonacci levels and the bands with customizable colors. This makes it easier to visually highlight key zones on the chart.
How the Indicator Works:
AdvancedLines (FiboBands) - PaSKaL calculates the range (difference between the highest high and the lowest low) over a user-defined number of bars (e.g., 300). Fibonacci levels are derived from this range, helping traders identify potential price reversal points.
Mathematical Basis :
Fibonacci retracement levels are based on the Fibonacci sequence, where each number is the sum of the previous two (0, 1, 1, 2, 3, 5, 8, 13, etc.). The ratios derived from this sequence (such as 0.618 and 0.382) have been widely observed in nature, market cycles, and price movements. These ratios are used to forecast potential price retracements or continuation points after a major price move.
Fibonacci Levels Calculation :
Identify the Range: The highest high and the lowest low over the defined period are calculated.
Apply Fibonacci Ratios: Fibonacci ratios (0.236, 0.382, 0.5, 0.618, and 0.764) are applied to this range to calculate the corresponding price levels.
Plot the Levels: The indicator automatically plots these levels on your chart.
Customizing Fibonacci Levels & Colors:
The "AdvancedLines (FiboBands) - PaSKaL" indicator offers various customization options for Fibonacci levels, colors, and visibility:
Fibonacci Level Ratios:
- You can customize the Fibonacci level ratios through the following inputs:
- Fibo Level 1: 0.764
- Fibo Level 2: 0.618
- Fibo Level 3: 0.5
- Fibo Level 4: 0.382
- Fibo Level 5: 0.236
- These levels determine key areas where price may reverse or pause. You can adjust these ratios based on your trading preferences.
Fibonacci Level Colors:
- Each Fibonacci level can be assigned a different color to make it more distinguishable on your chart:
- Fibo Level 1 Color (default: Yellow)
- Fibo Level 2 Color (default: Orange)
- Fibo Level 3 Color (default: Green)
- Fibo Level 4 Color (default: Red)
- Fibo Level 5 Color (default: Blue)
- You can change these colors to fit your visual preferences or to align with your existing chart themes.
Visibility of Fibonacci Levels:
- You can choose whether to display each Fibonacci level using the following visibility inputs:
- Show Fibo Level 1 (0.764): Display or hide this level.
- Show Fibo Level 2 (0.618): Display or hide this level.
- Show Fibo Level 3 (0.5): Display or hide this level.
- Show Fibo Level 4 (0.382): Display or hide this level.
- Show Fibo Level 5 (0.236): Display or hide this level.
- This allows you to customize the indicator according to the specific Fibonacci levels that are most relevant to your trading strategy.
Background Fill Color
- The background between the Fibonacci levels and price bands can be filled with customizable colors:
- Fill Color for Upper Band & Fibo Level 1: This color will fill the area between the upper band and Fibonacci Level 1.
- Fill Color for Lower Band & Fibo Level 5: This color will fill the area between the lower band and Fibonacci Level 5.
- Adjusting these colors helps highlight critical zones where price may reverse or consolidate.
How to Use AdvancedLines (FiboBands) - PaSKaL in Trading :
Range Trading :
Range traders typically buy at support and sell at resistance. Fibonacci levels provide excellent support and resistance zones in a ranging market.
Example: If price reaches the 0.618 level in an uptrend, it may reverse, providing an opportunity to sell.
Conversely, if price drops to the 0.382 level, a bounce might occur, and traders can buy, anticipating the market will stay within the range.
Trend-following Trading :
For trend-following traders, Fibonacci levels act as potential entry points during a retracement. After a strong trend, price often retraces to one of the Fibonacci levels before continuing in the direction of the trend.
Example: In a bullish trend, when price retraces to the 0.382 level, it could be a signal to buy, as the price might resume its upward movement after the correction.
In a bearish trend, retracements to levels like 0.618 or 0.764 could provide optimal opportunities for shorting as the price resumes its downward movement.
Scalping :
Scalpers focus on short-term price movements. Fibonacci levels can help identify precise entry and exit points for quick trades.
Example: If price is fluctuating in a narrow range, a scalper can enter a buy trade at 0.236 and exit at the next Fibonacci level, such as 0.382 or 0.5, capturing small but consistent profits.
Stop-Loss and Take-Profit Levels :
Fibonacci levels can also help in setting stop-loss and take-profit levels.
Example: In a bullish trend, you can set a stop-loss just below the 0.236 level and a take-profit at 0.618.
In a bearish trend, set the stop-loss just above the 0.382 level and the take-profit at 0.764.
Identifying Reversals and Continuations :
Reversals: When price reaches a Fibonacci level and reverses direction, it may indicate the end of a price move.
Trend Continuation: If price bounces off a Fibonacci level and continues in the same direction, this may signal that the trend is still intact.
Conclusion :
AdvancedLines (FiboBands) - PaSKaL is an essential tool for any trader who uses Fibonacci retracements in their trading strategy. By automatically plotting key Fibonacci levels, this indicator helps traders quickly identify support and resistance zones, forecast potential reversals, and make more informed trading decisions.
For Trend-following Traders: Use Fibonacci levels to find optimal entry points after a price retracement.
For Range Traders: Identify key levels where price is likely to reverse or bounce within a range.
For Scalpers: Pinpoint small price movements and take advantage of quick profits by entering and exiting trades at precise Fibonacci levels.
By incorporating AdvancedLines (FiboBands) - PaSKaL into your trading setup, you will gain a deeper understanding of price action, improve your decision-making process, and enhance your overall trading performance.

EMA Volatility Channel [QuantAlgo]EMA Volatility Channel 🌊📈
The EMA Volatility Channel by QuantAlgo is an advanced technical indicator designed to capture price volatility and trend dynamics through adaptive channels based on exponential moving averages. This sophisticated system combines EMA-based trend analysis with dynamic volatility-adjusted bands to help traders and investors identify trend direction, potential reversals, and market volatility conditions. By evaluating both price momentum and volatility together, this tool enables users to make informed trading decisions while adapting to changing market conditions.
💫 Dynamic Channel Architecture
The EMA Volatility Channel provides a unique framework for assessing market trends through a blend of exponential moving averages and volatility-based channel calculations. Unlike traditional channel indicators that use fixed-width bands, this system incorporates dynamic volatility measurements to adjust channel width automatically, helping users determine whether price movements are significant relative to current market conditions. By combining smooth EMA trends with adaptive volatility bands, it evaluates both directional movement and market volatility, while the smoothing parameters ensure stable yet responsive channel adjustments. This adaptive approach allows users to identify trending conditions while remaining aware of volatility expansions and contractions, enhancing both trend-following and reversal strategies.
📊 Indicator Components & Mechanics
The EMA Volatility Channel is composed of several technical components that create a dynamic channel system:
EMA Midline: Calculates a smoothed exponential moving average that serves as the channel's centerline, providing a clear reference for trend direction.
Volatility Measurement: Computes average price movement to determine dynamic channel width, adapting to changing market conditions automatically.
Smooth Band Calculation: Applies additional smoothing to the channel bands, reducing noise while maintaining responsiveness to significant price movements.
📈 Key Indicators and Features
The EMA Volatility Channel combines various technical tools to deliver a comprehensive analysis of market conditions.
The indicator utilizes exponential moving averages with customizable length and smoothing parameters to adapt to different trading styles. Volatility calculations are applied to determine channel width, providing context-aware boundaries for price movement. The trend detection component evaluates price action relative to the channel bands, helping validate trends and identify potential reversals.
The indicator incorporates multi-layered visualization with color-coded channels and bars to signal both trend direction and market position. These adaptive visual cues, combined with programmable alerts for channel breakouts, help traders and investors track both trend changes and volatility conditions, supporting both trend-following and mean-reversion strategies.
⚡️ Practical Applications and Examples
✅ Add the Indicator: Add the indicator to your TradingView chart by clicking on the star icon to add it to your favorites ⭐️
👀 Monitor Channel Position: Watch the price position relative to the channel bands to identify trend direction and potential reversals. When price moves outside the channel, consider potential trend changes or extreme conditions.
🔔 Set Alerts: Configure alerts for channel breakouts and trend changes, ensuring you can act on significant technical developments promptly.
🌟 Summary and Tips
The EMA Volatility Channel by QuantAlgo is a versatile technical tool, designed to support both trend following and volatility analysis across different market environments. By combining smooth EMA trends with dynamic volatility-based channels, it helps traders and investors identify significant price movements while measuring market volatility, providing reliable technical signals. The tool's adaptability across timeframes makes it suitable for both trend-following and reversal strategies, allowing users to capture opportunities while maintaining awareness of changing market conditions.

The Ultimate ATR-BBW Market Volatility Indicator"The ATR-BBW Market Volatility Indicator combines the Average True Range (ATR) and Bollinger Bands Width (BBW) to provide a measure of market volatility. This indicator does not indicate bullish or bearish trends, but rather the magnitude of price fluctuations.
* Usage: When the indicator moves upward, it suggests increasing market volatility, indicating that prices are moving within a wider range. Conversely, a downward movement implies decreasing volatility, signifying that prices are moving within a narrower range.
* Note: This sub-indicator solely reflects market volatility and does not provide buy or sell signals.
Investing involves risk. Please conduct thorough research before making any investment decisions.
ATR and BBW Explained:
* Average True Range (ATR): ATR is a technical analysis indicator used to measure market volatility. It calculates the average of a series of true ranges, where the true range is the greatest of the following:
* The current high minus the current low
* The absolute value of the current high minus the previous close
* The absolute value of the current low minus the previous close
* A higher ATR value indicates higher volatility, while a lower value suggests lower volatility.
* Bollinger Bands Width (BBW): Bollinger Bands are plotted two standard deviations above and below a simple moving average. BBW measures the distance between the upper and lower bands. A wider BBW indicates higher volatility, as prices are moving further away from the moving average. Conversely, a narrower BBW suggests lower volatility.
Combining ATR and BBW:
By combining ATR and BBW, the ATR-BBW indicator provides a more comprehensive view of market volatility. ATR captures the overall volatility of the market, while BBW measures the volatility relative to the moving average. Together, they provide a more robust indicator of market conditions and can be used to identify potential trading opportunities.
Why ATR and BBW are Effective for Measuring Volatility:
* ATR directly measures the actual price movement, regardless of the direction.
* BBW shows how much prices are deviating from their average, indicating the strength of the current trend.
* Combined: By combining these two measures, the ATR-BBW indicator provides a more comprehensive and accurate assessment of market volatility.
In essence, the ATR-BBW indicator helps traders understand the magnitude of price fluctuations, allowing them to make more informed trading decisions.

TP RSITP RSI - Integrated Trend, Momentum, and Volatility Analyzer
The TP RSI indicator is an innovative 3-in-1 technical analysis tool that combines RSI, Bollinger Bands, and an EMA ribbon to provide traders with a comprehensive view of trend, momentum, and volatility in a single, easy-to-interpret visual display.
Why This Combination? This mashup addresses three critical aspects of market analysis simultaneously:
Trend identification and strength (EMA ribbon)
Momentum measurement (RSI)
Volatility assessment (Bollinger Bands)
By integrating these components, traders can make more informed decisions based on multiple factors without switching between different indicators.
How Components Work Together:
1. EMA Ribbon (Trend):
10 EMAs form 5 color-coded bands
Blue: Uptrend, Red: Downtrend
Provides a nuanced view of trend strength and potential reversals
2. RSI (Momentum):
Color-coded for quick interpretation
Blue: Upward momentum, Red: Downward momentum, White: Neutral
Position relative to the ribbon offers additional insight
3. Bollinger Bands (Volatility):
Applied to RSI for dynamic overbought/oversold levels
Narrow bands indicate low volatility, suggesting potential breakouts
Unique Aspects and Originality:
Synergistic visual cues: Color coordination between ribbon and RSI
Multi-factor confirmation: Requires alignment of trend, momentum, and volatility for strong signals
Volatility-adjusted momentum: RSI interpreted within the context of Bollinger Bands
How these components work together:
Buy Signal: Blue ribbon with blue RSI outside the ribbon.
Sell Signal: Red ribbon with red RSI outside the ribbon.
Neutral: White RSI or RSI inside the ribbon (not recommended for trading)
Increasing Momentum: RSI crossing above upper Bollinger Band (upward) or below lower Band (downward).
Trend Strength: RSI rejection by the ribbon, while all bands are colored along with the trend direction, identifies a strong trend.

HTF Dynamic EMA Smoothing Indicator [CHE] with Kernel SelectionThe Dynamic EMA Smoothing Indicator with Kernel Selection is a powerful Pine Script indicator for TradingView designed to smooth moving averages and identify market trends more clearly. Here is a detailed description of its functionalities and settings:
Main Functions:
1. Time Period Display:
- Option to show or hide an info box displaying the current time period.
- Customizable info box: Users can adjust the size, position, and colors of the info box to suit their preferences.
2. Timeframe Type Selection:
- Auto Timeframe: Automatically calculates the best timeframe based on the current resolution.
- Multiplier: Allows using an alternate timeframe as a multiple of the current resolution.
- Manual Resolution: Users can manually set a specific timeframe.
3. Colors:
- Custom colors for various graphical elements, including EMA lines and signals.
4. Basic Settings:
- EMA and Signal Periods: Defines the periods for the exponential moving averages (EMA) and signal lines.
- Smoothing Length and Kernel Type: Allows selecting the smoothing length and the type of kernel used for weighting the EMAs.
- ATR Multiplier: Defines the multiplier for the ATR (Average True Range) to identify relevant price ranges.
5. EMA Calculations:
- The indicator calculates a weighted EMA using several methods like Linear, Exponential, Epanechnikov, Triangular, and Cosine kernels.
- Smoothing is achieved by adding and removing values in a float array that stores the EMA values.
6. Plotting EMA and Signal Lines:
- The indicator plots the smoothed EMA and signal lines on the chart. The line colors change according to the trend direction (green for uptrend, red for downtrend).
7. Trading Signals:
- Long Signals: An upward arrow is displayed when the smoothed EMA indicates an uptrend.
- Short Signals: A downward arrow is displayed when the smoothed EMA indicates a downtrend.
- Alert Conditions: Alerts are triggered when long or short signals are detected.
8. ATR Bands:
- The indicator shows upper and lower ATR bands to identify potential support and resistance zones.
9. Time Period Display on Chart:
- A table is used to display the selected time period on the chart when the corresponding option is enabled.
This indicator offers extensive customization and allows traders to conduct complex market analyses using smoothed EMAs and custom timeframes. The integration of various kernels for smoothing makes it a versatile tool adaptable to different trading strategies.

CME Gap Oscillator [CryptoSea]Introducing the CME Gap Oscillator , a pioneering tool designed to illuminate the significance of market gaps through the lens of the Chicago Mercantile Exchange (CME). By leveraging gap sizes in relation to the Average True Range (ATR), this indicator offers a unique perspective on market dynamics, particularly around the critical weekly close periods.
Key Features
Gap Measurement : At its core, the CME Oscillator quantifies the size of weekend gaps in the context of the market's volatility, using the ATR to standardize this measurement.
Dynamic Levels : Incorporating a dynamic extreme level calculation, the tool adapts to current market conditions, providing real-time insights into significant gap sizes and their implications.
Band Analysis : Through the introduction of upper and lower bands, based on standard deviations, traders can visually assess the oscillator's position relative to typical market ranges.
Enhanced Insights : A built-in table tracks the frequency of the oscillator's breaches beyond these bands within the latest CME week, offering a snapshot of recent market extremities.
Settings & Customisation
ATR-Based Measurement : Choose to measure gap sizes directly or in terms of ATR for a volatility-adjusted view.
Band Period Adjustability : Tailor the oscillator's sensitivity by modifying the band calculation period.
Dynamic Level Multipliers : Adjust the multiplier for dynamic levels to suit your analysis needs.
Visual Preferences : Customise the oscillator, bands, and table visuals, including color schemes and line styles.
In the example below, it demonstrates that the CME will want to return to the 0 value, this would be considered a reset or gap fill.
Application & Strategy
Deploy the CME Oscillator to enhance your market analysis
Market Sentiment : Gauge weekend market sentiment shifts through gap analysis, refining your strategy for the week ahead.
Volatility Insights : Use the oscillator's ATR-based measurements to understand the volatility context of gaps, aiding in risk management.
Trend Identification : Identify potential trend continuations or reversals based on the frequency and magnitude of gaps exceeding dynamic levels.
The CME Oscillator stands out as a strategic tool for traders focusing on gap analysis and volatility assessment. By offering a detailed breakdown of market gaps in relation to volatility, it empowers users with actionable insights, enabling more informed trading decisions across a range of markets and timeframes.

Uptrick: Bullish/Bearish Highlight -DEMO 1 Indicator Purpose:
• The indicator serves as a technical analysis tool for traders to identify potential bullish
and bearish trends in the market.
• It highlights periods where the closing price is above or below a 50-period simple
moving average (SMA), indicating potential bullish or bearish sentiment, respectively.
2 Moving Averages:
• The indicator calculates a 50-period SMA (sma50) to smooth out price fluctuations
and identify the overall trend direction.
• It also computes an 8-period exponential moving average (EMA), which responds
more quickly to recent price changes compared to the SMA.
3 Bollinger Bands:
• Bollinger Bands are plotted around the SMA, indicating volatility in the price
movement.
• The bands are typically set at two standard deviations above and below the SMA,
representing approximately 95% of the price data within that range.
4 Bullish and Bearish Conditions:
• The indicator defines conditions for identifying bullish and bearish market sentiments.
• When the closing price is above the SMA50, it indicates a bullish condition, and when
it's below, it suggests a bearish condition.
5 Plotting:
• The indicator visualizes the bullish and bearish conditions by changing the
background color accordingly.
• It also plots the SMA50, EMA, and Bollinger Bands to provide a graphical
representation of the market dynamics.
6 User Interface:
• The indicator is designed to be used as an overlay on price charts, allowing traders to
easily incorporate it into their analysis.
Overall, the "Uptrick: Bullish/Bearish Highlight" indicator offers traders a comprehensive view of market trends and potential reversal points, helping them make informed trading decisions.
TIP: When the white line, which is the EMA , crosses above the SMA (the orange line), it is usually a good idea to buy, but when the EMA crosses below the SMA it is a good idea to sell.
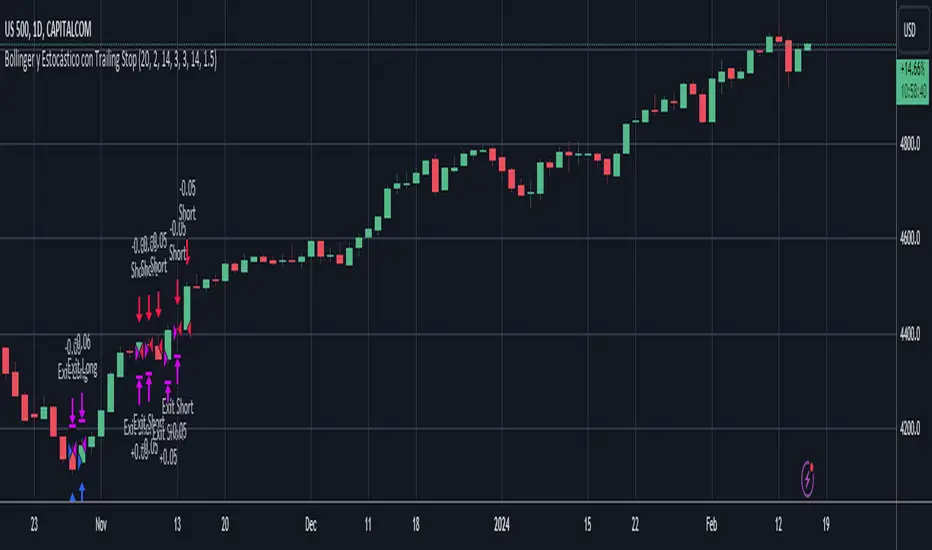
Bollinger and Stochastic with Trailing Stop - D.M.P.This trading strategy combines Bollinger Bands and the Stochastic indicator to identify entry opportunities in oversold and overbought conditions in the market. The aim is to capitalize on price rebounds from the extremes defined by the Bollinger Bands, with the confirmation of the Stochastic to maximize the probability of success of the operations.
Indicators Used
- Bollinger Bands Used to measure volatility and define oversold and overbought levels. When the price touches or breaks through the lower band, it indicates a possible oversold condition. Similarly, when it touches or breaks through the upper band, it indicates a possible overbought condition.
- Stochastic: A momentum oscillator that compares the closing price of an asset with its price range over a certain period. Values below 20 indicate oversold, while values above 80 indicate overbought.
Strategy Logic
- Long Entry (Buy): A purchase operation is executed when the price closes below the lower Bollinger band (indicating oversold) and the Stochastic is also in the oversold zone.
- Short Entry (Sell): A sell operation is executed when the price closes above the upper Bollinger band (indicating overbought) and the Stochastic is in the overbought zone.
Squeeze Momentum TD - A Revisited Version of the TTM SqueezeDescription:
The "Squeeze Momentum TD" is our unique take on the highly acclaimed TTM Squeeze indicator, renowned in the trading community for its efficiency in pinpointing market momentum. This script is a tribute and an extension to the foundational work laid by several pivotal figures in the trading industry:
• John Carter, for his creation of the TTM Squeeze and TTM Squeeze Pro, which revolutionized the way traders interpret volatility and momentum.
• Lazybear, whose original interpretation of the TTM Squeeze, known as the "Squeeze Momentum Indicator", provided an invaluable foundation for further development.
• Makit0, who evolved Lazybear's script to incorporate enhancements from the TTM Squeeze Pro, resulting in the "Squeeze PRO Arrows".
Our script, "Squeeze Momentum TD", represents a custom version developed after reviewing all variations of the TTM Squeeze indicator. This iteration focuses on a distinct visualization approach, featuring an overlay band on the chart for an user-friendly experience. We've distilled the essence of the TTM Squeeze and its advanced version, the TTM Squeeze Pro, into a form that emphasizes intuitive usability while retaining comprehensive analytical depth.
Features:
-Customizable Bollinger Bands and Keltner Channels: These core components of the TTM Squeeze.
-Dynamic Squeeze Conditions: Ranging from No Squeeze to High Compression.
-Momentum Oscillator: A linear regression-based momentum calculation, offering clear insights into market trends.
-User-Defined Color Schemes: Personalize your experience with adjustable colors for bands and plot shapes.
-Advanced Alert System: Alerts for key market shifts like Bull Watch Out, Bear Watch Out, and Momentum shifts.
-Adaptive Band Widths: Modify the band widths to suit your preference.
How to use it?
• Transition from Light Green to Dark Green: Indicates a potential end to the bullish momentum. This 'Bull Watch Out' signal suggests that traders should be cautious about continuing bullish trends.
• Transition from Light Red to Dark Red: Signals that the bearish momentum might be fading, triggering a 'Bear Watch Out' alert. It's a hint for traders to be wary of ongoing bearish trends.
• Shift from Dark Green to Light Green: This change suggests an increase in bullish momentum. It's an indicator for traders to consider bullish positions.
• Change from Dark Red to Light Red: Implies that bearish momentum is picking up. Traders might want to explore bearish strategies under this condition.
• Rapid Change from Light Red to Light Green: This swift shift indicates a quick transition from bearish to bullish sentiment. It's a strong signal for traders to consider switching to bullish positions.
• Quick Shift from Light Green to Light Red: Demonstrates a speedy change from bullish to bearish momentum. It suggests that traders might want to adjust their strategies to align with the emerging bearish trend.
Acknowledgements:
Special thanks to Beardy_Fred for the significant contributions to the development of this script. This work stands as a testament to the collaborative spirit of the trading community, continuously evolving to meet the demands of diverse trading strategies.
Disclaimer:
This script is provided for educational and informational purposes only. Users should conduct their own due diligence before making any trading decisions.

Bitcoin to GOLD [presentTrading]**Introduction and How it is Different**
Unlike traditional indicators, the BTGR offers a unique perspective on market sentiment and asset valuation by juxtaposing two seemingly disparate assets: Bitcoin, the digital gold, and Gold, the traditional store of value. This article introduces an advanced version of this ratio, complete with upper and lower bands calculated using standard deviations. These bands add an extra layer of analytical depth, allowing for more nuanced trading strategies.
BTCUSD 12h bigger picture
**Economic Principles**
The BTGR is rooted in the economic principles of asset valuation and market sentiment. Gold has long been considered a safe haven asset, a place where investors park their money during times of economic uncertainty. Bitcoin, on the other hand, is often viewed as a high-risk, high-reward investment. By comparing the two, the BTGR provides insights into the broader market sentiment.
- Risk Appetite: A high BTGR indicates a bullish sentiment towards riskier assets like Bitcoin.
- Market Uncertainty: A low BTGR suggests a bearish sentiment and a flight to the safety of Gold.
- Asset Diversification: The BTGR can be used as a tool for portfolio diversification, helping investors balance risk and reward.
**How to Use It**
Setting Up the Indicator
- Platform: The indicator is designed for use on TradingView.
- Time Frame: A 480-minute time frame is recommended for more accurate signals.
- Parameters: The moving average is set at 200 periods, and the standard deviation is calculated over the same period.
**Trading Signal**
Long Entry: Consider going long when the BTGR crosses above the upper band.
Short Entry: Consider going short when the BTGR crosses below the lower band.
Note: Due to the issue that the number of trading is less than about 100 times, the corresponding strategy is not allowed to publish.

ATR + Momentum Shifts w/Take ProfitThis script is a technical analysis indicator designed to assist in identifying potential entry points and setting take profit levels in trading. It combines the Average True Range (ATR) indicator, momentum shifts, and customizable take profit levels to provide insights into potential market movements.
Differences from Currently Published Ones:
This script is unique due to its use of a combination of elements:
ATR and Momentum: The script combines the ATR indicator to provide dynamic support and resistance levels with the momentum indicator to identify shifts in the underlying momentum.
Customizable Take Profit Levels: It offers the ability to set take profit levels based on customizable multipliers of the ATR, helping traders manage potential profits.
How to Use:
ATR Bands: The script plots upper and lower ATR bands as potential dynamic support and resistance levels.
Shift Arrows: Arrows are plotted below bars for potential long entry opportunities (green triangle) and above bars for potential short entry opportunities (yellow triangle).
Take Profit Levels: The script also plots take profit levels both above and below the source price based on the ATR multipliers set in the inputs.
Markets and Conditions:
This script can be used across various financial markets, including stocks, forex, commodities, and cryptocurrencies. It's most effective in trending markets where momentum shifts can signal potential reversals or continuation of trends. Traders should consider the following conditions:
Trend Confirmation: Look for momentum shifts in the direction of the prevailing trend for higher probability setups.
Volatility: Higher volatility can amplify ATR movements and subsequently affect the placement of ATR bands and take profit levels.
Risk Management: Always implement proper risk management strategies to protect your capital.
Additional Considerations:
Customization: Traders can adjust input parameters like ATR length, momentum length, and take profit multipliers to match their trading style and market conditions.
Combining with Other Indicators: Consider using this indicator in conjunction with other technical indicators or chart patterns for confirmation.

VOLD Ratio (Volume Difference Ratio) by TenozenAnother helpful indicator is here! VOLD Ratio is calculated by the net volume of a buying candle, divided by the net volume of a sell candle.
Formula:
buying net volume/selling net volume
It's a simple indicator, but don't underestimate this simplicity. It's a powerful indicator that would help you to decide whether the volume is getting interested in the direction that the market would take. So assume when the market is above the Bollinger Bands, it means that the volume is at a buying extreme, by that, we could expect the market to get back towards the mean, as there is a lot of buying demand that entered the market. How about below the Bollinger Bands? it means that the volume is at a selling extreme, we could expect that there is a lot of volume getting in toward the sellers, so we could take advantage of the opportunity to go for a long. Lastly, the Bollinger Bands would help you guys to determine the liquidity of the market, if the Bollinger Bands get smaller over time, it means there is no interest for the market to enter yet, and if the Bollinger Bands get bigger over time, it means there is interest for the market to enter in the session.
Tips & Reminder:
- We shouldn't use this indicator by itself, make sure to use an Indicator that would help you guys to determine the momentum and the liquidity of the market.
- The higher the timeframe, the slower this indicator would signal an entry, by that use a smaller timeframe... I suggest using a 15M chart for the execution.
- Always trade in the medium-longterm direction if you want to have a high probability trade.
- Be patient in your execution, it's more likely the market would go higher or lower after going in the extreme of the Bollinger Bands.
Well, that's it! Hope you guys enjoy using this indicator, let me know if there is any question or suggestion. Ciao...

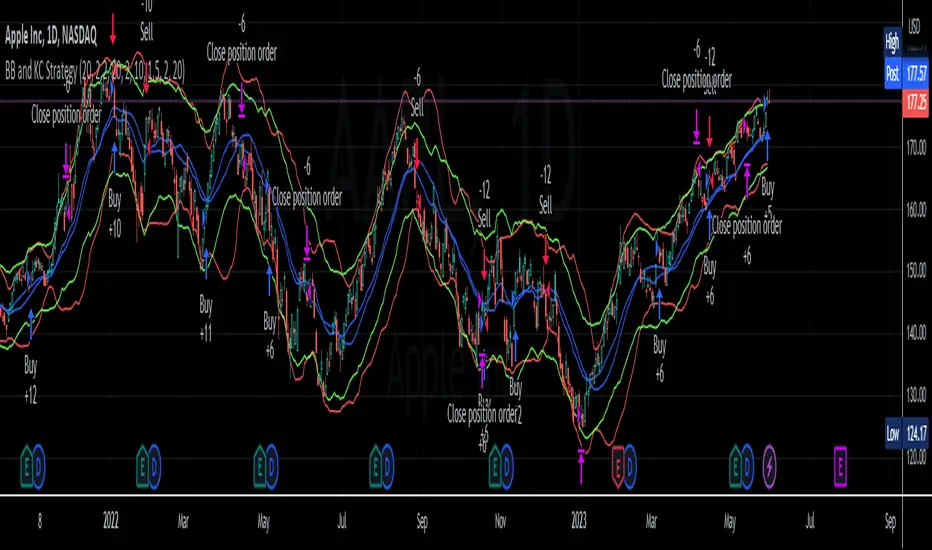
BB and KC StrategyThis script is designed as a TradingView strategy that uses Bollinger Bands (BB) and Keltner Channels (KC) as the primary indicators for generating trade signals. It aims to catch potential market trends by comparing the movements of these two popular volatility measures.
Key aspects of this strategy:
1. **Bollinger Bands and Keltner Channels:** Both are volatility-based indicators. The Bollinger Bands consist of a middle band (simple moving average) and two outer bands calculated based on standard deviation, which adjusts itself to market conditions. Keltner Channels are a set of bands placed above and below an exponential moving average of the price. The distance between the bands is calculated based on the Average True Range (ATR), a measure of price volatility.
2. **Entry Signals:** The strategy enters a long position when the upper KC line crosses above the upper BB line and the volume is above its moving average. Conversely, it enters a short position when the lower KC line crosses below the lower BB line and the volume is above its moving average.
3. **Exit Signals:** The strategy exits a position under two conditions. First, if the trade has been open for a certain number of bars defined by the user (default 20 bars). Second, a stop loss and trailing stop are in place to limit potential losses and lock in profits as the price moves favorably. The stop loss is set at a percentage of the entry price (default 1.5% for long and -1.5% for short), and the trailing stop is also a percentage of the entry price (default 2%).
4. **Trade Quantity:** The script allows specifying the investment amount for each trade, set to a default of 1000 currency units.
Remember, this is a strategy script, which means it is used for backtesting and not for real-time signals or live trading. It is also recommended that it is used as a tool to aid your trading, not as a standalone system. As with any strategy, it should be tested over different market conditions and used in conjunction with other aspects of technical and fundamental analysis to ensure robustness and effectiveness.
Ultimate Trend ChannelThe "Ultimate Trend Channel" indicator is a comprehensive trend analysis tool that calculates and displays a series of upper and lower bands based on user-defined input lengths. It uses linear regression and standard deviation to determine these bands for each of the 21 different group lengths. The indicator then computes the averages of these upper and lower bands, as well as the average of all the bands combined.
The visualization on the chart includes the plotting of the average upper and lower bands, with the space between these bands shaded for easy visualization of the overall trend. Additionally, the average of all the bands, referred to as the "Ultimate Trend Line," is also plotted on the chart.
This indicator provides a robust way of assessing market trends and volatility over varying periods, which can be extremely useful for both short-term and long-term trading strategies.

BB Mod + ForecastThis is a combination of two previous indicators; ALMA stdev band with fibs and Vector MACD.
Bollinger Band Mod fits the standard deviation on both sides of the center moving average ( ALMA +/- stdev / 2 ) and calculates Fibonacci ratios from stdev on both sides.
It is more averaging and more responsive at the same time compared to Bollinger Band.
Forecast is calculated from difference between origin ma ( ALMA from hl2 ) and six different period Hull moving averages averaged together and added to the center ma on both sides.
Fibonacci levels for 0.618 1.618 and 2.618 are added.
The dashed lines point towards the trend. Gives you a better idea of the current trend and momentum in the band.
Smart QQE ModSmart QQE - Chart Overlay
Smart QQE shows QQE Trend and RSI plot on chart to determine the trend direction and eliminate false signals.
QQE is obtained from original code by Glaz and rescaled to fit on chart. RSI 50 level acts as Zero which is plotted as a Bollinger on chart.
This is not a Bollinger band . its an RSI channel with levels 0-100 plotted around the mid band. The RSI Mid Band is calculated based on RSI value.
Trend:
Price above RSI Mid band is uptrend
Price below RSI Mid band is Down Trend
The Green line - Discount Zone - 0-RSI level - Oversold Zone
The Red Line - Premium Zone - 100 - RSI level - Overbought Zone
Buy / Sell signals
QQE Buy and Sell signals are plotted based on crossovers of RSI and Fast RSI crossovers.
QQE trend is colored based on the crossover.
Candle color:
candle color determines the Original QQE Trend.
Blue - QQE line above Threshold level in Buy Zone
Pink - QQE line below Threshold level in Sell Zone
Entries are to be made with proper confirmation.
HULL MA is provided as a MA Ribbon for additional confirmation. This MA can be changed to various forms Like EMA , SMA , WMA , HMA , RMA the open and close of the MA are plotted so it determines the exact Trend reversal of the price.
Credits to @Glaz QQE Threshold

TCG AI ToolsIntroduction:
This script is a result of an AI recommended created trading strategy that is design to offer new traders’ easy access to trend information and oversold/overbought conditions. Here we have combined commonly used indicators into a single unique visualization that quickly identifies trend changes and both RSI and Bollinger Band based overbought and oversold conditions, and allows all three indicators to be used simultaneously while taking up limited space on the chart.
The value in combining these three indicators is found in the harmony and clarity they are able to provide new traders. Trend changes can be difficult to identify based solely on candlestick analysis, therefore using the moving averages allows the trader to simplify the process of establishing bullish or bearish trends. Once a trend is established it can be very attractive for new traders to establish entries at the wrong time. For this reason, it is useful to include two different overbought and oversold indicators. The Bollinger Bands are included as one of the methods for establishing extreme prices that often result in reversals, and the relative strength index is similarly utilized as a second means to warn traders of extreme conditions.
Using the Indicator
1. MA10 MA20 Trend Indicator
The large red/green horizontal bar located at the 0 line on the X axis is the trend direction indicator. This visualization compares the 10 and 20 period moving averages to establish trend. When the MA10 is above the MA20 the trend is considered bullish and supportive of long positions and indicates such by changing the color of the horizontal bar to green. When the MA10 is below MA20 the trend is considered bearish and indicates such by changing the color of the horizontal bar to red. Color changes occur at the moment of a MA crossover/under.
2. Relative Strength Index.
The vertical red and green bars that make up the background of the panel indicate conditions wherein the RSI is considered overbought or oversold. When the vertical bar is red it indicates that RSI is below 30 suggesting that current conditions are oversold and supportive of long entries. When the vertical bar is green it suggests that the current conditions are overbought and are supportive of short entries.
3. Bollinger Band Extremes
Within the horizontal red/green bar there are red and green arrows. These arrows represent periods where the price is exceeding the upper or lower Bollinger bands and indicate overbought/oversold conditions. When a green arrow appears, it indicates that the price has crossed below the lower BB and is supportive of long entries. If a red arrow appears it indicates that the price has crossed above the upper Bollinger band and conditions are supportive of short entries.

LNL Keltner CandlesLNL Keltner Candles
This indicator plots mean reversion (reversal) arrows with custom painted candles based on the price touch or close above or below keltner channel limits (upper & lower bands). This study was created primarily for swing trading & higher time frames such as daily and weekly. Lower time frames might result in more false signals.
Mean Reversal Arrows:
1. Reversal Arrow Up - If the price drops below the lower band extremes, reversal up is the trigger for a bullish mean reversion.
2. Reversal Arrow Down - Once the price reach the higher band extremes, reversal down is the trigger for a bearish mean reversion.
The Concept of Mean Reversion:
There are just two types of moves in any market: The market is either expanding from the mean or retracing back to the mean. These reversions & epxansions are happening across all types of markets. The goal of this study is to catch the powerful mean reversion from extremes back to the mean. Once the candles light up green / red, it is time to look for the reversal (purple) arrow which triggers the mean reversion setup. Mean reversion is not about catching the next big swing turn to new highs or lows. It is all about the base hits = the mean. So the target here is always the average price. The idea here is to catch the average market ebbs & flows, not the next home run.
What Do I Mean by Mean?
Mean is usually the average price from the last 20-30 bars. Basically something like a 20 MA or Keltner Channel or Bollinger Band midline are really good visual representators of the mean (average price).
Hope it helps.
