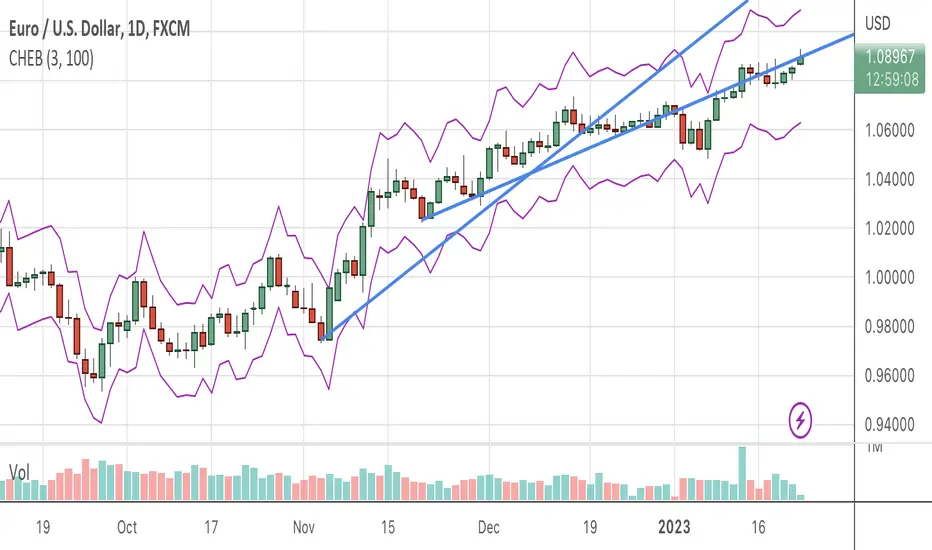
Chebyshevs BandsThis script calculates upper and lower bands using Chebyshev's inequality formula.
The main pros.: the band doesn't depend on particular distribution. It fits to any type of random variables. Also it allows to calculate bands for instruments with extremely high volatility.
Cons.: formula provides a rough estimation in some special cases like lognormal distribution.
Cerca negli script per "bands"
SPX Fair Value Bands V2An updated version of the SPX Fair Value Bands script from dharmatech and based on the net liquidity concept by MaxJAnderson .
Now with full customization of parameters through the settings (Dialog Box) and allowing the options to the use of
1) Standard Bands based on Offsets of the Fair Value
2) Bollinger Bands
3) Keltner Channels
to better capture buy/sell areas rather than relying on noisy unreliably (and unevenly) updated data from the Treasury/Fed.
==================================
Net Liquidity's importance in the new post-COVID QE to QT regime as described MaxJAnderson
----------------
" In past cycles, size of Fed's balance sheet changed a lot, while TGA and RRP changed relatively little. So size of balance sheet roughly equated Net Liquidity.
(The Treasury General Account) TGA and (Reverse Repo) RRP didn't matter. They were rounding errors by comparison.
But starting in 2020, relative changes in TGA and RRP have been THREE TIMES LARGER than the change in size of the Fed's balance sheet. As result, changes in TGA and RRP have taken over as the primary drivers Net Liquidity.
This is new, and changes the game significantly. Again - the size of the Fed's balance sheet doesn't matter.
What matters is the portion of it that's available to circulate in the economy (Net Liquidity).
And ever since 2020, the Treasury and Reverse Repo have become what controls that. Not the size of Fed's balance sheet.
----------------
The idea that follows is simple,short when $SPX reaches extreme levels of overvaluation, and close out when SPX returns to being undervalued. Here's the formulas I currently use to determine fair value:
Fair Value = (Fed Bal Sheet - TGA - RRP)/1.1 - 1625
And here's the trading rules I currently follow:
Short when diff of $SPX - Fair Value > 350
Close when diff of $SPX - Fair Value < 150
When one of these rules is triggered upon market close on a given day, trades are entered at open of the following day "

Trend BandsThis script is, yet again, another mean reversion indicator. When the trend index touches the upper / lower bands, there seems to be a decent probability that the market might reverse at that area. However, I do emphasise on exercising caution when trading against the current wave of the market as there are instances where the trend index extends past the upper / lower bands for a prolonged period of time. However, in a non-trending semi-consolidated market, this script seems to do quite well for itself. Enjoy!

ATR Trend Bands [Misu]█ This indicator shows an upper and lower band based on price action and ATR (Average True Range)
The average true range (ATR) is a market volatility indicator used in technical analysis.
█ Usages:
The purpose of this indicator is to identify changes in trends and price action.
It is mainly used to identify breaking points and trend reversals.
But it can also be used to show resistance or support levels.
█ Features:
> Buy & Sell Alerts
> Buy & Sell Labels
> Color Bars
> Show Bands
█ Parameters:
Length: Length is used to calculate ATR.
Atr Multiplier: A factor used to balance the impact of the ATR on the Trend Bands calculation.

[blackcat] L2 SVE Volatility BandsLevel 2
Background
Sylvain Vervoort’s articles in the July issues on 2018,“The V-Trade, Part 5: Technical Analysis—Moving Average Support & Resistance And Volatility Bands”
Function
In “The V-Trade, Part 5: Technical Analysis—Moving Average Support & Resistance And Volatility Bands” in the July 2018 STOCKS & COMMODITIES, author Sylvain Vervoort introduced a new type of price band that he calls the SVEVolatilityBand. He created this new type of band to better highlight volatility changes when using non-time-related charts. According to the author, when using charts such as renko, traditional bands may fail to effectively highlight these changes.
Remarks
Feedbacks are appreciated.

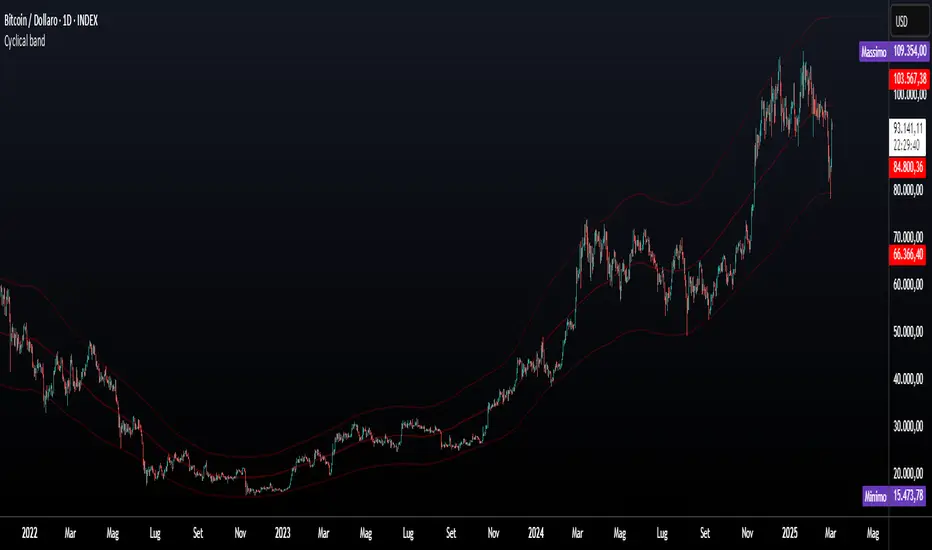
Cyclical bands v1This indicator is the evolution of the Bollinger bands, but adapted to our philosophy of cyclicality!
Highlight the excesses of the cycles.
Its construction is based on our centered medium design.
It works great when paired with our Cyclical Volatility Index indicator.
This fantastic indicator can be set at will!
It is possible to set the bands based on a variation of the standard deviation or percentage!
The bands are dual zones, in the sense that each band can be configured independently from the other, for example:
upper band% variation + 20
lower band% variation +15
For any bugs contact the creators
My Multiple MA-BandsRelease Notes
MY-BAND – Adaptive Moving Average Channel Indicator
MY-BAND is a customizable Moving Average Band / Channel indicator designed to help traders clearly visualize trend direction, dynamic support & resistance, and market structure on any timeframe.
This indicator builds adaptive price bands around Moving Averages, making it easier to identify:
Trend continuation
Trend reversal
Volatility expansion and contraction
Key breakout and pullback zones
It works perfectly for crypto, forex, and stock markets.
🔧 Key Features
Multi-Timeframe MA Bands
HiLo & LLMA Moving Average Types
Dynamic Channel Width
ZigZag Structure Detection
Average Center Line
Trend Bending Option
Support & Resistance Layer
Fully Adjustable Inputs
Works on All Timeframes
📊 How to Use
Trend Trading
Price above upper band → Strong bullish trend
Price below lower band → Strong bearish trend
Pullback Entries
Enter on pullback to middle MA in trend direction
Breakout Trading
Strong breakout outside the band signals continuation
Market Structure
ZigZag feature helps identify swing highs & lows
⚙️ Inputs Explanation
MA Timeframe (MA TF) – Select the timeframe for MA calculation
Length 1 & Length 2 – Fine-tune band sensitivity
MA Type – Choose between HiLo or LLMA
Width – Controls band distance
AVG Line – Show central average line
Zigzag – Display market structure swings
Extend – Extend channel into the future
Bending – Smooth adaptive band behavior
✅ Best For
Trend Followers
Scalpers
Swing Traders
Crypto Futures Traders
Breakout & Pullback Strategies
⚠️ Disclaimer
This indicator is for educational and analytical purposes only. It does not provide financial advice. Always use proper risk management and confirm signals with other indicators.

Dual TF VWAP + ATR BandsDual TF VWAP + EMA (3×3 Outer Shells)
A precision volatility framework combining institutional VWAP structure with trend-anchored EMA logic.
🔍 Overview
Dual TF VWAP + EMA is a multi-layer trend and volatility system designed for traders who want clean directional context, controlled volatility boundaries, and a reliable method to spot pivots, expansions, compressions, and exhaustion points across any timeframe.
This tool blends:
Higher-Timeframe VWAP (50-period rolling)
Local EMA Midline (configurable)
3×3 ATR Outer Shells
Directional Color Coding
Signal-Ready Interaction Zones
Unlike traditional Bollinger Bands, Keltner channels, or static envelopes, this indicator adapts dynamically with both price and volume, giving deeper insight into how institutions accumulate, distribute, or expand trends.
🎯 What It Shows
1. Higher-Timeframe VWAP Midline
A 50-period Rolling VWAP that reflects where real volume-weighted control sits.
Perfect for reading:
Institutional trend bias
Value area reclaims
High-confidence mean reversions
High-probability trend continuations
2. Local EMA Trendline (Configurable)
A flexible EMA that acts as your local “risk-on/off” trend gauge.
You can use:
12 EMA for aggression
20 EMA for balanced trending
50 EMA for slower institutional rhythm
This EMA + VWAP pairing creates a powerful trend confirmation system.
3. Outer ATR Shells (U1–U3 / L1–L3)
Three upper and three lower ATR-based shells form a volatility map showing:
U1/L1: First reaction zones
U2/L2: Overextension zones
U3/L3: Exhaustion / blow-off tops / panic bottoms
The 3×3 shells tell you instantly whether price is:
Expanding
Compressing
Overextended
Reversing
Trending cleanly
📘 How To Use It — Practical Trading Logic
1. Trend Confirmation
Bullish: Price above VWAP + EMA rising + 12 EMA above U1
Bearish: Price below VWAP + EMA falling + 12 EMA under L1
2. Reversals
U3/L3 taps signal exhaustion
EMA rejection at U1/U2 confirms fading momentum
VWAP reclaim confirms the reversal
Trend resumes once EMA crosses back above/below VWAP
3. Momentum Acceleration
When price floats above the EMA without touching it and rides between:
EMA → U1 → U2
trend acceleration is underway (trip-wire continuation signal).
4. Safe Entries
EMA reclaim
VWAP reclaim after sweep
EMA → VWAP “compression and release”
Price floating above EMA with U1 break
5. Safe Exits
U2/U3 spikes
EMA flattening
EMA cross back under VWAP
Shell compression before trend shift
---Why This Tool Works---
Traditional bands are one-dimensional:
They react to price only.
This tool uses price + volatility + volume, so it shows:
Real trend strength
Institutional control zones
High-probability reversal points
Low-risk entry pockets
It performs exceptionally well across:
SPY / QQQ
Tech momentum
Small caps
Crypto
High-beta growth names
Summary
Dual TF VWAP + EMA (3×3 Outer Shells) is built for traders who want:
Clear trend direction
Accurate expansion/reversal signals
Dynamic institutional value zones
Multi-timeframe confidence
Clean volatility boundaries
A powerful companion for confirmation systems, breakout strategies, and liquidity-based execution.

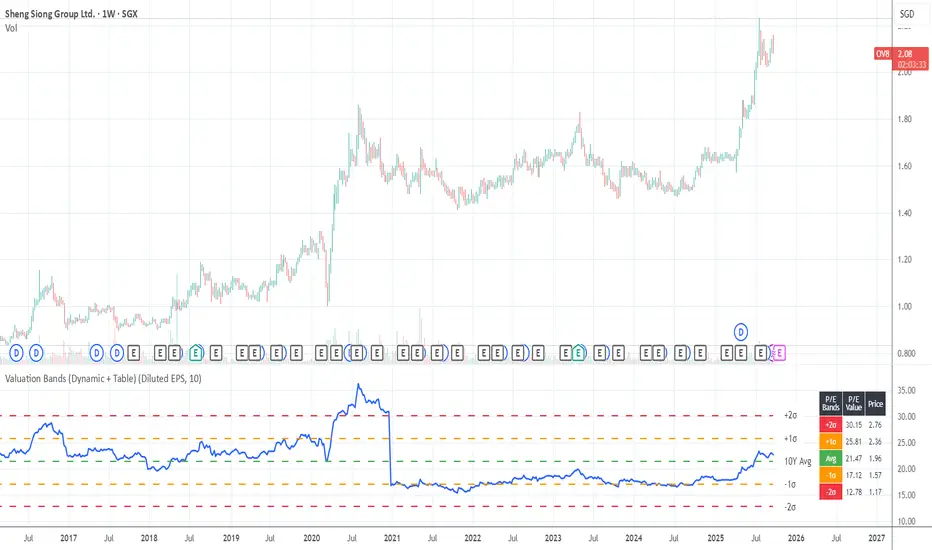
Valuation Bands (Dynamic + Table)Valuation Bands (Dynamic + Table)
This indicator helps investors assess whether a stock is trading at cheap, fair, or expensive levels relative to its historical valuation multiples. It dynamically calculates valuation ratios such as P/E, P/B, P/S, P/Operating Income, P/Cash Flow, or Dividend Yield over a customizable lookback period (e.g., 10 years).
Using these ratios, the script plots the long-term average alongside ±1σ and ±2σ standard deviation bands, highlighting valuation zones. The included data table displays both the multiple values and their corresponding price levels, making it easy to interpret fair value ranges.
Alerts are built in to notify when the current ratio crosses into undervalued (–2σ) or overvalued (+2σ) zones, helping investors spot potential opportunities or risks.
In short, this tool bridges fundamentals with technical visualization, giving a quick snapshot of how today’s valuation compares to historical norms.

GSR BandsGSR Bands is an indicator designed to analyze the dynamics of an implied volatility index based on opening gaps. The model builds an accumulated series of gaps and generates additional offset bands derived from Fibonacci numbers and prime numbers (+10, +20, +30, +50, +70, +80, +110, +125).
The result is a set of cumulative gap curves that help visualize relevant zones in the evolution of the volatility index (potential areas of maximum volatility). Users can customize the offset values displayed on the chart, making it easier to explore different analytical scenarios.
The indicator can be applied to volatility indices such as VIX or VDAX-NEWS, and may serve as a complementary tool when studying the relationship between implied volatility and equity markets.
Note : This indicator does not constitute an investment recommendation. It is intended solely as a technical analysis tool.

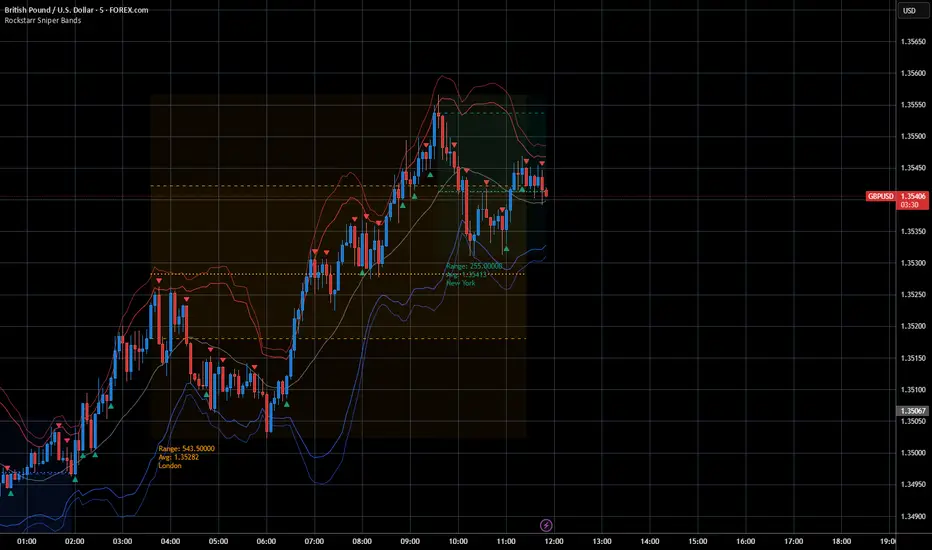
Session Sniper Bands — Pro Overlay (Bollinger, Sessions, Engulf)The Session Sniper Bands — Pro Overlay combines three powerful tools into one clean, professional script designed to help traders spot high-probability setups across any market.
📌 What’s included:
Dual Bollinger Bands → track volatility squeezes, expansions, and mean reversion zones.
Customizable Trading Sessions (Tokyo / London / New York) → shaded regions with editable names, open/close lines, range, and average price markers.
Engulfing Candlestick Signals → automatic bullish and bearish engulfing arrows for precision entry timing.
✨ Features:
Session names and times are fully customizable (rename “Tokyo” to “Asia Open,” etc.).
Clear OB/OS volatility cues via Bollinger stack.
Lightweight visuals that won’t clutter your chart.
Works across Forex, Crypto, Indices, and Binary Options.
⚡ Why use it?
This overlay is built for traders who want to snipe entries with session context. Spot when volatility contracts, align with session flows, and confirm with engulfing momentum candles — all in one view.
⚠️ Disclaimer: This script is for educational purposes only and is not financial advice. Always test on demo before trading live.
Double Median ATR Bands | MisinkoMasterThe Double Median ATR Bands is a version of the SuperTrend that is designed to be smoother, more accurate while maintaining a good speed by combining the HMA smoothing technique and the median source.
How does it work?
Very simple!
1. Get user defined inputs:
=> Set them up however you want, for the result you want!
2. Calculate the Median of the source and the ATR
=> Very simple
3. Smooth the median with √length (for example if median length = 9, it would be smoothed over the length of 3 since 3x3 = 9)
4. Add ATR bands like so:
Upper = median + (atr*multiplier)
Lower = median - (atr*multiplier)
Trend Logic:
Source crossing over the upper band = uptrend
Source crossing below the lower band = downtrend
Enjoy G´s!

TMT Crazy Horse BandsCrazy Horse ORB Strategy – Dynamic Trade Zones with Visual Edge
This indicator is built for traders who want to consistently identify high-probability trade setups using a combination of range breakouts, volatility zones, and momentum tracking. It’s primarily designed for intraday futures and CFD trading, with a focus on assets like the Nasdaq (MNQ/NQ), but works across various instruments and timeframes.
What it does:
The script identifies the 15-minute Opening Range (ORB) and overlays a dynamic set of bands (what we call “The Crazy Horse”) that expand and contract based on price momentum and structure. These bands help traders visualize expansion zones and potential reversal points. The system also detects shifts in market direction by comparing price behavior around the ORB in conjunction with volume flow and structure.
How to use it:
Wait for the 15-minute ORB to form after the open.
Look for price to break above or below the range with strength.
Use the mid-band as a re-entry or continuation zone.
Trailing stop logic is based on the band’s slope and interaction with price structure.
Why it’s closed-source:
The logic behind the band creation, entry signals, and trailing mechanisms has been refined through live trading and years of backtesting. The uniqueness lies in how this script adapts to changing volatility while respecting market structure. This flexibility allows for creative trade management and sizing techniques—something not found in any open-source version currently available.
Note:
For clean charting, this indicator should be used solo. Do not overlay additional scripts unless you are stacking logic intentionally. The visual output of this script is designed to stand on its own for decision making.

SMA Custom Volume BandsThe "SMA Custom Volume Bands" indicator is a custom technical analysis tool designed for use on the TradingView platform. This indicator allows users to analyze and visualize key aspects of a stock's volume within the context of its 200-period Simple Moving Average (SMA). It features the following components:
Volume Bars: The indicator displays the volume of a selected financial instrument using colored bars. Green bars represent days when the trading volume is higher than the previous day, while red bars represent days when the trading volume is lower.
200 SMA of Volume: A blue line on the chart represents the 200-period Simple Moving Average of the trading volume, providing insight into the longer-term volume trend.
Customizable Percentage Line: Users have the flexibility to set a custom percentage value above or below the 200 SMA of trading volume. This line is plotted as a blue line on the chart, allowing traders to identify when volume meets their preferred percentage threshold.
The "SMA Custom Volume Bands" indicator is a simple tool for traders, aiding in the assessment of volume trends and potential price reversals in the context of moving averages. It offers customization options, enhancing its adaptability to individual trading strategies and preferences.

Logarithmic Bollinger Bands [MisterMoTA]The script plot the normal top and bottom Bollinger Bands and from them and SMA 20 it finds fibonacci logarithmic levels where price can find temporary support/resistance.
To get the best results need to change the standard deviation to your simbol value, like current for BTC the Standards Deviation is 2.61, current Standard Deviation for ETH is 2.55.. etc.. find the right current standard deviation of your simbol with a search online.
The lines ploted by indicators are:
Main line is a 20 SMA
2 retracement Logarithmic Fibonacci 0.382 levels above and bellow 20 sma
2 retracement Logarithmic Fibonacci 0.618 levels above and bellow 20 sma
Top and Bottom Bollindger bands (ticker than the rest of the lines)
2 expansion Logarithmic Fibonacci 0.382 levels above Top BB and bellow Bottom BB
2 expansion Logarithmic Fibonacci 0.618 levels above Top BB and bellow Bottom BB
2 expansion Logarithmic Fibonacci level 1 above Top BB and bellow Bottom BB
2 expansion Logarithmic Fibonacci 1.618 levels above Top BB and bellow Bottom BB
Let me know If you find the indicator useful or PM if you need any custom changes to it.

custom Bollinger bands with filters - indicator (AS)-----------Description-------------
This indicator is basically Bollinger bands with many ways to customize. It uses highest and lowest values of upper and lower band for exits. I think something is wrong with the script but cant find any mistakes – most probably smoothing. The ATR filter is implemented but is working incorrectly. In code you can also turn it into strategy but I do not recommend it for now as it is not ready yet.
So this is my first script and I am looking for any advice, ideas to improve this script, sets of parameters, markets to apply, logical mistakes in code or any ideas that you may have. Indicator was initially designed for EURUSD 5MIN but I would be interested in other ideas.
-----------SETTINGS--------------
---START - In starting settings we can choose
Line 1: what parts to use BB/DC/ATR
Line 2: what parts to plot on chart
Line 3 Whether or not apply smoothing to BB or ATR filter
Line 4 Calculate deviation for BB from price or Moving average
Line 5 Fill colors and plot other parts for debug (overlay=false)
Line 6:( for strategy) – enable Long/Short Trades
---BB and DC – here we modify Bollinger bands and Donchian
Line 1: Length and type of BB middle line and also length of DC from BB
Line 2: Length and type of BB standard deviation and multiplier
Line 3: Length and type of BB smoothing and %width for BB filter
---ATR filter – (not ready fully yet)
Line 1: type and length of ATR
Line 2: threshold and smoothing value of ATR
---DATE and SESSION
Line 1: apply custom date or session?
Line 2: session hours settings
Line 3:Custom starting date
Line 4: Custom Ending date
-----------HOW TO USE--------------
We open Long if BB width is bigger than threshold and close when upper band is no longer highest in the period set. Exact opposite with Short

SPX Fair Value Bands WSHOSHOThis is a variation of the SPX Fair Value Bands indicator which uses WSHOSHO instead of WALCL.
WSHOSHO only includes the 'Securities Held Outright' portion of the Fed balance sheet. This effectively eliminates the portions related to BTFP (Bank Term Funding Program).
Weighted Deviation Bands [Loxx]What are Weighted Deviation Bands?
Variation of the Bollinger bands but it uses linear weighted average and weighted deviation via Mladen Rakic.
What is Weighted Deviation?
This weighted deviation is a sort of all linear weighted deviation. It uses linear weighting in all the steps calculated (which makes it different from the built in deviation in a case when linear weighted ma is used in the ma method). It is more responsive than the standard deviation
Included
Bar coloring

QQQ Fair Value BandsThis is similar to the SPX Fair Value Bands indicator, but for QQQ.
It is based on the Net Liquidity model:
Net Liquidity = FED - RRP - TGA

Bollinger Bands SignalsDescription:
This indicator works well in trendy markets on long runs and in mean-reverting markets, at almost any timeframe.
That said, higher timeframes are much preferred for their intrinsic ability to cut out noise. The example chart is in 3H TF.
Be mindful, the script shows somewhat erratic jigsaw-like behaviour during consolidation periods when the price
jumps up and down in indecision which way to go. Fortunately, there are scripts out there that detect such periods.
You can choose between 4 Moving Averages, Vidya being the default. Period, Deviation and Bands Width parameters
all of them affect the signal generation.
For the Pine Script coder this script is pretty obvious.
It uses a standard technical analysis indicator - Bollinger Bands - and appends it with a 'width' parameter and
a signal generation procedure.
The signal generation procedure is the heart of this script that keeps the script pumping signals.
The BB width is used as a filter.
You can use this procedure in your own scripts and it will continue generate signals according to your rules.

Bollinger Bands [Anan]Hello friends,,
This is my own enhanced version of Bollinger Bands based on some backtesting,,
It's the same logic behind standard BB but instead of using length(period), I created a formula and used a "factor" to scale it up/down.
The formula is just average of averages of averages... (But it's backtested with good results)
I also added two standard deviations so that the distance between them will be the (over-bought/over-sold zones)
And finally added a squeeze indicator to identify the predicted price action movements..
You have the options to control everything like:
-Timeframe
-Source
-Calculation Method
-Length Factor
-StdDev#1
-StdDev#2
-Squeeze Factor
-Squeeze Threshold

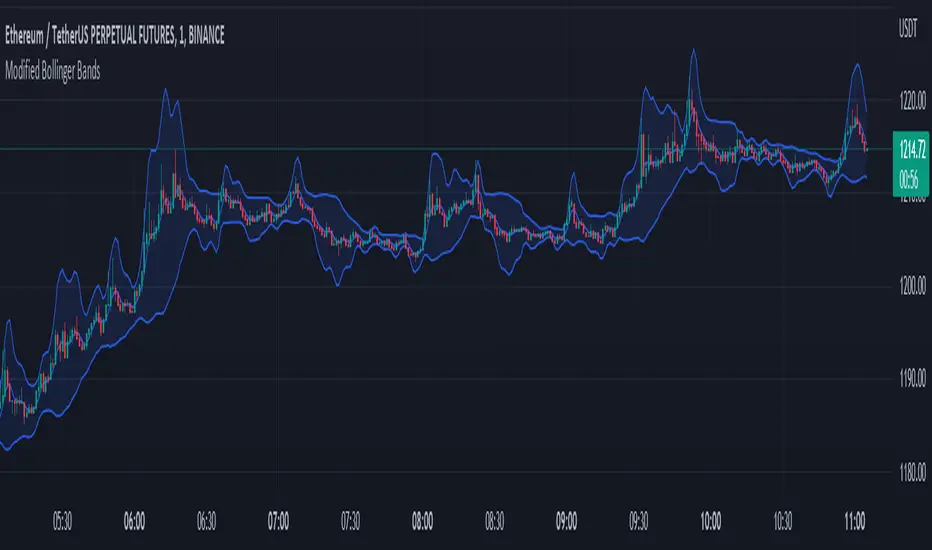
Modified Bollinger BandsThis script has been distributed for learning purposes.
A particular kind of price envelope is "Bollinger Bands" indicator. Upper and lower price range levels are determined by price envelopes. By default, Bollinger Bands are plotted in Tradingview as envelopes at a standard deviation level above and below the price's simple moving average (SMA). I attempted to modify the indicator in this version by adding several kinds of moving averages first. The key feature is that standard deviation should be modified. in Tradingview, SMA calculates the standard deviation. The allocated moving average should be used to calculate the std function when the base line is changed.