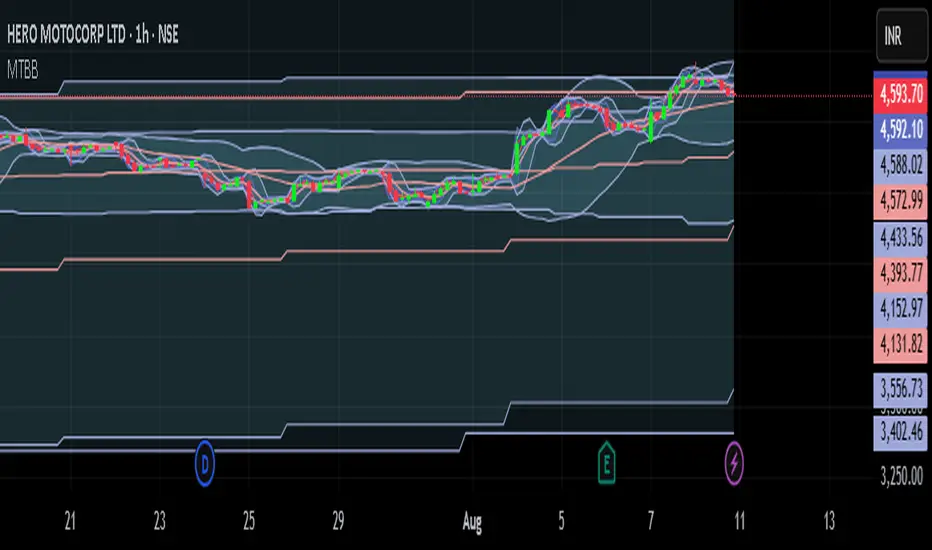
Multi Timeframe 7 Bollinger Bands by CSPMulti Timeframe 7 Bollinger Bands by CSP IT SHOW 1MT,5MT,10MT,1HR,D, W,M BOLLINGER BAND IN ASINGLE CHART. Indicatore Pine Script®di patelpurima19848
Bollinger Bands Volatility Arrows Explanation of Changes: Arrow Style: Green Up Arrow (▲): Indicates increasing volatility with a positive value. Red Down Arrow (▼): Indicates decreasing volatility with a negative value. Labels with Arrows: label.new is used to create arrows with the label.style_label_up or label.style_label_down styles. The numerical value of the volatility is displayed beside the arrow using str.tostring. Label Position: For increasing volatility, the green arrow is placed near the high of the candle. For decreasing volatility, the red arrow is placed near the low of the candle. Text Format: Includes the arrow symbol and the volatility value (formatted to 4 decimal places). How It Works: You’ll see green upward arrows for increasing volatility and red downward arrows for decreasing volatility. Each arrow includes the exact value of the Bollinger Bands width at that moment.Indicatore Pine Script®di faromeroreal26
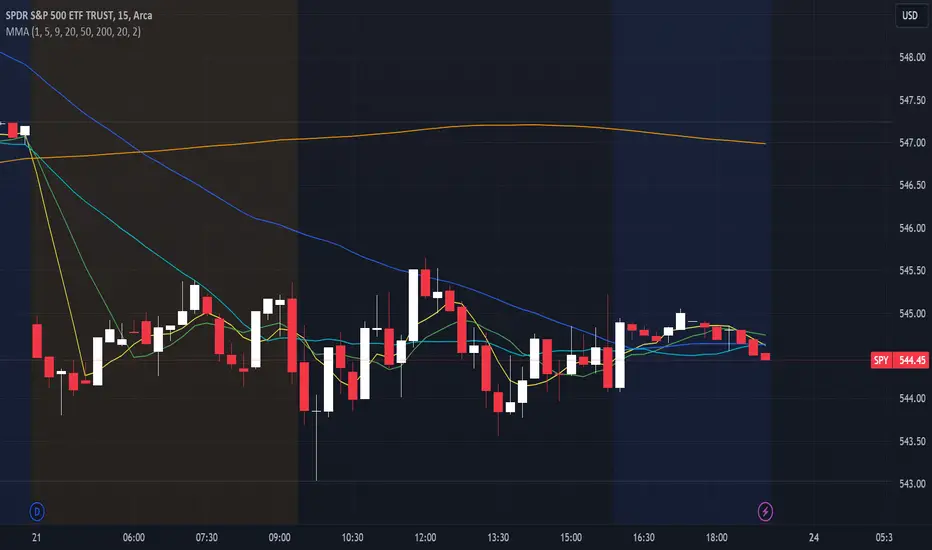
Multiple Moving Averages, Bollinger Bands, VWAP Options - Lett5 simple moving averages. You decide: 1. The type of moving average 2. The length of the moving average 3. To show Bollinger Bands 4. To show VWAP. Indicatore Pine Script®di dglett1130
Ultimate Bands [BigBeluga]Ultimate Bands The Ultimate Bands indicator is an advanced technical analysis tool that combines elements of volatility bands, oscillators, and trend analysis. It provides traders with a comprehensive view of market conditions, including trend direction, momentum, and potential reversal points. 🔵 KEY FEATURES ● Ultimate Bands Consists of an upper band, lower band, and a smooth middle line Based on John Ehler's SuperSmoother algorithm for reduced lag Bands are calculated using Root Mean Square Deviation (RMSD) for adaptive volatility measurement Helps identify potential support and resistance levels ● Ultimate Oscillator Derived from the price position relative to the Ultimate Bands Oscillates between overbought and oversold levels Provides insights into potential reversals and trend strength ● Trend Signal Line Based on a Hull Moving Average (HMA) of the Ultimate Oscillator Helps identify the overall trend direction Color-coded for easy trend interpretation ● Heatmap Visualization Displays the current state of the oscillator and trend signal Provides an intuitive visual representation of market conditions Shows overbought/oversold status and trend direction at a glance ● Breakout Signals Optional feature to detect and display breakouts beyond the Ultimate Bands Helps identify potential trend reversals or continuations Visualized with arrows on the chart and color-coded candles 🔵 HOW TO USE ● Trend Identification Use the color and position of the Trend Signal Line to determine the overall market trend Refer to the heatmap for a quick visual confirmation of trend direction ● Entry Signals Look for price touches or breaks of the Ultimate Bands for potential entry points Use oscillator extremes in conjunction with band touches for stronger signals Consider breakout signals (if enabled) for trend-following entries ● Exit Signals Use opposite band touches or breakouts as potential exit points Monitor the oscillator for divergences or extreme readings as exit signals ● Overbought/Oversold Analysis Use the Ultimate Oscillator and heatmap to identify overbought/oversold conditions Look for potential reversals when the oscillator reaches extreme levels ● Confirmation Combine Ultimate Bands, Oscillator, and Trend Signal for stronger trade confirmation Use the heatmap for quick visual confirmation of market conditions 🔵 CUSTOMIZATION The Ultimate Bands indicator offers several customization options: Adjust the main calculation length for bands and oscillator Modify the number of standard deviations for band calculation Change the signal line length for trend analysis Toggle the display of breakout signals and candle coloring By fine-tuning these settings, traders can adapt the Ultimate Bands indicator to various market conditions and personal trading strategies. The Ultimate Bands indicator provides a multi-faceted approach to market analysis, combining volatility-based bands, oscillator analysis, and trend identification in one comprehensive tool. Its adaptive nature and visual cues make it suitable for both novice and experienced traders across various timeframes and markets. The integration of multiple analytical elements offers traders a rich set of data points to inform their trading decisions.Indicatore Pine Script®di BigBelugaAggiornato 66 1.6 K
R100 Volatility Combo Bands v1 (*v*)The Volatility Combo Bands are made from 4 separate volatility bands- two Bollinger Bands (10 and 20 period) and two Price Headley Acceleration Bands (10 and 20 period). The Volatility Combo Bands plot the innermost upper and lower points from these bands and then plots a mid-line. By default, only the standard 20 period Bollinger Bands and Combo Bands with mid-line are displayed, but can be configured however you want. Try it out- see squeezes earlier, ride the bands earlier in trending markets, trade pullbacks to the Combo Bands and mid-line, trade the range of the band or use them to help identify potential support and resistance levels. Hopefully they can add another dimension to identifying volatility contraction patterns or whatever you currently use these things for! I hope you get some value out of it. Only conditions of use are that if you improve it, let me know and if you publish something that uses it, don't hide the code! Enjoy! Code for the Price Headley Acceleration Bands pinched and modified from LazyBear - thankyou. Indicatore Pine Script®di Rooster10022108
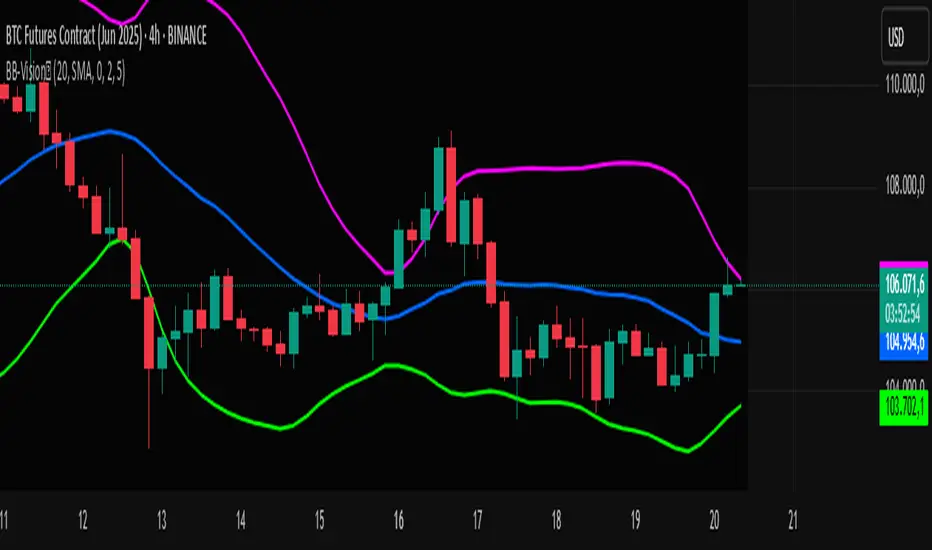
Bands Vision-XBands Vision-X (BB-Vision-X) – Full Description Description: Bands Vision-X is an indicator based on dynamic bands constructed from customizable moving averages and standard deviation, allowing you to visualize potential support and resistance zones, volatility, and market conditions. It uses an adjustable moving average (with multiple options such as SMA, EMA, WMA, JMA, LSMA, DEMA, and TEMA) to define the central line, and upper and lower bands calculated by standard deviation multiplied by an adjustable factor. The bands are smoothed by a Hull Moving Average (HMA) to reduce noise and improve clarity. How to Use The bands indicate potential support and resistance levels. The central line serves as a dynamic price reference. The distance between bands reflects market volatility. Touches or breakouts of the bands may signal entry or exit opportunities. Parameters Parameter Description Default Standard Error Band Period Period for moving average and standard deviation 20 Moving Average Type Type of moving average (SMA, EMA, etc.) SMA Standard Deviation Multiplier Multiplier for standard deviation 2.0 Band Lines Smoothing Period Period for smoothing the bands (HMA) 5 Technical Notes The JMA function used is not the original Jurik version but an approximate and open implementation based on publicly available TradingView community code. Developed in Pine Script v6 with optimized and clean code. Recommendations Ideal for traders seeking a clear view of volatility and dynamic support/resistance levels. Should not be used in isolation; it is recommended to combine with volume analysis, price action, or other technical indicators. Adjust the period and multiplier according to the asset and timeframe for better effectiveness.Indicatore Pine Script®di Canhoto-MediumAggiornato 1132
Exponential Deviation Bands Width [ChuckBanger]This indicator is a compliment to Exponential Deviation Bands . It is the difference between the upper and the lower bands divided by the middle band. It is an easy way to visualize consolidation before price movements or periods of higher volatility. How it works During a period of high volatility, the distance between the two bands will widen and Exponential Deviation Bands width will increase. And the opposite occurs during a period of low volatility, the distance between the two bands will contract and Exponential Deviation Bands width will decrease. Meaning there is a tendency for bands to alternate between expansion and contraction. When the bands are relatively far apart, that is often is a sign that the current trend is ending. When the distance between the two bands is relatively narrow that often is a sign that the market is about to initiate a bigger move in either direction.Indicatore Pine Script®di ChuckBanger87
Combo Backtest 123 Reversal & Fractal Chaos Bands This is combo strategies for get a cumulative signal. First strategy This System was created from the Book "How I Tripled My Money In The Futures Market" by Ulf Jensen, Page 183. This is reverse type of strategies. The strategy buys at market, if close price is higher than the previous close during 2 days and the meaning of 9-days Stochastic Slow Oscillator is lower than 50. The strategy sells at market, if close price is lower than the previous close price during 2 days and the meaning of 9-days Stochastic Fast Oscillator is higher than 50. Second strategy Stock market moves in a highly chaotic way, but at a larger scale, the movements follow a certain pattern that can be applied to shorter or longer periods of time and we can use Fractal Chaos Bands Indicator to identify those patterns. Basically, the Fractal Chaos Bands Indicator helps us to identify whether the stock market is trending or not. When a market is trending, the bands will have a slope and if market is not trending the bands will flatten out. As the slope of the bands decreases, it signifies that the market is choppy, insecure and variable. As the graph becomes more and more abrupt, be it going up or down, the significance is that the market becomes trendy, or stable. Fractal Chaos Bands Indicator is used similarly to other bands-indicator (Bollinger bands for instance), offering trading opportunities when price moves above or under the fractal lines. The FCB indicator looks back in time depending on the number of time periods trader selected to plot the indicator. The upper fractal line is made by plotting stock price highs and the lower fractal line is made by plotting stock price lows. Essentially, the Fractal Chaos Bands show an overall panorama of the price movement, as they filter out the insignificant fluctuations of the stock price. WARNING: - For purpose educate only - This script to change bars colors.Strategia Pine Script®di HPotter179
Combo Strategy 123 Reversal & Fractal Chaos Bands This is combo strategies for get a cumulative signal. First strategy This System was created from the Book "How I Tripled My Money In The Futures Market" by Ulf Jensen, Page 183. This is reverse type of strategies. The strategy buys at market, if close price is higher than the previous close during 2 days and the meaning of 9-days Stochastic Slow Oscillator is lower than 50. The strategy sells at market, if close price is lower than the previous close price during 2 days and the meaning of 9-days Stochastic Fast Oscillator is higher than 50. Second strategy Stock market moves in a highly chaotic way, but at a larger scale, the movements follow a certain pattern that can be applied to shorter or longer periods of time and we can use Fractal Chaos Bands Indicator to identify those patterns. Basically, the Fractal Chaos Bands Indicator helps us to identify whether the stock market is trending or not. When a market is trending, the bands will have a slope and if market is not trending the bands will flatten out. As the slope of the bands decreases, it signifies that the market is choppy, insecure and variable. As the graph becomes more and more abrupt, be it going up or down, the significance is that the market becomes trendy, or stable. Fractal Chaos Bands Indicator is used similarly to other bands-indicator (Bollinger bands for instance), offering trading opportunities when price moves above or under the fractal lines. The FCB indicator looks back in time depending on the number of time periods trader selected to plot the indicator. The upper fractal line is made by plotting stock price highs and the lower fractal line is made by plotting stock price lows. Essentially, the Fractal Chaos Bands show an overall panorama of the price movement, as they filter out the insignificant fluctuations of the stock price. WARNING: - For purpose educate only - This script to change bars colors.Indicatore Pine Script®di HPotter1515 1.6 K
Extended Recursive Bands - Maximum Efficiency With Extra OptionsIntroducing A New Calculation For Efficient Bands Calculation ! Here it is ! The Recursive Bands Indicator, an indicator specially created to be extremely efficient, i think you already know that calculation time is extra important in algorithmic trading, and this is the principal motivation for the creation of the proposed indicator. Originally described in my paper "Pierrefeu, Alex (2019): Recursive Bands - A New Indicator For Technical Analysis" , the indicator framework has been widely used in my previous uploaded indicators, however it would have been a shame to not upload it, however user experience being a major concern for me, i decided to add extra options, which explain the term "extended". On The Indicator Calculation You can skip this part if it doesn't interest you. The calculation of the indicator is based on recursion, but i want to explain the mathematical formula described in the paper. I've seen some users trying to remake it from the calculations, however there was always something weird, and i understand, mathematical notations are always a bit weird, even myself don't always write them correctly/understand them, however this one is relatively simple to understand. First lets explain each elements of the calculation : α = smoothing constant, or 2/(length+1) max/min = maximum and minimum function, max return the greatest input value while min return the lowest one, for example : max(4,2) = 4 while min(4,2) = 2 the "||" notation mean taking the absolute value, for example : |-1| = abs(-1) = 1 The calculation after the max/min function is called the correction factor, and is the core of the indicator. The last two variables are just here to provide an initial value for upper and lower, basically when we start our calculations we will assign the value of the closing price for upper and lower. The motivation behind using a smoothing constant in range of (0,1) was to tell the reader that the indicator is easily made adaptive, this is what i did on my adaptive trailing stop indicator by using the efficiency ratio as smoothing variable, the user can use 1/length instead of the provided calculation for alpha. If you interested on the indicator main logic, it is actually really simple, by using upper = max(price,upper) and lower = min(price,lower) we would get the maximum/minimum price value at time t , therefore upper can only be greater or equal than its precedent value, while lower can only be lower or equal than its precedent value, in order to fix that we subtract/sum upper/lower with a value, this allow the upper band to be lower than its precedent value and lower to be greater than its precedent value, this is the role of the correction factor. The Indicator The indicator display one upper and one lower band, every common usages applied to bands indicators such as support/resistance, breakout, trailing stop...etc, can also be applied to this one. length control how reactive the bands are, higher values of length will make the bands cross the price less often. In order to provide more flexibility for the user i added the option to use various methods for the calculation of the indicator, therefore the indicator can use the average true range, standard deviation, average high-low range, and one totally exclusive method specially designed for this indicator. Classic Method This option make the indicator use its classical calculation, this is the most efficient method of all. Atr Method (atr) This method use the average true range as correction factor, notice that lower values of length can still produce wide band. Standard Deviation Method (stdev) This method use a biased estimate of the standard deviation as correction factor. The method produce smoother bands that converge more slowly toward the price in comparison with the classic correction factor. Average High-Low Range Method (ahlr) This method use the average of the high-low range as correction factor, extremely similar to the average true range. Rising Falling Volatility (rfv) Method A new method created for this indicator, this correction factor use the absolute prices changes when price value is greater/lower than any length past values of the price, this allow to have more boxy shaped bands, work best with greater values of length. The bands can be in contact with this method, a possible fix in the future. Conclusion The recursive band indicator is one of my greatest indicators in my opinion (i would love to have yours), as you can see the idea behind it is extremely simple and allow for a super efficient band indicator, which was the original motivation behind it, in order to provide more fun for the users i also added more option for the correction factor, this allow the user to be creative and not get stuck with the original calculation. Like the trend step indicator family we have almost ended our series on the recursive band framework, 1 more trailing stop will be added in the future, and then we'll have more "boring" stuff until i find something cool again, it shouldn't be long ;) Thanks for reading ! Indicatore Pine Script®di alexgrover1818390
Fractal Chaos Bands Strategy Stock market moves in a highly chaotic way, but at a larger scale, the movements follow a certain pattern that can be applied to shorter or longer periods of time and we can use Fractal Chaos Bands Indicator to identify those patterns. Basically, the Fractal Chaos Bands Indicator helps us to identify whether the stock market is trending or not. When a market is trending, the bands will have a slope and if market is not trending the bands will flatten out. As the slope of the bands decreases, it signifies that the market is choppy, insecure and variable. As the graph becomes more and more abrupt, be it going up or down, the significance is that the market becomes trendy, or stable. Fractal Chaos Bands Indicator is used similarly to other bands-indicator (Bollinger bands for instance), offering trading opportunities when price moves above or under the fractal lines. The FCB indicator looks back in time depending on the number of time periods trader selected to plot the indicator. The upper fractal line is made by plotting stock price highs and the lower fractal line is made by plotting stock price lows. Essentially, the Fractal Chaos Bands show an overall panorama of the price movement, as they filter out the insignificant fluctuations of the stock price. WARNING: - This script to change bars colors.Indicatore Pine Script®di HPotter77218
Fractal Chaos Bands Stock market moves in a highly chaotic way, but at a larger scale, the movements follow a certain pattern that can be applied to shorter or longer periods of time and we can use Fractal Chaos Bands Indicator to identify those patterns. Basically, the Fractal Chaos Bands Indicator helps us to identify whether the stock market is trending or not. When a market is trending, the bands will have a slope and if market is not trending the bands will flatten out. As the slope of the bands decreases, it signifies that the market is choppy, insecure and variable. As the graph becomes more and more abrupt, be it going up or down, the significance is that the market becomes trendy, or stable. Fractal Chaos Bands Indicator is used similarly to other bands-indicator (Bollinger bands for instance), offering trading opportunities when price moves above or under the fractal lines. The FCB indicator looks back in time depending on the number of time periods trader selected to plot the indicator. The upper fractal line is made by plotting stock price highs and the lower fractal line is made by plotting stock price lows. Essentially, the Fractal Chaos Bands show an overall panorama of the price movement, as they filter out the insignificant fluctuations of the stock price.Indicatore Pine Script®di HPotterAggiornato 44728
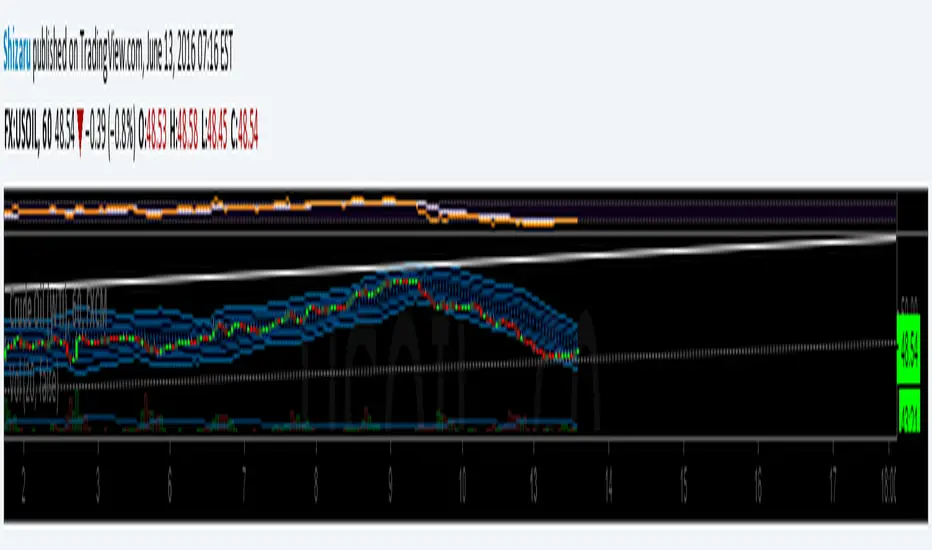
Bollinger Bands Fibonacci ratiosThe Fibonacci Bollinger Bands indicator is based on the same principles as the standard Bollinger Bands indicator developed by John Bollinger. The Fibonacci Bollinger Bands indicator bases its upper and lower bands on volatility just like the Bollinger Bands indicator does, but instead of using standard deviation as the measure of volatility, a Wilders Smoothed ATR is used in its place. The middle band is a moving average used to establish the intermediate-term trend. The 3 upper bands are constructed by using the Wilders Smoothed ATR and multiplying it by each of the Fibonacci factors (1.618, 2.618, and 4.236) and then adding the results to the middle band. The 3 lower bands are constructed in the same manner as the upper bands except their results are subtracted from the middle band. Indicatore Pine Script®di Shizaru3535 6.6 K
Ehlers Fractal Adaptive Moving Average with Bands [Bitcoinduke]FRAMA – What is it? Fractal Adaptive Moving Average Technical Indicator ( FRAMA ) was developed by John Ehlers, code was implemented by TradingView user Shizaru. I've updated it to Pine Script 4 and added Bands Extension. This indicator is constructed based on the algorithm of the Exponential Moving Average , in which the smoothing factor is calculated based on the current fractal dimension of the price series. Advantages: possibility to follow strong trend movements determine moments of price consolidation ( FRAMA sufficiently slow down at these moments) FRAMA + Bands The FRAMA serves as a base for the Upper and Lower Bands which are used as a way to measure volatility by observing the relationship between the Bands and price. Typically the Upper and Lower Bands are set to two standard deviations away from the FRAMA ; however it should be adjusted depending on the task. Indicatore Pine Script®di Bitduke161
Any MA bands (TMA bands V2)Hi everyone Website will be opening very shortly :) Sorting out the last details and we're so excited to finally roll-out our different Algorithm Builders for you guys Forewords This present script is an evolution of the TMA bands . I would never have expected that script to become so popular to be honest This is not only a study or idea but a really proven method and I'm glad that many of you are using it already. But please, whenever you see a new script out there, even if it looks cool and promising, please test it on a demo account for a week or on a LIVE account but with tiny amounts every time. Many times, what you see on the chart is not what will happen in reality. I know that most of you will agree and I know exactly why we see this behavior... I'll give more details in a later post I have plenty of methods like that one and I'll detail them on my website (and a bit on TradingView) starting next month TMA bands on steroids Someone asked me privately to make a generic version of the TMA bands and make it compatible with other standards Moving Average types. That's it for the specifications really as I didn't do much than re-using some piece of my own code Suggested (but not mandatory) methodology 1) The Take Profit 1 is the middle line, Take Profit 2 is the opposite band. 2) Once the TP1 is hit, set your Stop Loss to breakeven 3) Once the TP2 is hit, if you still want to stay in the trade, set your Stop Loss to the TP1 It will be a powerful tool in your arsenal for some scalp/intraday trades Wishing you all of you a great and profitable day PS It's strictly forbidden to republish this script without my explicit approval. All my posts are copyrighted from now on Obviously you can use but not republish and get the credit or even worse... some money from your own clients Dave ____________________________________________________________ Be sure to hit the thumbs up. Building those indicators take a lot of time and likes are always rewarding for me :) (tips are accepted too) - If you want to suggest some indicators that I can develop and share with the community, please use my personal TRELLO board - I'm an officially approved PineEditor/LUA/MT4 approved mentor on codementor. You can request a coaching with me if you want and I'll teach you how to build kick-ass indicators and strategies Jump on a 1 to 1 coaching with me - You can also hire for a custom dev of your indicator/strategy/bot/chrome extension/python Disclaimer: Trading involves a high level of financial risk, and may not be appropriate because you may experience losses greater than your deposit. Leverage can be against you. Do not trade with capital that you can not afford to lose. You must be aware and have a complete understanding of all the risks associated with the market and trading. We can not be held responsible for any loss you incur. Trading also involves risks of gambling addiction. Please notice I do not provide financial advice - my indicators, strategies, educational ideas are intended to provide only some source code for anyone interested in improving their trading The proprietary indicators and strategies developed by Best Trading Indicator, the object of intellectual property rights are and remain the exclusive property of Best Trading Indicator, at the exclusion of images and videos and texts free of rights or provided by the Company or external legal or physical person. No assignment of intellectual property rights is carried out through these Terms and Conditions. Any total or partial reproduction, modification or use of these properties for any reason whatsoever is strictly prohibited without the express written authorization of the Company.Indicatore Pine Script®di Daveatt88 1.1 K
Flagging BandsIntroduction A pun between the word flag and the adjective flagging (less dynamic) , this indicator have two bands who react faster when in contact to the price. Imagine you are under sheets, if you abruptly rise, the sheets will instantaneously go up, then if you abruptly get down, the sheets will fall slowly until being in contact with a surface, this is because of a type of friction called drag or air resistance , this force is described in fluid dynamics and i inspired myself from that for the creation of the indicator. The indicator The indicator is made of two bands, one upper band and one lower band, then a weighted average of each bands, this average is weighted depending on which band the price is closer. The length control the period of the indicator, in general higher lengths will create wider bands, you must consider that this parameter behave differently than other ones and may create slower results in comparison with other bands indicators while having the same length period. The indicator can use a simple breakout methodology (see trailing stop part) but can sometime provide support and resistance points, in fact i believe that when the average variability/volatility of band A is higher than the average variability/volatility of band B and that the price cross band B then price will reverse its direction, this claim is not justified, research is needed. Trailing Stop Mod It is possible to make the indicator act as a trailing stop, in order to do so just tick the trailing stop mod box. The average/bands will automatically disappear being replaced by the trailing stop. Conclusion I was just playing around when making the skeleton of the indicator, i hope the code is easy to understand, if you need some kind of explanation just pm me, i'm always open to help people/receive suggestions. Best Regards Indicatore Pine Script®di alexgrover1212451
Relative Strength Index w/ STARC Bands and PivotsThis is an old script that I use with some useful RSI strategies from "Technical Analysis for the Trading Professional" 2nd edition by Constance Brown. The base RSI comes with the option for custom length, and has some pre-configured ranges for looking at exits and entrances. The idea is to be bullish when bounces happen in the red zone during an already bullish trend or when the indicator enters green without a rejection. Be bearish if the indicator falls through the red zone or fails to enter green during an already bearish trend. I have added the formulas used for creating STARC bands (just think fancier volatility bands) with adjustable tolerances. The idea is to look out for when the RSI touches one of the bands and reverses. This is usually indicative of a strong reversal (though the timing will be up to the trader). Best use this on shorter time frames during a volatile time of a stock's price action. Although a little messy, there is a small segment of the script which includes pivot points. I like to use these because they make indicating local highs/lows for finding divergences easier. Finally, I have added a couple of customizable EMAS for the RSI itself. Useful when combined with the other features!Indicatore Pine Script®di jsalemfinancial1143
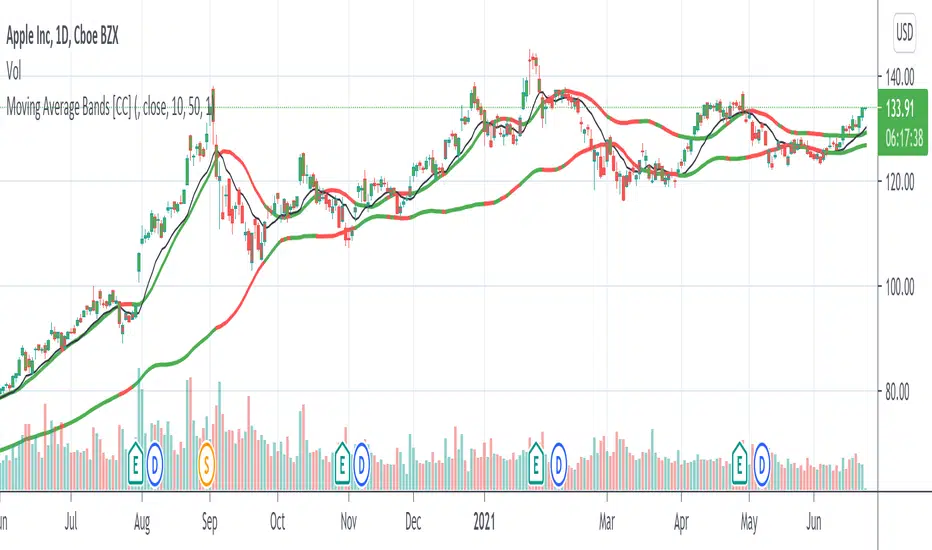
Moving Average Bands [CC]The Moving Average Bands were created by Vitali Apirine (Stocks and Commodities July 2021 pg 16) and this is a very handy trend following indicator that will give you the overall trend of the underlying stock. As the bands rise then the stock is in an uptrend and as they fall then it is a downtrend. If the bands stay flat then it is a sideways and/or choppy market. I did change the middle band from what he originally authored because I believe this gives more accurate buy and sell signals so keep that in mind. Feel free to use a different moving average than the original exponential moving average in the formula. As always buy when the indicator lines turn green and sell when they turn red. Let me know if there are any other indicators you would like to see me publish!Indicatore Pine Script®di cheatcountry2296
Overlay Indicators (EMAs, SMAs, Ichimoku & Bollinger Bands)This is a combination of popular overlay indicators that are used for dynamic support and resistance, trade targets and trend strength. Included are: -> 6 Exponential Moving Averages -> 6 Simple Moving Averages -> Ichimoku Cloud -> Bollinger Bands -> There is also a weekend background marker ideal for cryptocurrency trading Using all these indicators in conjunction with each other provide great confluence and confidence in trades and price targets. An explanation of each indicator is listed below. What Is an Exponential Moving Average (EMA)? "An exponential moving average (EMA) is a type of moving average (MA) that places a greater weight and significance on the most recent data points. The exponential moving average is also referred to as the exponentially weighted moving average. An exponentially weighted moving average reacts more significantly to recent price changes than a simple moving average (SMA), which applies an equal weight to all observations in the period. What Does the Exponential Moving Average Tell You? The 12- and 26-day exponential moving averages (EMAs) are often the most quoted and analyzed short-term averages. The 12- and 26-day are used to create indicators like the moving average convergence divergence (MACD) and the percentage price oscillator (PPO). In general, the 50- and 200-day EMAs are used as indicators for long-term trends. When a stock price crosses its 200-day moving average, it is a technical signal that a reversal has occurred. Traders who employ technical analysis find moving averages very useful and insightful when applied correctly. However, they also realize that these signals can create havoc when used improperly or misinterpreted. All the moving averages commonly used in technical analysis are, by their very nature, lagging indicators." Source: www.investopedia.com Popular EMA lookback periods include fibonacci numbers and round numbers such as the 100 or 200. The default values of the EMAs in this indicator are the most widely used, specifically for cryptocurrency but they also work very well with traditional. EMAs are normally used in conjunction with Simple Moving Averages. " What Is Simple Moving Average (SMA)? A simple moving average (SMA) calculates the average of a selected range of prices, usually closing prices, by the number of periods in that range. Simple Moving Average vs. Exponential Moving Average The major difference between an exponential moving average (EMA) and a simple moving average is the sensitivity each one shows to changes in the data used in its calculation. More specifically, the EMA gives a higher weighting to recent prices, while the SMA assigns an equal weighting to all values." Source: www.investopedia.com In this indicator, I've included 6 popular moving averages that are commonly used. Most traders will find specific settings for their own personal trading style. Along with the EMA and SMA, another indicator that is good for finding confluence between these two is the Ichimoku Cloud. " What is the Ichimoku Cloud? The Ichimoku Cloud is a collection of technical indicators that show support and resistance levels, as well as momentum and trend direction. It does this by taking multiple averages and plotting them on the chart. It also uses these figures to compute a "cloud" which attempts to forecast where the price may find support or resistance in the future. The Ichimoku cloud was developed by Goichi Hosoda, a Japanese journalist, and published in the late 1960s.1 It provides more data points than the standard candlestick chart. While it seems complicated at first glance, those familiar with how to read the charts often find it easy to understand with well-defined trading signals." More info can be seen here: www.investopedia.com I have changed the default settings on the Ichimoku to suit cryptocurrency trading (as cryptocurrency is usually fast and thus require slightly longer lookbacks) to 20 60 120 30. Along with the Ichimoku, I like to use Bollinger Bands to not only find confluence for support and resistance but for price discovery targets and trend strength. " What Is a Bollinger Band®? A Bollinger Band® is a technical analysis tool defined by a set of trendlines plotted two standard deviations (positively and negatively) away from a simple moving average (SMA) of a security's price, but which can be adjusted to user preferences. Bollinger Bands® were developed and copyrighted by famous technical trader John Bollinger, designed to discover opportunities that give investors a higher probability of properly identifying when an asset is oversold or overbought." This article goes into great detail of the complexities of using the Bollinger band and how to use it. ======= This indicator combines all these powerful indicators into one so that it is easier to input different settings, turn specific tools on or off and can be easily customised. Indicatore Pine Script®di ShanxiaAggiornato 33347
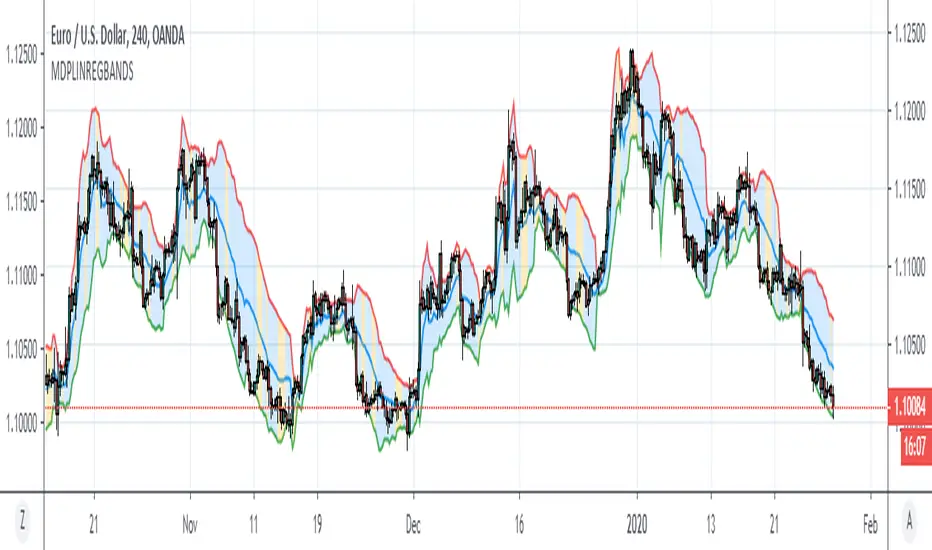
Minkowski Distance Period Linear Regression BandsHello, this script was created by using Linear Regression Bands Function with variable Function Minkowski Distance Adaptive Period. Function Linear Regression Bands : Minkowski Distance Function Original Script by RicardoSantos : Functions saved from overloads . And suitable for mutable variable periods. Regards. Indicatore Pine Script®di Noldo66137
Triangular Moving Average (TMA) bandsWhat in the world is up folks ??!?? Here's the indicator of the day. Sharing a simple one today because I'm busy coding for a few clients (fun life of a top script author on TradingView) The TMA bands is an indicator that I discovered on FXCM a few years ago FXCM TMA bands From the screenshot above, we see that when the price hits the lower band, it's a possible reverse BUY signal. When it hits the upper band, it's a possible SELL signal Methodology 1) The Take Profit 1 is the middle line, Take Profit 2 is the opposite band. 2) Once the TP1 is hit, set your Stop Loss to breakeven 3) Once the TP2 is hit, if you still want to stay in the trade, set your Stop Loss to the TP1 That's what we call a trailing stop loss which I offered in the Trade Manager : Trade-Manager-Open-Source-Version/ It will be a powerful tool in your arsenal for some scalp/intraday trades After years of coding for traders, I worked with many brokers/API/languages so I'm very used to convert a script from a broker to another one (shameless self-advertising) PS Tomorrow I'll share the Signal version of my Algorithm Builder: You'll be able to connect it in a single click to a very cool Backtest System made by the Pinescripters community In other words, I'm selling the scripts to allow you to build your own signals in a few clicks AND to connect it easily to a kick-ass backtesting tool. More to come tomorrow Hope you'll like it, like me, love it, love me, tip me :) ____________________________________________________________ Feel free to hit the thumbs up as it shows me that I'm not doing this for nothing and will motivate to deliver more quality content in the future. (Meaning... a few likes only = no indicators = Dave enjoying the beach) - I'm an officially approved PineEditor/LUA/MT4 approved mentor on codementor. You can request a coaching with me if you want and I'll teach you how to build kick-ass indicators and strategies Jump on a 1 to 1 coaching with me - You can also hire for a custom dev of your indicator/strategy/bot/chrome extension/pythonIndicatore Pine Script®di Daveatt3535 4.2 K
RSI Heat Bands [River]This script combines LazyBear's RSI Bands with JayRoger's Bollinger Heat Bands, to give an on chart representation of the price needed to set RSI to each major level, from 20 to 80 (higher values created massive bands).Indicatore Pine Script®di rthomson22159
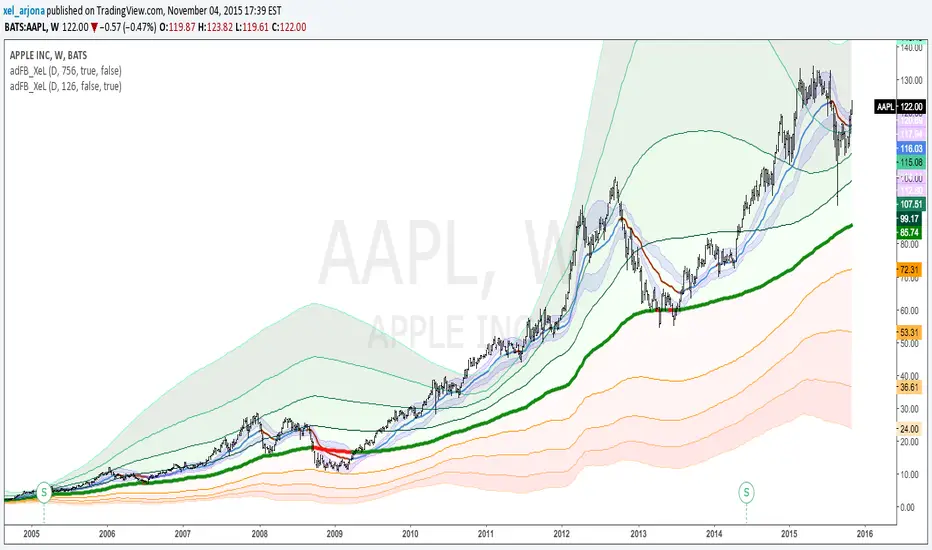
EVWMA Acc/Dist. Pressure & FRACTAL BANDS by @XeL_ArjonaEVWMA ACCUMULATION/DISTRIBUTION PRESSURE & FRACTAL BANDS Version: 3.0 @ 4.11.2015 By Ricardo M Arjona @XeL_Arjona DISCLAIMER: The following indicator IS NOT INTENDED TO BE A FORMAL INVESTMENT ADVICE OR TRADING RECOMMENDATION BY THE AUTHOR, nor should be construed as such. Users will be fully responsible by their use regarding any kind of trading vehicles or assets. The following script and ideas within this work are FREELY AND PUBLICLY availables on the Web for NON LUCRATIVE ACTIVITIES and must remain as is. -== IMPORTANT: THIS IS AN EXPERIMENTAL INDICATOR ==- What is this? This work is a derivation of my previous Accumulation/Distribution scripts publicly available in TradingView in an effort to clean, speedup and make the indicator cleaner as possible. The current indicator is based on already tested and Mathematically proof concepts as described below: The MAIN Rolling back median line or "Vortex" is constructed by a simple and equal weighting of distributed volume along the candle range (This approach is just an "estimator" of Buyers Vs. Sellers given the lack of tick resolution in TradingView, a real "DELTA" can only be 100% reliable with Market Depth (Ask/Bid ticks)), Given this, with each "volume weights", the price is post-processed against a true statistical Average calculation formerly: ELASTIC VOLUME WEIGHTED MOVING AVERAGE. The FRACTAL BANDS are just Standard Deviation's with GOLDEN RATIO as multiplier (1.618) derived one from each other within it's origin on the former "Vortex Median". The Standard Error Bands comply as the original indicator described by Jon Andersen but given the true statistical nature of EVWMA, the original LinReg line has been substituted by the former. ALL NEW IDEAS OR MODIFICATIONS to this indicator are welcome in favor to deploy a better technical tool. Any important addition to this work MUST REMAIN PUBLIC by means of CreativeCommons CC & TradingView user rules. (C) 2015 @XeL_ArjonaIndicatore Pine Script®di xel_arjona77939