FRAMA Channel [BigBeluga]This is a trend-following indicator that utilizes the Fractal Adaptive Moving Average (FRAMA) to create a dynamic channel around the price. The FRAMA Channel helps identify uptrends, downtrends, and ranging markets by examining the relationship between the price and the channel's boundaries. It also marks trend changes with arrows, optionally displaying either price values or average volume at these key points.
🔵 IDEA
The core idea behind the FRAMA Channel indicator is to use the fractal nature of markets to adapt to different market conditions. By creating a channel around the FRAMA line, it not only tracks price trends but also adapts its sensitivity based on market volatility. When the price crosses the upper or lower bands of the channel, it signals a potential shift in trend direction. If the price remains within the channel and crosses over the upper or lower bands without a breakout, the market is likely in a ranging phase with low momentum. This adaptive approach makes the FRAMA Channel effective in both trending and ranging market environments.
🔵 KEY FEATURES & USAGE
◉ Dynamic FRAMA Channel with Trend Signals:
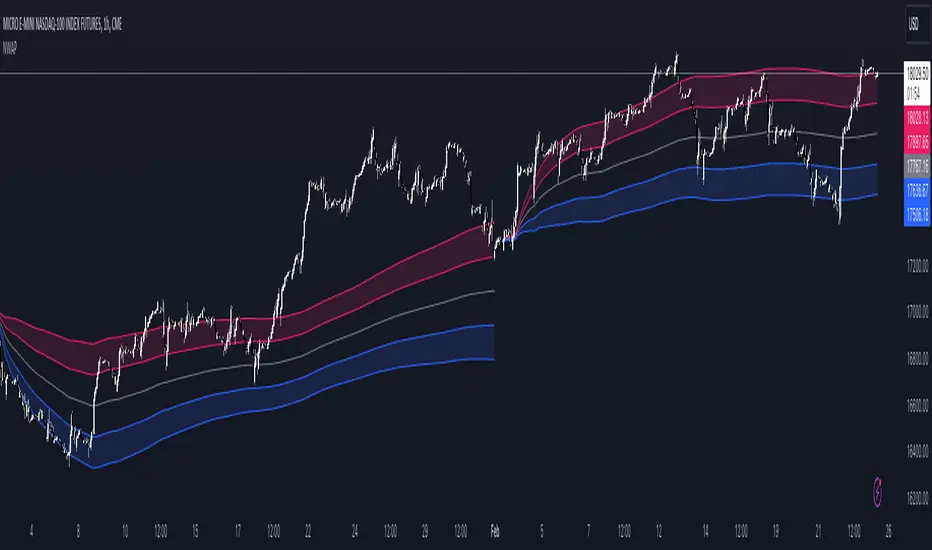
The FRAMA Channel uses a fractal-based moving average to create an adaptive channel around the price. When the price crosses above the upper band, it signals an uptrend and plots an upward arrow with the price (or average volume) value. Conversely, when the price crosses below the lower band, it signals a downtrend and marks the point with a downward arrow. This dynamic adaptation to market conditions helps traders identify key trend shifts effectively.
◉ Ranging Market Detection:
If the price remains within the channel, and only the high crosses the upper band or the low crosses the lower band, the indicator identifies a ranging market with low momentum. In this case, the channel turns gray, signaling a neutral trend. This is particularly useful for avoiding false signals during periods of market consolidation.
◉ Color-Coded Candles and Channel Bands:
Candles and channel bands are color-coded to reflect the current trend direction. Green indicates an upward trend, blue shows a downward trend, and gray signals a neutral or ranging market. This visual representation makes it easy to identify the market condition at a glance, helping traders make informed decisions quickly.
◉ Customizable Display of Price or Average Volume:
On trend change signals, the indicator allows users to choose whether to display the price at the point of trend change or the average volume of 10 bars. This flexibility enables traders to focus on the information that is most relevant to their strategy, whether it's the exact price entery or the volume context of the market shift. Displaying the average volume allows to see the strength of the trend change.
Price Data:
Average Volume of points:
🔵 CUSTOMIZATION
Length & Bands Distance: Adjust the length for the FRAMA calculation to control the sensitivity of the channel. A shorter length makes the channel more reactive to price changes, while a longer length smooths it out. The Bands Distance setting determines how far the bands are from the FRAMA line, helping to define the breakout and ranging conditions.
Signals Data: Choose between displaying the price or the average volume on trend change arrows. This allows traders to focus on either the exact price level of trend change or the market volume context.
Color Settings: Customize the colors for upward momentum, downward momentum, and neutral states to suit your charting preferences. You can also toggle whether to color the candles based on the momentum for a clearer visual of the trend direction.
The FRAMA Channel indicator adapts to market conditions, providing a versatile tool for identifying trends and ranging markets with clear visual cues.
Indicatore Pine Script®