Actieve Inversiones EMABBOL by EDOHEN
EMABBOL includes these indicators:
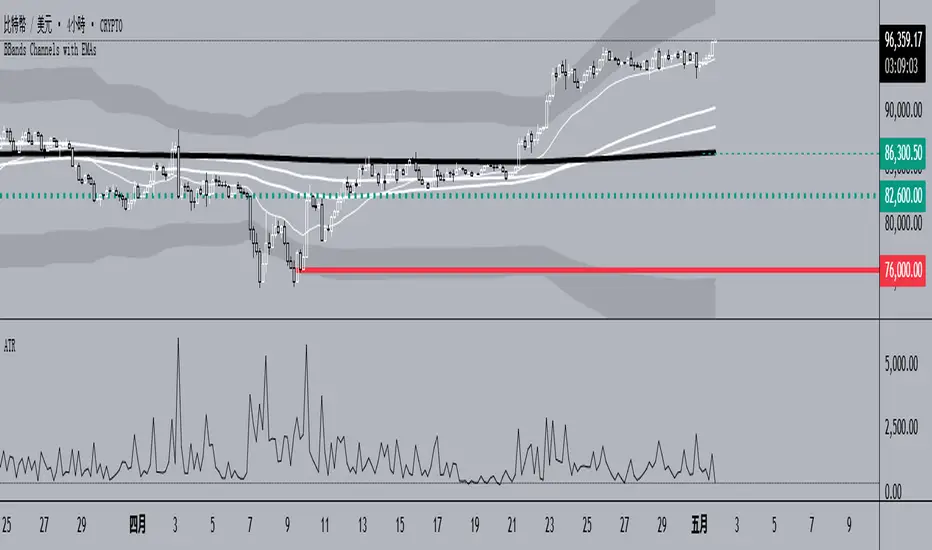
- triple emas (9,21,50)
- Bollinger Bands
- Also includes buying or selling signals
The following strategy is based on ema crosses and bollinger ma crosses, the Bollinger band gives us the target we could expect from our trades, using the upper and lower bands.
Trading criteria
Buy : Price crosses over the triple emas and also crosses under the Bollinger band ema. Looking for 3:1 PnL
Sell : Price crosses under the triple emas and also crosses under the Bollinger band ema. Looking for 3:1 PnL
Stop Loss Tips : set the SL above the crosses if Selling, below the crosses if buying
Take Profit Tips : set the TP below the Bollinger's lower Band band if Selling, or above the Bollinger's upper Band band if Buying
Indicatore Pine Script®