HTF Candle Range Box (Fixed to HTF Bars)### **Higher Timeframe Candle Range Box (HTF Box Indicator)**
This indicator visually highlights the price range of the most recently closed higher-timeframe (HTF) candle, directly on a lower-timeframe chart. It dynamically adjusts based on the user-selected HTF setting (e.g., 15-minute, 1-hour) and ensures that the box is displayed only on the bars that correspond to that specific HTF candle’s duration.
For instance, if a trader is on a **1-minute chart** with the **HTF set to 15 minutes**, the indicator will draw a box spanning exactly 15 one-minute candles, corresponding to the previous 15-minute HTF candle. The box updates only when a new HTF candle completes, ensuring that it does not change mid-formation.
---
### **How It Works:**
1. **Retrieves Higher Timeframe Data**
The script uses TradingView’s `request.security` function to pull **high, low, open, and close** values from the **previously completed HTF candle** (using ` ` to avoid repainting). It also fetches the **high and low of the candle before that** (using ` `) for comparison.
2. **Determines Breakout Behavior**
It compares the **last closed HTF candle** to the **one before it** to determine whether:
- It **broke above** the previous high.
- It **broke below** the previous low.
- It **broke both** the high and low.
- It **stayed within the previous candle’s range** (no breakout).
3. **Classifies the Candle & Assigns Color**
- **Green (Bullish)**
- Closes above the previous candle’s high.
- Breaks below the previous candle’s low but closes back inside the previous range **if it opened above** the previous high.
- **Red (Bearish)**
- Closes below the previous candle’s low.
- Breaks above the previous candle’s high but closes back inside the previous range **if it opened below** the previous low.
- **Orange (Neutral/Indecisive)**
- Stays within the previous candle’s range.
- Breaks both the high and low but closes inside the previous range without a clear bias.
4. **Box Placement on the Lower Timeframe**
- The script tracks the **bar index** where each HTF candle starts on the lower timeframe (e.g., every 15 bars on a 1-minute chart if HTF = 15 minutes).
- It **only displays the box on those bars**, ensuring that the range is accurately reflected for that time period.
- The box **resets and updates** only when a new HTF candle completes.
---
### **Key Features & Advantages:**
✅ **Clear Higher Timeframe Context:**
- The indicator provides a structured way to analyze HTF price action while trading in a lower timeframe.
- It helps traders identify **HTF support and resistance zones**, potential **breakouts**, and **failed breakouts**.
✅ **Fixed Box Display (No Mid-Candle Repainting):**
- The box is drawn **only after the HTF candle closes**, avoiding misleading fluctuations.
- Unlike other indicators that update live, this one ensures the trader is looking at **confirmed data** only.
✅ **Flexible Timeframe Selection:**
- The user can set **any HTF resolution** (e.g., 5min, 15min, 1hr, 4hr), making it adaptable for different strategies.
✅ **Dynamic Color Coding for Quick Analysis:**
- The **color of the box reflects the market sentiment**, making it easier to spot trends, reversals, and fake-outs.
✅ **No Clutter – Only Applies to the Relevant Bars:**
- Instead of spanning across the whole chart, the range box is **only visible on the bars belonging to the last HTF period**, keeping the chart clean and focused.
---
### **Example Use Case:**
💡 Imagine a trader is scalping on the **1-minute chart** but wants to factor in **HTF 15-minute structure** to avoid getting caught in bad trades. With this indicator:
- They can see whether the last **15-minute candle** was bullish, bearish, or indecisive.
- If it was **bullish (green)**, they may look for **buying opportunities** at lower timeframes.
- If it was **bearish (red)**, they might anticipate **a potential pullback or continuation down**.
- If the **HTF candle failed to break out**, they know the market is **ranging**, avoiding unnecessary trades.
---
### **Final Thoughts:**
This indicator is a **powerful addition for traders who combine multiple timeframes** in their analysis. It provides a **clean and structured way to track HTF price movements** without cluttering the chart or requiring constant manual switching between timeframes. Whether used for **intraday trading, swing trading, or scalping**, it adds an extra layer of confirmation for trade entries and exits.
🔹 **Best for traders who:**
- Want **HTF structure awareness while trading lower timeframes**.
- Need **confirmation of breakouts, failed breakouts, or indecision zones**.
- Prefer a **non-repainting tool that only updates after confirmed HTF closes**.
Let me know if you want any adjustments or additional features! 🚀
Cerca negli script per "bar"

WD Gann: Vertical Lines for Predefined Days/Bars AgoThis Pine Script draws vertical lines on the chart at specific time intervals, inspired by WD Gann’s theories of time cycles . WD Gann, a famous trader, believed that market movements were influenced by predictable time cycles. This script enables traders to visualize these key time cycles on the chart by placing vertical lines at predefined intervals (in bars ago), helping to identify potential turning points in the market.
The time intervals used in this script are inspired by Gann’s work, as well as astrological and numerological principles , which many traders believe influence market behavior . You can customize which time intervals (such as 3, 7, 9, 21, etc.) you want to track by enabling or disabling specific vertical lines on the chart.
Key Features:
Time Cycles Based on Gann’s Theory: Draws vertical lines at significant time intervals such as 3, 7, 9, 21, 27 bars ago, which are commonly used by Gann traders.
Astrological & Numerological Significance: The predefined intervals also align with key numerological and astrological values, allowing for a broader perspective on market cycles.
Customizable Intervals: You can choose which time intervals to display by enabling or disabling checkboxes for each cycle, allowing flexibility in chart analysis.
Visual Labels: Each vertical line is labeled with its corresponding "bars ago" value, providing clear reference points for the selected time cycles.
What Users Can Do:
Track and analyze market movements based on time cycles that are significant to Gann’s theory, as well as numerological and astrological influences.
Enable or disable vertical lines for specific cycles, like the 3-bar cycle, 9-bar cycle, or 365-bar cycle, depending on the intervals that align with your trading strategy.
Combine with other technical analysis tools and Gann techniques (e.g., Gann Angles, Gann Fans, or Square of Nine) for a more comprehensive trading approach.
This tool is designed for traders who believe in the power of time cycles to influence market behavior, and is especially useful for predicting turning points or key price movements based on these cycles.

Shark Price & Bar Prediction
### Description for TradingView
**Shark Price & Bar Prediction Indicator**
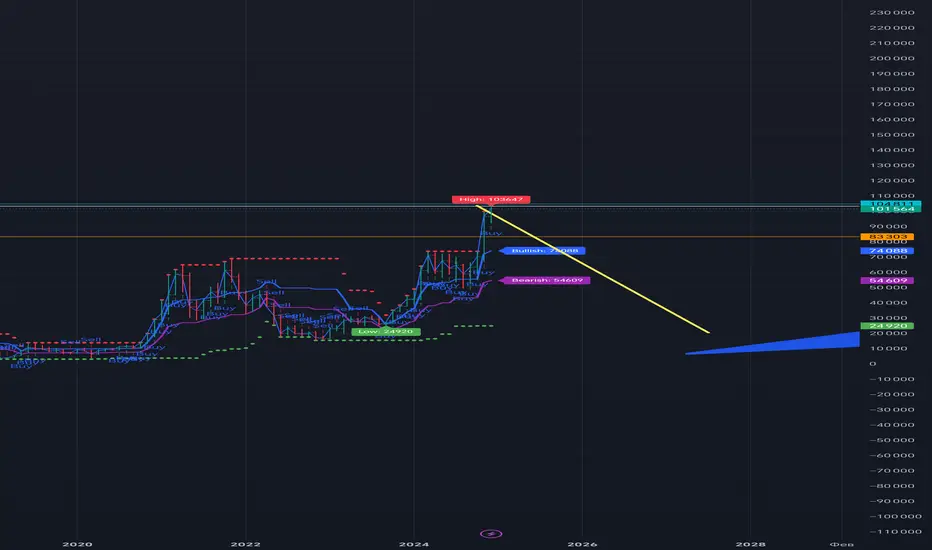
The "Shark Price & Bar Prediction" indicator is designed to provide traders with insights into potential price movements based on local extremes in price action. Utilizing Volume Spread Analysis (VSA), this script identifies key price levels and generates predictive targets for bullish and bearish trends.
#### Features:
- **Local Extremes Detection**: Automatically finds the highest and lowest points within a specified prediction period.
- **Price Prediction**: Calculates potential bullish and bearish targets using Fibonacci levels.
- **Visual Signals**: Displays buy and sell signals directly on the chart, making it easy to identify entry points.
- **Customizable Settings**: Users can adjust the prediction period and confidence threshold to suit their trading style.
### How to Use:
1. **Settings**: Adjust the following inputs according to your preferences:
- **Prediction Period**: Set the number of bars to look back for local extremes.
- **Confidence Threshold**: Define the confidence level for predicting price targets.
- **Show Additional Labels**: Toggle additional labels for more detailed information on the chart.
2. **Interpreting Signals**:
- **Buy Signal**: When the closing price exceeds the bullish target, an upward arrow will appear below the bar, indicating a potential buying opportunity.
- **Sell Signal**: When the closing price falls below the bearish target, a downward arrow will appear above the bar, suggesting a potential selling opportunity.
3. **Visual Indicators**:
- The highest point is marked with a 🔴 **red circle**, while the lowest point is marked with a 🟢 **green circle**.
- Bullish targets are represented by a 🔵 **blue line**, and bearish targets are represented by a 🟣 **purple line**.
### Объяснение на русском
**Индикатор Прогнозирования Цены и Баров Shark**
Индикатор "Shark Price & Bar Prediction" предназначен для предоставления трейдерам информации о потенциальных ценовых движениях на основе локальных экстремумов в ценовом действии. Используя анализ объема и спреда (VSA), этот скрипт определяет ключевые уровни цен и генерирует прогнозные цели для бычьих и медвежьих трендов.
#### Особенности:
- **Обнаружение Локальных Экстремумов**: Автоматически находит максимальные и минимальные точки в заданный период прогнозирования.
- **Прогнозирование Цены**: Вычисляет потенциальные бычьи и медвежьи цели с использованием уровней Фибоначчи.
- **Визуальные Сигналы**: Отображает сигналы покупки и продажи непосредственно на графике, что облегчает определение точек входа.
- **Настраиваемые Параметры**: Пользователи могут регулировать период прогнозирования и уровень уверенности в соответствии со своим стилем торговли.
### Как использовать:
1. **Настройки**: Отрегулируйте следующие параметры в соответствии с вашими предпочтениями:
- **Период Прогнозирования**: Установите количество баров для поиска локальных экстремумов.
- **Порог Уверенности**: Определите уровень уверенности для прогнозирования ценовых целей.
- **Показать Дополнительные Метки**: Включите дополнительные метки для более детальной информации на графике.
2. **Интерпретация Сигналов**:
- **Сигнал Покупки**: Когда цена закрытия превышает бычью цель, под баром появится стрелка вверх, указывающая на потенциальную возможность покупки.
- **Сигнал Продажи**: Когда цена закрытия падает ниже медвежьей цели, над баром появится стрелка вниз, предлагающая потенциальную возможность продажи.
3. **Визуальные Индикаторы**:
- Максимальная точка обозначена 🔴 **красным кругом**, а минимальная точка — 🟢 **зеленым кругом**.
- Бычьи цели представлены 🔵 **синей линией**, а медвежьи цели — 🟣 **пурпурной линией**.
The Bar Counter Trend Reversal Strategy [TradeDots]Overview
The Bar Counter Trend Reversal Strategy is designed to identify potential counter-trend reversal points in the market after a series of consecutive rising or falling bars.
By analyzing price movements in conjunction with optional volume confirmation and channel bands (Bollinger Bands or Keltner Channels), this strategy aims to detect overbought or oversold conditions where a trend reversal may occur.
🔹How it Works
Consecutive Price Movements
Rising Bars: The strategy detects when there are a specified number of consecutive rising bars (No. of Rises).
Falling Bars: Similarly, it identifies a specified number of consecutive falling bars (No. of Falls).
Volume Confirmation (Optional)
When enabled, the strategy checks for increasing volume during the consecutive price movements, adding an extra layer of confirmation to the potential reversal signal.
Channel Confirmation (Optional)
Channel Type: Choose between Bollinger Bands ("BB") or Keltner Channels ("KC").
Channel Interaction: The strategy checks if the price interacts with the upper or lower channel lines: For short signals, it looks for price moving above the upper channel line. For long signals, it looks for price moving below the lower channel line.
Customization:
No. of Rises/Falls: Set the number of consecutive bars required to trigger a signal.
Volume Confirmation: Enable or disable volume as a confirmation factor.
Channel Confirmation: Enable or disable channel bands as a confirmation factor.
Channel Settings: Adjust the length and multiplier for the Bollinger Bands or Keltner Channels.
Visual Indicators:
Entry Signals: Triangles plotted on the chart indicate potential entry points:
Green upward triangle for long entries.
Red downward triangle for short entries.
Channel Bands: The upper and lower bands are plotted for visual reference.
Strategy Parameters:
Initial Capital: $10,000.
Position Sizing: 80% of equity per trade.
Commission: 0.01% per trade to simulate realistic trading costs.
🔹Usage
Set up the number of Rises/Falls and choose whether if you want to use channel indicators and volume as the confirmation.
Monitor the chart for triangles indicating potential entry points.
Consider the context of the overall market trend and other technical factors.
Backtesting and Optimization:
Use TradingView's Strategy Tester to evaluate performance.
Adjust parameters to optimize results for different market conditions.
🔹 Considerations and Recommendations
Risk Management:
The strategy does not include built-in stop-loss or take-profit levels. It's recommended to implement your own risk management techniques.
Market Conditions:
Performance may vary in different market environments. Testing and adjustments are advised when applying the strategy to new instruments or timeframes.
No Guarantee of Future Results:
Past performance is not indicative of future results. Always perform due diligence and consider the risks involved in trading.

ka66: Bar Range BandsThis tool takes a bar's range, and reflects it above the high and below the low of that bar, drawing upper and lower bands around the bar. Repeated for each bar. There's an option to then multiply that range by some multiple. Use a value greater than 1 to get wider bands, and less than one to get narrower bands.
This tool stems out of my frustration from the use of dynamic bands (like Keltner Channels, or Bollinger Bands), in particular for estimating take profit points.
Dynamic bands work great for entries and stop loss, but their dynamism is less useful for a future event like taking profit, in my experience. We can use a smaller multiple, but then we can often lose out on a bigger chunk of gains unnecessarily.
The inspiration for this came from a friend explaining an ICT/SMC concept around estimating the magnitude of a trend, by calculating the Asian Session Range, and reflecting it above or below on to the New York and London sessions. He described this as standard deviation of the Asian Range, where the range can thus be multiplied by some multiple for a wider or narrower deviation.
This, in turn, also reminded me of the Measured Move concept in Technical Analysis. We then consider that the market is fractal in nature, and this is why patterns persist in most timeframes. Traders exist across the spectrum of timeframes. Thus, a single bar on a timeframe, is made up of multiple bars on a lower timeframe . In other words, when we reflect a bar's range above or below itself, in the event that in a lower timeframe, that bar fit a pattern whose take profit target could be estimated via a Measured Move , then the band's value becomes a more valid estimate of a take profit point .
Yet another way to think about it, by way of the fractal nature above, is that it is essentially a simplified dynamic support and resistance mechanism , even simpler than say the various Pivot calculations (e.g. Classical, Camarilla, etc.).
This tool in general, can also be used by those who manually backtest setups (and certainly can be used in an automated setting too!). It is a research tool in that regard, applicable to various setups.
One of the pitfalls of manual backtesting is that it requires more discipline to really determine an exit point, because it's easy to say "oh, I'll know more or less where to exit when I go live, I just want to see that the entry tends to work". From experience, this is a bad idea, because our mind subconsciously knows that we haven't got a trained reflex on where to exit. The setup may be decent, but without an exit point, we will never have truly embraced and internalised trading it. Again, I speak from experience!
Thus, to use this to research take profit/exit points:
Have a setup in mind, with all the entry rules.
Plot your setup's indicators, mark your signals.
Use this indicator to get an idea of where to exit after taking an entry based on your signal.
Credits:
@ICT_ID for providing the idea of using ranges to estimate how far a trend move might go, in particular he used the Asian Range projected on to the London and New York market sessions.
All the technicians who came up with the idea of the Measured Move.

Bearish 3 Bars Reversal PatternThis TradingView Pine Script indicator identifies and highlights a bearish 3-bar reversal pattern on your chart. The script also calculates the percentage difference between the current low and the previous high, displaying this value on the chart when the pattern is detected.
Features:
Pattern Detection:
The script detects a bearish 3-bar reversal pattern when the high of the previous bar is higher than the high of the bar before it, and the current high is lower than the previous high.
Percentage Difference Calculation:
When the pattern is detected, the script calculates the percentage difference between the current low and the previous high. This percentage is displayed on the chart.
Visual Indicators:
When a bearish 3-bar reversal pattern is detected, a label is created on the chart showing the calculated percentage difference. The label is styled with a downward arrow, red color, and white text for clear visibility.
Alerts:
An alert condition is set up to notify users when the bearish 3-bar reversal pattern is detected. This allows traders to take timely action based on the pattern.

Bullish 3 Bars Reversal PatternThis TradingView Pine Script indicator identifies and highlights a bullish 3-bar reversal pattern on your chart. The script also calculates the percentage difference between the current high and the previous low, displaying this value on the chart when the pattern is detected.
Features:
Pattern Detection:
The script detects a bullish 3-bar reversal pattern when the low of the previous bar is lower than the low of the bar before it, and the current low is higher than the previous low.
Percentage Difference Calculation:
When the pattern is detected, the script calculates the percentage difference between the current high and the previous low. This percentage is displayed on the chart.
Visual Indicators:
When a bullish 3-bar reversal pattern is detected, a label is created on the chart showing the calculated percentage difference. The label is styled with an upward arrow, green color, and white text for clear visibility.
Alerts:
An alert condition is set up to notify users when the bullish 3-bar reversal pattern is detected. This allows traders to take timely action based on the pattern.

Zig Zag/Consecutive Bars [UkutaLabs]█ OVERVIEW
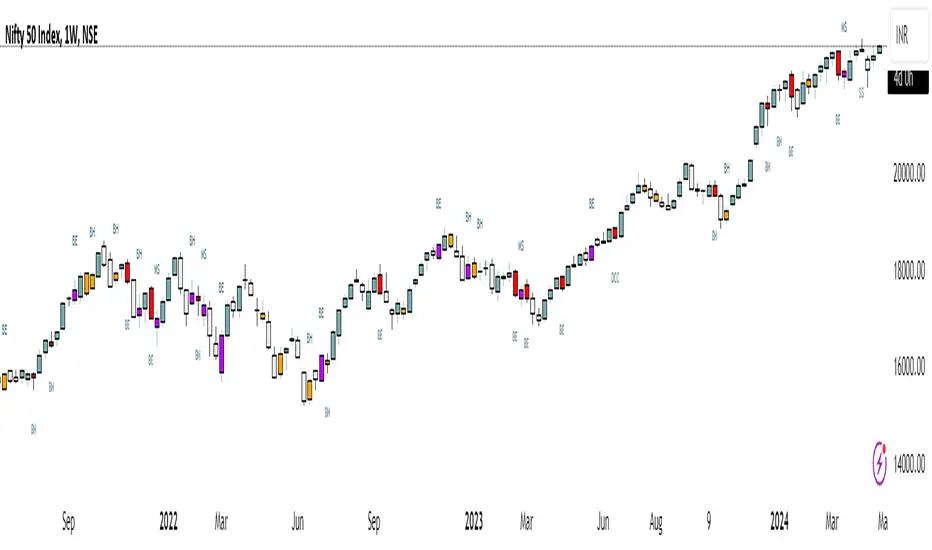
The Zig Zag/Consecutive Bars indicator is a powerful trading tool that helps to visualise the flow of the market. This indicator allows users to see at a glance when a candle closes at a new high or a new low, which can be incorporated into a variety of trading strategies to better understand points of reversal and consolidation.
This indicator also displays the RSI score of each pivot, as well as a trailing count of how many bars it has been since there was a new high/low.
█ USAGE
As each bar finishes, the script will check if it closed above or below the previous bar’s high or low, depending on the current trend direction. When a new high or low is set, the script will then look for a move in the other direction. This can be a powerful tool that can identify when the market is trending strongly, as well as identifying when the market has a weak or no trend.
At each pivot point, the RSI score is displayed. This serves as additional confirmation to how strong the trend is. The RSI labels can be turned off in the settings.
As each trend develops, the script will count and display the number of bars that have closed since the most recent pivot. These labels can be turned off in the settings.
█ SETTINGS
Configuration
• Show RSI Scores: Determines whether or not labels displaying RSI scores are drawn.
• Show Counter: Determines whether or not labels displaying the number of bars since the most recent pivot are drawn.
• Line Color: Determines the color of the Zig Zag line.

Inside Bar + Bullish and Bearish candlestick [Tarun]
Inside Bar Detection:
The function isInsideBar() checks if a bar is an inside bar, meaning its high is lower than the previous bar's high and its low is higher than the previous bar's low.
Inside bars are highlighted with an orange color.
Bearish Candlestick Patterns:
Bearish Engulfing: When the current candlestick's body completely engulfs the previous candlestick's body.
Dark Cloud Cover: When a bullish candle is followed by a bearish candle that opens above the previous bullish candle's close but closes below its midpoint.
Bearish Harami: When a small bullish candlestick is engulfed by a larger bearish candlestick.
Evening Star: A three-candle pattern consisting of a large bullish candle, a small-bodied candle with a gap up or down, and a large bearish candle that closes below the midpoint of the first candle.
Shooting Star: A single candlestick pattern with a small real body near the bottom of the price range and a long upper shadow.
Bearish Marubozu: A candlestick with a long bearish body and little to no upper or lower shadows.
Bearish candlestick patterns are highlighted with a red color and labeled with abbreviated names.
Bullish Candlestick Patterns:
Bullish Engulfing: Opposite of bearish engulfing, where the current candlestick's body completely engulfs the previous candlestick's body.
Piercing Pattern: When a bearish candle is followed by a bullish candle that opens below the previous bearish candle's low but closes above its midpoint.
Bullish Harami: Similar to bearish harami but bullish, where a small bearish candlestick is engulfed by a larger bullish candlestick.
Morning Star: A three-candle pattern opposite to the evening star, signaling a potential reversal from downtrend to uptrend.
Bullish Hammer: A single candlestick pattern with a small real body near the top of the price range and a long lower shadow.
Bullish Marubozu: A candlestick with a long bullish body and little to no upper or lower shadows.
Bullish candlestick patterns are highlighted with a purple color and labeled with abbreviated names.
Inside Bar by TarunInside bars occur when the current bar's high is lower than the previous bar's high and the current bar's low is higher than the previous bar's low. The script changes the color of inside bars to orange for better visualization.

Trend Bar Dow Theory V-1.0The indicator is designed to signal the presence of a trend bar with reduced profit-taking the following day. Below, I explain the logic that I have defined for this first version.
The guidelines I provided are as follows: We identify a trend bar, if it sets a market change, between opening and closing, equal to or greater than 50 pips . This first guideline is used to find a day with good liquidity , which usually leads to a trend bar.
If the first guideline is met, the indicator should change the bar color to white . This way, we can proceed to the second guideline, to detect the presence of reduced profit-taking.
The second guideline should indicate the presence of reduced profit-taking, as explained by Dow Theory, to find a trend context with potential to exploit. Therefore, the second guideline involves coloring the bars near the trend bars in grey, if they have a range equal to or less than 30 pips.
Dow Theory states that a market in trend measures reduced profit-taking, within 33%, up to a maximum of 50% compared to the previous trend bar, but I have not yet been able to make Pine Script calculate the percentage value. If you have any suggestions, I would be grateful.

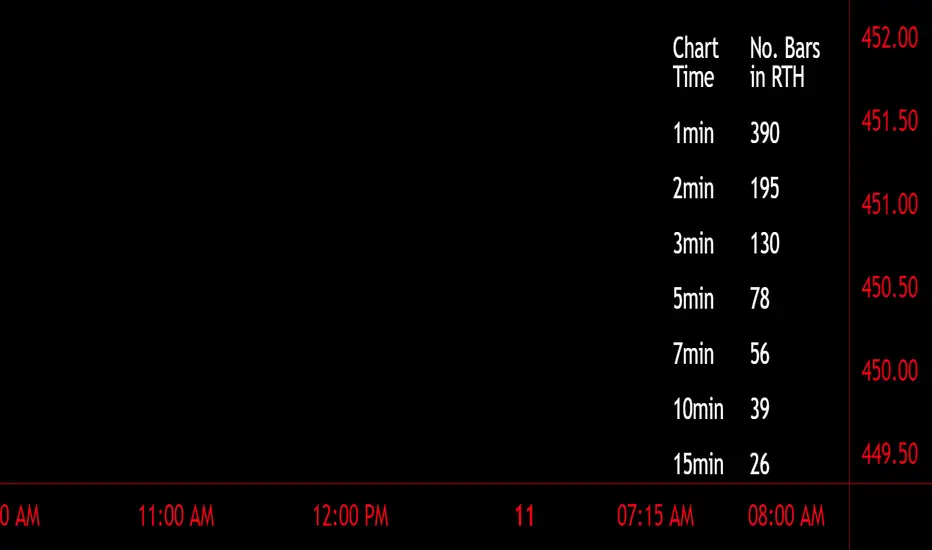
Number of Bars CheatSheetA regular trading day on the New York Stock Exchange (NYSE) consists of two main sessions: the Opening Auction and the Closing Auction, separated by a continuous trading session. Here's a breakdown of the trading day:
1. **Pre-Opening Session**: This session starts at 4:00 AM Eastern Time (ET) and lasts until 9:30 AM ET. During this time, there is limited trading activity, and orders can be entered and canceled. However, most of the trading activity doesn't occur until the regular trading session begins.
2. **Regular Trading Session**: The regular trading session on the NYSE starts at 9:30 AM ET and lasts until 4:00 PM ET. This is the primary trading session where the majority of price bars are formed.
3. **Closing Auction**: After the regular trading session ends at 4:00 PM ET, there is a closing auction period that typically lasts until 4:10 PM ET. During this time, there is a final price discovery process where orders are matched to determine the closing price for each security.
So, during the regular trading session, which is the main focus for most traders and investors, there are a total of 6.5 hours of trading. Trading occurs continuously during this time, with price bars being formed based on the time frame you're looking at. The most common time frames for price bars are one minute, five minutes, 15 minutes, 30 minutes, and one hour, among others. Therefore, the number of price bars in a regular trading day on the NYSE will depend on the time frame you are using for your analysis. For example, if you are using one-minute bars, there will be 6.5 x 60 = 390 price bars in a regular trading day.
See inside Candles: Directionality %; Constituent Bars & GapsSee inside candles based on user-input LTF setting: get data on 'Directionality' of your candle; Gaps (total and Sum; UP and DOWN); Number of Bull or Bear constituent candles
//Features:
-DIRECTIONALITY: compare length of the 'zig-zag' random walk of lower time frame constituent candles, to the full height of the current candle. Resulting % I refer to as 'directionality'.
-GAPs: what i refer to as 'gaps' are also known as Volume imbalances: the gap between previous candles close and current candle's open (if there is one).
--Gaps total (up vs down gaps). Number of Up gaps printed above bar in green, down gaps printed below bar in red.
--Gaps Sum (total summed UP gap, total summed down gaps. Sum of Up gaps printed above bar in green, Sum of down gaps printed below bar in red.
-Candles Total: Numer of LTF up vs down candles within current timeframe candle. Number of up candles printed above bar in green, Number of down candles printed below bar in red.
//USAGE:
-Primary purpose in this was the Directionality aspect. Wanted to get a measure of how choppy vs how directional the internals of a candle were. Idea being that a candle with high % directionality (approaching 100) would imply trending conditions; while a candle which was large range and full bodies but had a low % directionality would imply the internals were back-and-forth and => rebalanced, potentially indicating price may not need to retrace back into it and rebalance further. All rather experimental, please treat it as such: have a play around with it.
-Number of gaps, Sums of up and down gaps, ratio of up and down constituent candles also intended to serve a similar purpose as the above.
-Set the input lower timeframe; this must obviously be lower then your current timeframe. You will significant differences in results depending on the ratio your timeframes (chart timeframe vs user-input timeframe).
//User Inputs:
-Lower timeframe input (setting child candle size within current chart parent candle).
-Choose function from the four listed above.
-typical formating options: Bull color/bear color txt for gaps functions.
-display % unit or not.
-display vertical or horizontal text.
-Set min / max directionality thresholds; and color code results.
-Toggle on/off 'hide results outside of threshold' to declutter the chart.
-choose label style.
//NOTES:
-Directionality thresholds can be set manually; Max and Min thresholds can be set to filter out 'non-extreme' readings.
-Note that directionality % can sometimes exceed 100%, in cases where price trends very strongly and gaps up continuously such that sum of constituent candles is less than total range of parent candle.
-Personally i like the idea of seeking bold, large-range, full bodied candles, with a lower than typical directionality %; indicating that a price move is both significant and it's already done it's rebalancing; I would see this as potentially favourable for continuation (obviously depending on context).
---- Showcase of the other functions beyond Directionality percentage ----
Candles Total (bull vs Bear). ES1! Hourly; ltf = 5min: Candles total: LTF up candles and LTF down candles making up the current HTF candle (constituent number of UP candles printed above in green, Down candles printed below in red):
Gaps SUM. SPX hourly, ltf = 5min. Sum of 'UP' gaps within candle printed above in green, sum of 'DOWN' gaps printed below in red:
Gaps TOTAL: SPX hourly, ltf = 1min. Simply the total of 'up' gaps vs 'down' gaps withing our candle; based on the user input constituent candles within:

Big Bars DetectorIf a big bar with high volume appears during an uptrend, this may indicate strong buying pressure i.e. the bar acts as support. vice versa, if a big bar with high volume appears during a downtrend i.e. the bar acts as resistance.
How to use ?
It is easy to use whenever the label appears on the candle's high (make sure the candle's color is Red for a bear candle, for example). If a Green bar has a label on its low, simply use the candle's low as support, and vice versa. If the candle's high has a label, consider using it as resistance.
The values display in labels on the top / bottom of the bar is the volume on that particular candle
Hope you like and help in your trading !!!
if any have question / suggestion comment below or just message me.
Thanks and Regards,
TradingTail

Three Bar Gap (Simple Price Action - with 1 line plot)This script is tailored towards experienced traders who prefer to view raw price charts during live execution. It searches for a three-bar pattern of what is colloquially called "fair value gap", or "imbalance" and uses a single line to plot the results. The goal is to display price in a way that is as simple as possible so that chart readers who don't prefer to add indicators on their screen will still find this indicator as an acceptable option to consider for.
From a code perspective, this script explores a new PineScript feature called UDT (user-defined types). This is an incredible update because it brings developers one step close to having the ability to create abstract data types.
█ What is price action?
Experienced traders will tell you that the chart that they use for live execution is raw, clean, and uses no indicators. They say they execute on price action, so what exactly is price action?
There is no formal definition to it, but one can agree that it implies the process of analyzing price without considering the fundamentals, without needing to know what the news was about, and without needing to know any of the Greeks (except for the desire to “seek alpha” Ha.haa...). This is not to say that price action traders are executing in their own vacuums without the need to know what is happening around the world. Surely fundamentals and financial models can be used beforehand for developing a bias for what is being traded, but it’s price-first at the moment of execution. That said, Factor (A) is Price.
Factor (B) is time-perception, it’s how the trader reads the tape. How the trader perceives price to change with respect to time is valuable information. Interpretation of "time" will be elaborated in the next section that talks about candlestick patterns detected by this script.
Putting this together, price action means the analysis of price movement by only considering (A) price, and (B) time, to predict which direction the market will move. A speculative trader is timing the market with the expectation to make a quick in-and-out profit; she/she is using price action. On the other hand, a long term investor holding a diversified portfolio with a strategy based on modern portfolio theory combined with fundamental analysis (at this point candlesticks are irrelevant) but has one additional criteria of, say, can only go Long on a stock when it has closed Green on Daily; he/she is also considered to be executing on price action.
█ Candlestick patterns
This script calculates the displacement of highs and lows over three consecutive bars.
A) Down move = When High of the recent confirmed bar is lower than the Low of the previous-previous candle
B) Up move = When Low of the recent confirmed bar is higher than the High of the previous-previous candle
(Note that its the confirmed bar that is being talked about, so it does not repaint)
An ATR filter will be applied to reduce the number of lines generated as many times they might just be associated with minor price changes.
Interpretations:
When price moves quickly across three bars, it can be thought that it has gapped. Although the candle in the middle appears to be solid, it’s not from a conceptual perspective. This is because time itself is arbitrary; timeframes don’t necessarily have to be fixed intervals. Take stocks with regular trading hours for example, if price makes a breakaway gap and you bundle the after-hours and pre-market sessions together as one candle, never minding that intervals should be fixed, then you will see the exact three-bar-gap patterns. Similar happens during intraday sessions on lower timeframes, if you zoom-in closer, you’ll see that ticks within the middle candle are sparsely dispersed. This is why it's called a gap.
█ Parameters with fixed inputs & assumptions used:
ATR is used for filtering out minor movements that will likely be deemed as irrelevant by trader for the purpose of live execution. The following inputs are required:
A) ATR lookback period
B) Multiplier
The product of ATR(len=A) and B produces a threshold for minimum distance that price must gap by. Initially, it was proposed to be only based on one ATR, but often an ATR is too wide and using it will filter out too many lines. Because of this observation, a multiplier (Parameter B) has been introduced to allow users to apply fractional ATR as a threshold.
█ Applications:
For trend followers: Follow the direction of the gap. Entering above recent high/low points above/below the first impulse with a stop-limit order is a viable tactic.
For contrarians fading a trend: The mid-point is a good point of reference for predicting potential areas of support/resistance.

Bull& Bear Bars Count/CalculatorIn bull trend, bull bars are more than bear bars and vice versa.
More important, if the bull/bear bars are more continuous, the trend is typically stronger.
So, if the bars amount is visualized, it would be much more easier to identify the unfolding trend in front of you.
This indicator shows you the amount of bull/bear bars by columns.
The higher the column, the bars are more continuous, the trend is stronger.

Position Size By Risk For Bar SizeThis simple script provides a way of calculating position size on a bar by bar basis for a fixed risk amount.
If you are trading a fixed risk amount (e.g. $100) per trade and your Entry and Stop is defined by a specific bar on the chart (any resolution e.g. 15 min, 5 min, 2 min etc) then this indicator will show you the position size you can take.
The user configures the risk amount per trade in the setting for the indicator, the default is 100 (e.g. $100).
It calculates each bar size (high - low) for the resolution of the chart that is being viewed.
The position size = (risk amount) / (bar size).
It then displays a "." (dot) for each bar and to see the position size hover your mouse over this dot .
The pane for this indicator can be set to the top of the chart by using the "Move pane up" option on the chart so that the indicator is easily accessible and discrete at the top of the chart.
Also, there is an option to use this indicator as a substitute for the built-in volume display.
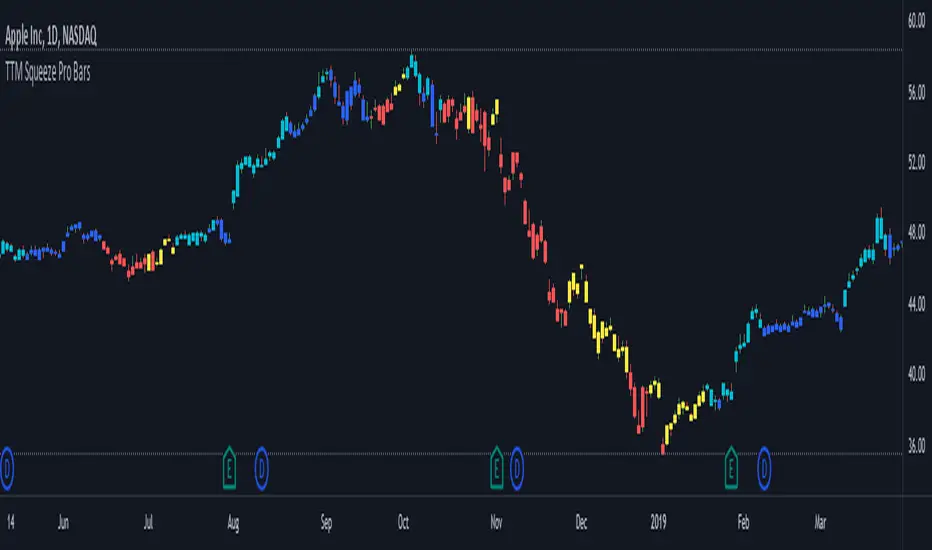
TTM Squeeze Pro BarsCredits:
-> John Carter creating the TTM Squeeze and TTM Squeeze Pro
-> Lazybear's original interpretation of the TTM Squeeze: Squeeze Momentum Indicator
-> Makit0's evolution of Lazybear's script to factor in the TTM Squeeze Pro upgrades - Squeeze PRO Arrows
This is my version of their collective works, with amendments primarily to the Squeeze Conditions to more accurately reflect the color coding used by the official TMM Squeeze Pro indicator.
Rather than having a separate indicator window, the TTM Squeeze Pro is now overlaid on the price bars for easier viewing.
For those unfamiliar with the TTM Squeeze, it is simply a visual way of seeing how Bollinger Bands (standard deviations from a simple moving average ) relate to Keltner Channels ( average true range bands) compared with the momentum of the price action. The concept is that as Bollinger Bands compress within Keltner Channels , price volatility decreases, giving way for a potential explosive price movement up or down.
Differences between the original TTM Squeeze and TTM Squeeze Pro:
-> Both use a 2 standard deviation Bollinger Band ;
-> The original squeeze only used a 1.5 ATR Keltner Channel; and
-> The pro version uses 1.0, 1.5 and 2.0 ATR Keltner Channels .
The pro version therefore helps differentiate between levels of squeeze (compression) as the Bollinger Bands moves through the Keltner Channels i.e. the greater the compression, the more potential for explosive moves - less compression means more squeezing.
The Histogram shows price momentum whereas the colored dots (along the zeroline) show where the Bollinger Bands are in relation to the Keltner Channels:
-> Cyan Bars = positive, increasing momentum;
-> Blue Bars = positive, decreasing momentum (indication of a reversal in price direction);
-> Red Bars = negative, increasing momentum;
-> Yellow Bars = negative, decreasing momentum (indication of a reversal in price direction);
-> Orange Dots = High Compression / large squeeze (One or both of the Bollinger Bands is inside the 1st (1.0 ATR) Keltner Channel);
-> Red Dots = Medium Squeeze (One or both of the Bollinger Bands is inside the 2nd (1.5 ATR) Keltner Channel);
-> Black Dots = Low compression / wide squeeze (One or both of the Bollinger Bands is inside the 3rd (2.0 ATR) Keltner Channels );
-> Green Dots = No Squeeze / Squeeze Fired (One or both of the Bollinger Bands is outside of the 3rd (2.0 ATR) Keltner Channel).
Ideal Scenario:
As the ticker enters the squeeze, black dots would warn of the beginning of a low compression squeeze. As the Bollinger bands continue to constrict within the Keltner Channels , red dots would highlight a medium compression. As the price action and momentum continues to compress an orange dot shows warning of high compression. As price action leaves the squeeze, the coloring would reverse e.g. orange to red to black to green. Any compression squeeze is considered fired at the first green dot that appears.
Note: This is an ideal progression of the different types of squeezes, however any type of squeeze (and color sequence) may appear at anytime, therefore the focus is primarily on the green dots after any type of compression.
Entry and Exit Guide:
-> John Carter recommends entering a position after at least 5 black dots or wait for 1st green dot ; and
-> Exit on second blue or yellow bar or, alternatively, remain in the position after confirming a continuing trend through a separate indicator.
Realtime Volume Bars w Market Buy/Sell/Neutral split & Mkt Delta
What is it?
A tool that shows Real-time Volume bars split into 3 components: (1) Market Buy Volume - i.e., the volume that got transacted on upticks; (2) Market Sell Volume - i.e., the volume that got transacted on downticks;
and, (3) Neutral Volume - i.e., the volume that got transacted without a change in price. (This feature can be turned off if you want normal volume bars).
Market delta (i.e., Market Buy Volume - Market Sell Volume) is also displayed above each volume bar. (On by default; can be switched off from Settings)
The split and Market Delta data are ONLY AVAILABLE FOR REAL-TIME BARS. Historical bars are shown just like regular ones. The dotted line marks the start of real-time data (i.e., the bar from which the indicator started collecting and displaying data). You will see accurate data for bars to the right of this line. The longer you keep a chart open with the study enabled, the more data it collects and displays, and the better your analysis can potentially be.
Note that the data gets reset every time any of the options is changed, the market is switched, the browser is refreshed, or the script is reloaded
DATA ISN'T STORED. I.e., every time a new symbol is loaded, the previous symbol's data is lost. So if you intend to monitor a symbol, you would need to keep it loaded all the time.
Who is it for?
For traders who are used to analyzing buy/sell activity using market buy/sell volume and market delta information
Although you can use this independently as well, use it in conjunction with "Market Delta Volume for Realtime Bars" indicator to get a better visual representation of the numbers.

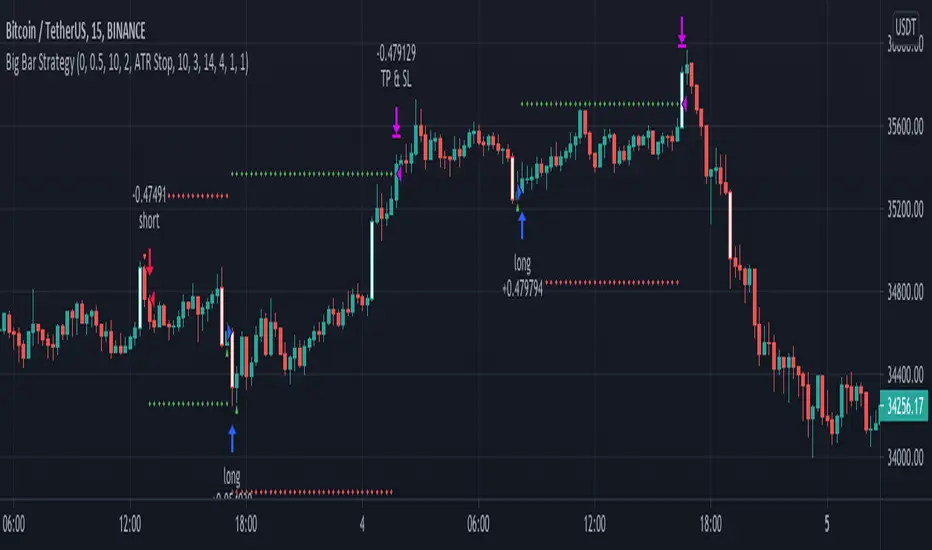
Big Bar Strategy// This strategy detects and uses big bars to enter a position. When the Big Bar
// is bearish (red candle) the position will be long and viceversa
// for short positions. The stop loss (optional) is placed on the low of the
// candle used to trigger the position and user inputs allow you to modify the
// size of the SL. Take profit is placed on a reward ratio of 1. User can also modify
// the size of the bar body used to determine if we have a real Big Bar and
// filter out Doji bars. Big Bars are determined relative to the previous X period size,
// which can also be modified, as well as the required size of the Big Bar relative to this period average.
Humble Bars Possible Correction ZonesPossible correction zones are calculated based on Humble Bars. Please check Humble Bars and Humble Bars Convergence Divergence indicators for more info.
Note that, these are meant to be correction zones, not turning points. If you take those as entry signals, you should remember, you are probably going against the trend.
Humble Bars
Humble Bars Convergence Divergence

[blackcat] L1 Close Histogram OscillatorLevel: 1
Background
A histogram is a special chart that is applied to statistical data that is divided into numerically ordered groups. For example groups with close relationships in the vicinity like "Close-ref(Close ,1)", "Close-ref(Close,2)" and so on. A histogram provides a snapshot of all the data so that you can quickly get an overview of the historical data, especially its general shape.In a histogram, the bars are linked - in contrast to a bar chart for categorical data, in which the bars represent categories that are in no particular order and are separated. The height of each bar in a histogram indicates either the number of individuals (called the frequency) in each group or the percentage of individuals (the relative frequency) in each group. Each individual in the data set falls into exactly one bar.
Function
L2 Close Histogram Oscillator is a novel overbought and oversold indicator that estimate the trend state by counting a specific bar relationship nearby. Once nearby bars reach consensus, it may spread to global quickly. The reason why I got this inspiration is because I have been engaged in the research of blockchain consensus mechanism. The market is a complex system, and its consensus depends on the common human characteristics: greed and fear. The trend of the market often also conforms to sociological characteristics. Maybe it's a bit complicated for me to say that. However, if you understand the principle of the spread of rumors and viruses, you can understand the situation where some individuals in the market have local consensus and gradually spread to the overall situation. This is the process of trend formation.
Key Signal
fastcounter --> fast close histogram counters
slowcounter --> slow close histogram counters
attention --> bottom price appears, with height of 10 in white
readybuy --> a small position buy opportunity after first bottom detected, with height of 20 in yellow
buylow --> a small position buy at low price, with height of 30 in lime
longentry --> a confirmed long entry signal by close histogram counter, with height of 40 in green
risk --> oscillator top is reached and trend reversal may happen, with height drop from 100 to 80 in red
Pros and Cons
Pros:
1. since this is based on consensus formation principle, i think this is a leading indicator by spreading local consensus to global
2. it is an oscillator, overbought and oversold can be easily observed.
Cons:
1. the model is not complex enough to depict market behavior exactly.
2. sideways and chop market will make this indicator's output hard to read.
Remarks
This is rare! I combined my previous theory of developing cellular automata with the market to produce such a weird indicator. I hope to inspire everyone and study market behavior in a deeper level.
Readme
In real life, I am a prolific inventor. I have successfully applied for more than 60 international and regional patents in the past 12 years. But in the past two years or so, I have tried to transfer my creativity to the development of trading strategies. Tradingview is the ideal platform for me. I am selecting and contributing some of the hundreds of scripts to publish in Tradingview community. Welcome everyone to interact with me to discuss these interesting pine scripts.
The scripts posted are categorized into 5 levels according to my efforts or manhours put into these works.
Level 1 : interesting script snippets or distinctive improvement from classic indicators or strategy. Level 1 scripts can usually appear in more complex indicators as a function module or element.
Level 2 : composite indicator/strategy. By selecting or combining several independent or dependent functions or sub indicators in proper way, the composite script exhibits a resonance phenomenon which can filter out noise or fake trading signal to enhance trading confidence level.
Level 3 : comprehensive indicator/strategy. They are simple trading systems based on my strategies. They are commonly containing several or all of entry signal, close signal, stop loss, take profit, re-entry, risk management, and position sizing techniques. Even some interesting fundamental and mass psychological aspects are incorporated.
Level 4 : script snippets or functions that do not disclose source code. Interesting element that can reveal market laws and work as raw material for indicators and strategies. If you find Level 1~2 scripts are helpful, Level 4 is a private version that took me far more efforts to develop.
Level 5 : indicator/strategy that do not disclose source code. private version of Level 3 script with my accumulated script processing skills or a large number of custom functions. I had a private function library built in past two years. Level 5 scripts use many of them to achieve private trading strategy.

Slim Ribbon Volume BarsThe Slim Ribbon Volume Bars indicator is intended to be paired with the Slim Ribbon. The Slim Ribbon is also available for free in TradingView. The Slim Ribbon Volume Bars indicator changes the color of the volume bars based on the momentum condition of the Slim Ribbon. When the Ribbons have a bullish condition, the indicator colors the volume bars green. When the Ribbons have a bearish condition, the indicator colors the volume bars red. Finally, when the Ribbons have a neutral condition, the indicator colors the volume bars gray. See below for an overview of the Slim Ribbon.
The Slim Ribbon was developed by Steve Miller. Steve Miller is a 46-year veteran stock, futures and options trader. His badge on the trading floor was his initials, “SLM” and has since gone by the nickname Slim.
The Slim Ribbon is a momentum indicator . It is composed of 3 exponential moving averages (8, 13 and 21). A bullish condition occurs when the 8 period MA is above the 13 period MA and the 13 period MA is above the 21 period MA. A bearish condition occurs when the 8 period MA is below the 13 period MA and the 13 period MA is below the 21 period MA. A neutral condition occurs when the Ribbons are not in alignment.
The Slim Ribbon also notifies you when we transition from one condition to another. A green up arrow indicates that the Slim Ribbon has shifted from a neutral condition to a bullish condition. A red down arrow indicates that the Slim Ribbon has shifted from a neutral condition to a bearish condition. A blue up arrow indicates that we have shifted from a bearish condition to a neutral condition. Lastly, a blue down arrow indicates that we have shifted from a bullish condition to a neutral condition.
We would recommend using the Slim Ribbon on a candlestick chart. Steve Miller believes in the importance of visualizing trends. As a result, we have designed the Slim Ribbon to change the color of the candlesticks based on the condition of the ribbon. When the Slim Ribbon has a bullish condition, the candlesticks will turn green. When the Slim Ribbon has a bearish condition, the candlesticks will turn red. When the Slim Ribbon has a neutral condition, the candlesticks will turn gray.
