SadLittleThings Price Compare With Offset MTF by RRBSadLittleThings Price Compare With Offset MTF by RagingRocketBull 2018
Version 1.0
This indicator lets you compare multiple assets across different timeframes, supports offsets and alpha multipliers.
Standard TradingView Compare doesn't have Offset/Timeframe/Multiplier options, hence this indicator.
Features:
- compare current asset's price with 2 custom ext OHLC sources
- plot sources as lines/bars/candles
- use offset:
- for lines - both positive/negative offsets, unlimited
- for bars/candles - only positive offsets <= 5000
- specify timeframe for each source
- uses timeframe textbox instead of input resolution dropdown to allow for 240 120 and other custom TFs
- support for timeframes in H: H, 2H, 4H etc
- show/hide sources
- colorize sources
- convert source price to 1000s, mlns, or blns using alpha multiplier
- total bars counter
Notes on using offsets:
- Max offset is defined by study max_bars_back which is limited to 5000 for free accounts. This variable specifies the number of history bars an indicator can access.
- if you see the 'internal server study error' => one of the indexes of ohlc series is out of bounds (i.e. close ) => decrease the offset <= 5000 or switch to line type
- you will be limited only by the total number of bars in history (n) +/- 1 full screen of empty bars
- you can't scroll past the beginning of history - 1 empty screen and past the end of history + 1 empty screen to be able to still see the line with applied offset
- before applying a large offset, scroll back long enough to make sure you have enough history loaded
- if you have a long history the indicator will get slower, its UI less responsive. Reloading the page may fix that.
- you will not see source's history past the beginning of the current asset - open the chart with the longest history first (i.e. BLX, not COINBASE)
- Make sure that the Left Price Scale shows up with Auto Fit Data enabled. You can reattach the indicator to a different scale in Style.
- you may not be able to plot intraday TFs < current TF, because free accounts are limited to TFs >= D1 (i.e. D, 2D, 3D, W), but you can still plot, say, H4+ on a lower TF H1 chart
1. uses plot*, security, change
Cerca negli script per "bar"

Two Bar Break Line Alerts R1.0 by JustUncleLThis indicator with default settings is designed for BINARY OPTIONS trading. The indicator can also be used for Forex trading with some setting changes. The script shows Two Bar Pullback Break lines and alerts when those Break lines are Touched (broken) creating a short term momentum entry condition.
For a Bullish Break (Green Up Arrow) to occur: first must have two (or three) consecutive bear (red) candles which is followed by a bull (green) candle creating a pivot point. The breakout occurs then the High of the current Bull (green) exceeds the highest point of the previous two (or three) pivotal bear candles. The green channel Line shows where the current Bullish BreakOut occurs.
For a Bearish Break (Red Down Arrow) to occur: first must have two (or three) consecutive bull (green) candles which is followed by a bear (red) candle creating a pivot point. The breakout occurs when the Low of the current Bear (red) drops below the lowest point of the previous two (or three) pivotal Bull candles. The red channel Line shows where the current Bearish BreakOut occurs.
The break Line Arrows can optionally be filtered by the Coloured MA (enabled by default), a longer term directional MA (disabled by default) and/or a MACD condition (enabled by default) as a momentum filter.
You can optionally select three Bar break lines instead of two. The three bar break lines are actually equivalent to Guppy's Three Bar Count Back Line method for trade entries (see Guppy's video reference below).
Included in this indicator is an ability to display some basic Binary Option statistics, when enabled (enabled by default) it shows Successful Bars in Yellow and failed Bars in Black and the last Nine numbers on the script title line represent the Binary option Statistics in order:
%ITM rate
Total orders
Successful Orders
Failed Orders
Total candles tested
Candles per Day
Trades per Day
Max Consecutive Wins
Max Consecutive Losses
You can start the Binary Option statistics from a specific Date, which is handy for checking more recent history.
HINTS:
BINARY OPTIONS trading: use 5min, 15m, 1hr or even Daily charts. Trade after the price touches one of the Breakout lines and the Arrow first appears. Wait for the price to come back from Break Line by 1 or 2 pips, the alert arrow must stay on and candle change to black, then take Binary trade expiry End of Candle. If price pull back and arrow turns off, don't trade this candle, move on you probably don't have momentum, there will be plenty of other trigger events. The backtesting results are good with ITM rates 65% to 72% on many currency pairs, commodities and indices. Realtime trading has confirmed the backtesting results and they could even be bettered, provided you are selective on which signals to trade (strong MACD support etc), that you are patient and disciplined to this trading method.
FOREX trading: the default settings should work with scalping. For longer term trades try with settings change to a more standard MACD filter or slower to catch the longer term momentum swings and the idea would be to trade the first Break Line alert that occurs after a decent Pullback in the direction of the trend. Setting the SL to just above/below the Pivot High/Low and set target to two or three times SL.
References:
"Fundamentals of Price Action Trading for Forex, Stocks, Options and Futures" video:
www.youtube.com
Other videos by "basecamptrading" on Naked Trading.
"Taking Profits in Today's Market by Daryl Guppy" video:
www.youtube.com

SMI BarsUses SMI (Stochastic Momentum Index) to set bar colors:
When SMI above overbought, bar color is red.
When SMI is between 0 and overbought, bar color is maroon
When SMI is between oversold and 0, bar color is green
When SMI is below oversold, bar color is lime.
When SMI crosses above or below 0, bar color is orange.

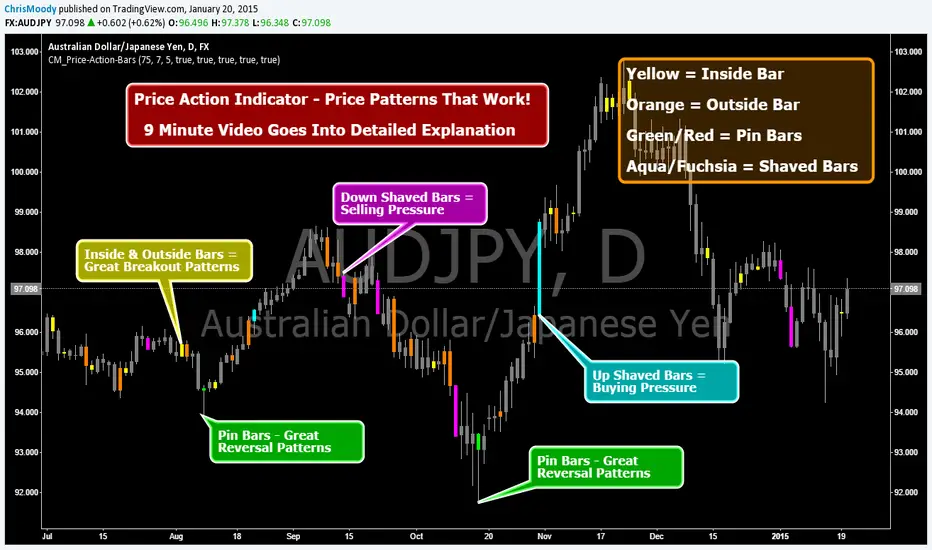
CM_Price-Action-Bars-Price Patterns That Work!Price Action Indicator - Price Patterns That Work!
9 Minute Video Goes Into Detailed Explanation
4 Simple but Effective Price Patterns!
Yellow = Inside Bar – Breakout Patterns
Orange = Outside Bar – Breakout Patterns
Green/Red = Pin Bars
Aqua/Fuchsia = Shaved Bars
***MANY Features and Customizing Options…Detailed Overview In Video.
How To Turn Bars Patterns On And Off.
Ways To Customize.
General Thought Process of the 4 Price Action Patterns.
What Each Setting in the Inputs Tab Does.
***Special Announcement. Video Below Just Updated. Received a Special Promotion from the creator of these Price Action Bars and Many other Price Action Setups. Hedge Fund Manager and Founder of 2ndSkiesForex.com Chris Capre.
1st 10 minutes of Video is covering throughout process and how to implement the Indicators.
2nd 12 minutes covers a Special Promotion offered to TradingView members directly from Chris Capre.
Video Link Below.
vimeopro.com
This Version of the video will be taken down 2/01/2015 and the original video will be uploaded again.
Vol color barsHighlight bars according it's volume releative to near candles. This script usefull for VSA trading.
Red bar - extrime high volume
Orange bar - volume is high
Grayish bar - volume is normal
Green bar - volume is low
Blue bar - almost no volume

Colored Volume Bars [LazyBear]Edgar Kraut proposed this simple colored volume bars strategy for swing trading.
This is how the colors are determined:
- If today’s closing price and volume are greater than 'n' days ago, color today’s volume bar green.
- If today’s closing price is greater than 'n' days ago but volume is not, color today’s volume bar blue.
- Similarly, if today’s closing price and volume is less than 'n' days ago, color today’s volume bar orange.
- If today’s closing price is less than 'n' days ago but volume is not, color today’s volume bar red.
Buy the green or blue volume bars, use a 1% trailing stop, and stand aside on red or orange bars.
As you see, this is more for entry confirmation. I have not tested this on any instrument.
You may have to tune the lookback period for your instrument. Default is 10.
More info:
"A color-based system for short-term trading" - www.traders.com
List of all my indicators:

BTC bar volume colorThis Pine Script indicator colors BTC price bars based on aggregated real trading volume from dozens of major spot and perpetual futures exchanges.
How it works briefly:
Collects and sums spot volume from ~20 exchanges
Collects and sums perp/futures volume from many platforms (with unit adjustments)
Computes a combined volume z-score over the last 100 bars
Scales the z-score into a range and maps it to transparency (higher volume → less transparent/more opaque bars)
Colors bars lime green for up candles and red for down candles
Result: Bars appear brighter and more solid on high-volume moves, fainter and more transparent on low-volume moves
Main purpose: Visually highlight genuine high-participation price action vs. low-conviction or "fake" moves on thin volume. Optional black background setting included.

4 Bar Sequential Counter (9 to 13) [DotGain]4-Bar Sequential Counter (Seq4)
This indicator identifies potential trend exhaustion phases using a strict sequential count
based on the relationship between the current closing price and the closing price four bars earlier.
How it works
• A bullish sequence is counted as long as the current close remains below the close from 4 bars ago.
• A bearish sequence is counted as long as the current close remains above the close from 4 bars ago.
• The count resets immediately if the respective condition is no longer met.
• The sequence counts up to a maximum of 13 , after which it resets and a new sequence may begin.
Visualization
• Only counts from 9 to 13 are displayed on the chart.
• Bullish sequences are plotted below price bars.
• Bearish sequences are plotted above price bars.
• The minimalist design keeps the chart clean and focused on potentially relevant exhaustion zones.
Interpretation
• A count of 9 may indicate an early sign of market overextension.
• A count of 13 represents a more advanced sequence and a higher probability
of consolidation or corrective price action.
• This indicator is not a standalone trading system and should be used in combination
with trend analysis, volume, and support/resistance levels.
Alerts
• Bullish sequence at 9
• Bullish sequence at 13
• Bearish sequence at 9
• Bearish sequence at 13
Disclaimer
This "4-Bar Sequential Counter (9–13)" (Seq4) indicator is provided for informational and educational purposes only. It does not, and should not be construed as, financial, investment, or trading advice.
This indicator is an independent implementation of a sequential counting method and is not affiliated with, or endorsed by any trademarked trading concepts or methodologies.
The signals generated by this tool (Green and Red) are the result of a specific set of algorithmic conditions. They are not a direct recommendation to buy or sell any asset.
All trading and investing in financial markets involves a substantial risk of loss. You can lose all of your invested capital.
Past performance does not guarantee future results.
This indicator highlights sequential price exhaustion patterns and may generate false, lagging, or incomplete signals. Markets can remain unpredictable longer than you can remain solvent.
The creator DotGain assumes no liability for any financial losses or damages you may incur, directly or indirectly, as a result of using this indicator or the information it provides.
You are solely responsible for your own trading and investment decisions. Always conduct your own research (DYOR), validate signals with other methods, and consider your personal risk tolerance before entering any trade.

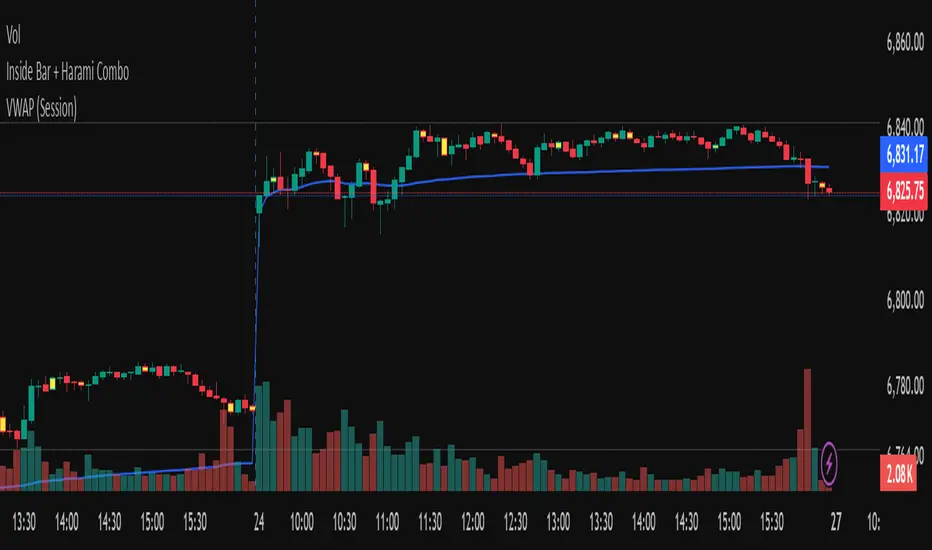
Inside Bar + Harami ComboThis indicator visually highlights Inside Bars, Outside Bars, and Harami candlestick patterns directly on your chart using clean color-coded candles — no labels, no shapes, just visual clarity.
It helps traders quickly identify potential reversal and continuation setups by coloring candles according to the detected pattern type.
🔍 Patterns Detected
🟨 Inside Bar — Current candle’s range is completely inside the previous candle’s range.
Often signals price contraction before a breakout.
💗 Outside Bar — Current candle’s high and low exceed the previous candle’s range.
Indicates volatility expansion and possible trend continuation.
🟩 Bullish Harami — A small bullish candle within the body of a prior bearish candle.
Suggests potential reversal to the upside.
🟥 Bearish Harami — A small bearish candle within the body of a prior bullish candle.
Suggests potential reversal to the downside.
⚙️ Features
Customizable colors for each pattern type.
Simple overlay visualization — no shapes, no labels, just colored candles.
Harami colors automatically override Inside/Outside colors when both occur on the same bar.
Lightweight logic for smooth performance on any timeframe or symbol.
💡 How to Use
Apply the indicator to your chart.
Configure colors in the settings panel if desired.
Watch for highlighted candles:
Inside Bars often precede breakouts.
Harami patterns can mark reversal zones.
Combine with trend tools (like moving averages) to confirm setups.
⚠️ Note
This indicator is for visual pattern detection and educational use only.
Always combine candlestick signals with broader technical or market context before trading decisions.
Avg Candle Size (Ticks) – Last 9 Closed BarsWhat it does:
Shows the average candle size in ticks for the last N closed bars (defaults to 9). I built this so I can glance at a 5-min chart and instantly know the typical bar size in ticks, updating only after each bar closes (no intrabar wiggle).
How it works:
Measures each bar’s full range (High–Low), not ATR and not candle body.
Averages the last N closed bars, converts to ticks using syminfo.mintick.
Displays a simple line plus a small readout (e.g., “32 ticks”).
Why I built it:
Gives me a realistic sense of current volatility in ticks so I can size stops/targets quickly without doing mental math.
Extras:
Lookback is configurable (default 9).
Optional rounding (floor/nearest/ceil).
Works on any timeframe/instrument that has a defined tick size.
If you want it to match ATR exactly (in ticks), swap the range calc for ta.atr(len) / syminfo.mintick
VRD-5: Volume Reversal Detector (5 Bars)Overview
This Pine Script indicator detects potential trend reversals based on volume patterns over a 5-bar period. It identifies accumulation (bullish) and distribution (bearish) patterns using volume analysis combined with price action.
Key Features
Volume Analysis:
Compares current volume to a 34-period SMA
Identifies strong/weak volume using configurable thresholds
Calculates volume "energy" as a 5-bar average ratio
Pattern Detection:
Bearish Signal: Looks for decreasing volume after a strong volume bar
Bullish Signal: Looks for increasing volume after weak volume bars
Visualization:
Colored volume histogram (bullish/bearish/neutral)
SMA volume line
Labels for detected signals
Customization Options:
Adjustable lookback period (3-10 bars)
Configurable thresholds for volume strength
Strict mode requiring confirming price action
Suggested Improvements
Performance Optimization:
Reduce the max_labels_count (currently 500) to improve performance
Consider using barstate.isconfirmed for more efficient calculations
Enhanced Visualization:
Add arrows on price chart for better visibility
Include a background color highlight for signal periods
Add option to display the energy level as a separate line
Additional Features:
Incorporate RSI or MACD for confirmation
Add multi-timeframe analysis capability
Include a strategy version for backtesting
Code Structure:
Separate the logic into distinct functions for better readability
Add more detailed comments for complex calculations
Consider using varip for real-time updates if needed
User Experience:
Add input options for label text size/position
Include sound options for alerts
Add a toggle for the information table
This indicator provides a solid foundation for volume-based reversal detection that could be further enhanced with these improvements while maintaining its core functionality.

Engulfing Bar AggressiveEngulfing Bar Aggressive
Engulfing Bar Aggressive is a precise price action indicator designed to detect strong bullish and bearish engulfing patterns in an aggressive way. This tool is perfect for traders who want early and confirmed signals based purely on candle formations, without relying on any indicators or moving averages.
🔍 Core Logic
The indicator scans for 2-bar engulfing patterns with additional strict conditions:
Bullish Engulfing
Current candle closes bullish (close > open).
Previous candle closes bearish (close < open ).
Current close completely engulfs previous open and high.
Current open is below previous close.
Signal triggers only after bar closure (confirmed pattern).
Bearish Engulfing
Current candle closes bearish (close < open).
Previous candle closes bullish (close > open ).
Current close completely engulfs previous open and low.
Current open is above previous close.
Signal triggers only after bar closure (confirmed pattern).
🛠 Features
Clear visual markers on the chart (green for bullish, red for bearish).
Configurable generic alert to receive notifications for any engulfing pattern detected.
Dedicated alerts for bullish and bearish engulfing setups.
Works on any timeframe and any market.
🎯 Use Case
Ideal for breakout traders, reversal traders, or as part of a multi-factor strategy.
Can be combined with support/resistance zones, ATR exhaustion levels, or trend filters for enhanced accuracy.

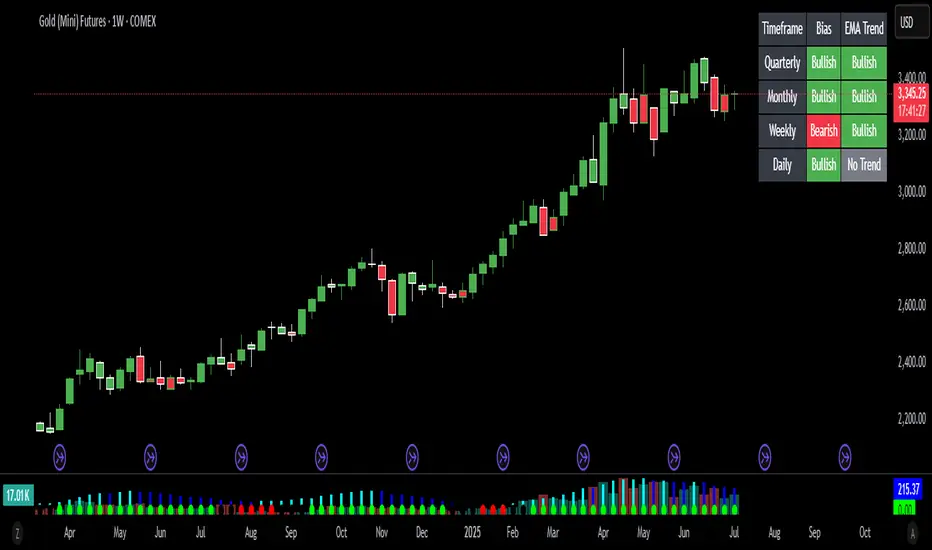
Bias Bar Coloring + Multi-Timeframe Bias Table + AlertsMulti-Timeframe Bias Bar Coloring with Alerts & Table
This indicator provides a powerful, visual way to assess price action bias across multiple timeframes—Monthly, Weekly, and Daily—while also coloring each bar based on the current chart’s bias.
Features:
Persistent Bar Coloring: Bars are colored green for bullish bias (close above previous high), red for bearish bias (close below previous low), and persist the last color if neither condition is met. This makes trend shifts and momentum easy to spot at a glance.
Bias Change Alerts: Get notified instantly when the bias flips from bullish to bearish or vice versa, helping you stay on top of potential trade setups or risk management decisions.
Multi-Timeframe Bias Table: A table anchored in the top right corner displays the current bias for the Monthly, Weekly, and Daily charts, color-coded for quick reference. This gives you a clear view of higher timeframe context while trading any chart.
Consistent Logic: The same objective bias logic is used for all timeframes, ensuring clarity and reliability in your analysis.
How to Use:
Use the bar colors for instant visual feedback on trend and momentum shifts.
Watch the top-right table to align your trades with higher timeframe bias, improving your edge and filtering out lower-probability setups.
Set alerts to be notified of bias changes, so you never miss a potential opportunity.
This tool is ideal for traders who value multi-timeframe analysis, want clear visual cues for trend direction, and appreciate having actionable alerts and context at their fingertips.
BVB dominance bars
Hello everyone, this is my first indicator. these candles shows you who's in control. I like to think its some what close to heikin ashi candles as it shows you the Trend but doesn't average it out. also shows you when there is indecision. please read the instructions on how it works. its not a stand alone strategy. but adds value to your own strategy.
📖 How It Works
The BvB Dominance Bars indicator is a visual tool that colors candles based on market control—whether bulls or bears are in charge. It uses a custom metric comparing the price's relationship to a smoothed moving average (EMA), then normalizes that difference over time to express relative bullish or bearish pressure.
Here’s the breakdown:
Bulls vs Bears Logic:
A short-term EMA (default: 14-period) is used to establish a midpoint reference.
Bull Pressure is calculated as how far the high is above this EMA.
Bear Pressure is how far the low is below this EMA.
These are normalized over a lookback period (default: 120 bars) to produce percentile scores (0–100) for both bulls and bears.
Dominance & Color Coding:
The indicator compares normalized bull and bear scores.
Candles are color-coded based on:
Bright Lime: Strong Bull Dominance (with high confidence)
Soft Lime/Yellow: Moderate Bull Control
Bright Red: Strong Bear Dominance
Soft Red/Yellow: Moderate Bear Control
Gray: Neutral/Low conviction
Optional Live Label:
A small floating label shows who has control: “Bull Control,” “Bear Control,” or “Neutral.”
🧠 How to Use It (Example Strategy)
The BvB Dominance Bars indicator is not a standalone buy/sell signal but a market sentiment overlay. It’s most effective when combined with your own strategy, like price action or trend-following tools.
Here’s an example use case:
🧪 Reversal Confirmation Strategy
Objective: Catch high-probability reversals during key kill zones or supply/demand levels.
Setup:
Mark your key support/resistance zones using your standard method (e.g., FVGs, liquidity sweeps, or ICT PD arrays).
Wait for price to reach one of these zones.
Watch candle colors from the BvB Dominance Bars:
If you expect a bullish reversal, wait for a transition from red/gray candles to lime green or bright lime (bullish dominance taking over).
If you expect a bearish reversal, look for a change from green/gray to red or bright red.
Entry Filter:
Only enter if the dominant color holds for 2+ candles.
Avoid trades when candles are gray or yellow (indecision/neutral).
Exit Option:
Exit if dominance shifts against you (e.g., from lime to red), or use structure-based stops.
⚙️ Settings You Can Adjust:
BvB Period: Controls how fast EMA responds.
Bars Back: Determines how long the normalization looks back.
Thresholds: Influence how strong the dominance must be to change candle color.
✅ Best Used When:
You already have a bias and just want a confirmation of sentiment.
You're trading intraday and want a feel for shifting momentum without relying on noisy indicators.
You want a clean, color-coded overlay to help filter out fakeouts and indecision.

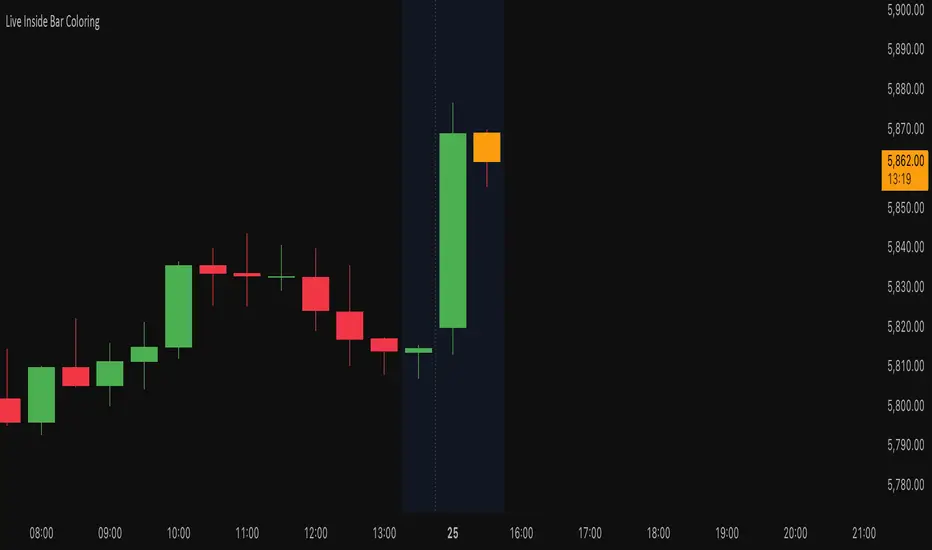
Live Inside Bar ColoringDescription
This script colors the current bar if it is inside the prior bar's high and low. Inside is defined as ≤ the high, and ≥ the low of the prior bar.
Utility
This gives a quick visual indication if the current bar is inside. This can indicate a choppier market. By definition, an inside bar is consolidating and not trending.
Function
Colors distinguish if the current price is above the opening price of the inside bar on a given timeframe. If you do not want to distinguish this, you can set both colors the same.
30-70 RSI Strategy with Colored BarThis script colors price bars based on Relative Strength Index (RSI) levels, giving traders a quick and visual way to assess overbought or oversold market conditions directly on the chart.
📈 Key Features:
✅ RSI-Based Bar Coloring:
Green bars when RSI is above the upper threshold (default 70) – suggests bullish momentum.
Red bars when RSI is below the lower threshold (default 30) – indicates bearish pressure.
Bars remain uncolored when RSI is between thresholds – a neutral zone.
🔧 Customizable RSI Settings:
Adjustable RSI length (default: 14 periods)
Adjustable overbought/oversold levels (default: 70/30)
🧠 Helps traders:
Quickly spot potential reversals or trend continuations
Visually align price action with momentum
🛠️ Usage:
Ideal for trend-following, reversal, and momentum strategies.
Works across any timeframe (1m, 5m, 1h, daily, etc.).

Candle Range-BarsThe Candle Range Bars indicator visually represents the range of each candlestick in either pips or ticks, depending on your preference. It plots vertical bars to show the size of each candle, making it easy to identify periods of high or low volatility. The indicator also displays the exact range value (in pips or ticks) above each bar, with customizable text size and color for better readability.
Key Features
Pips or Ticks Mode:
Choose to display the candle range in pips (for forex traders) or ticks (for other instruments).
Customizable Text:
Adjust the text color and text size (Tiny, Small, Normal, Large) to suit your chart style.
Clear Visuals:
Bars are colored green for bullish candles and red for bearish candles, making it easy to distinguish between up and down moves.
Flexible Use:
Ideal for analyzing volatility, identifying consolidation zones, and comparing candle ranges across different timeframes.
How to Use:
Add the indicator to your chart.
Customize the settings:
Choose between pips or ticks.
Adjust the text color and text size for the range values.
Observe the bars and their corresponding range values to analyze market volatility.
Why Use This Indicator?:
Simplify Range Analysis: Quickly see the size of each candlestick without manual calculations.
Customizable: Tailor the appearance to match your trading style.
Versatile: Works on any instrument and timeframe.
Settings:
Show Pips (Otherwise Ticks): Toggle between pips and ticks mode.
Text Color: Choose the color of the range value text.
Text Size: Select the size of the range value text (Tiny, Small, Normal, Large).
Ideal For:
Forex, stocks, commodities, and crypto traders.
Traders who focus on volatility and range analysis.
Anyone looking for a clear and customizable way to visualize candle ranges.
This description highlights the key features, benefits, and usability of your indicator, making it appealing to other TradingView members. Let me know if you'd like to tweak it further! 😊

the rainbow unicornScript Name: The Rainbow Unicorn
Description:
The Rainbow Unicorn is a unique visual indicator designed to add a touch of color and fun to your trading charts. This indicator colors the bars, wicks, and borders using rainbow colors, making technical analysis more enjoyable and visually appealing.
Features:
Rainbow Colors: Bars, wicks, and borders are colored in red, orange, yellow, green, blue, and purple, creating a dynamic rainbow effect.
Customization: Colors are applied cyclically, offering a continuous and smooth visualization of market data.
Ease of Use: No complex configuration is required. Simply add the indicator to your chart to see the rainbow colors in action.
How It Works:
The indicator uses a function to generate rainbow colors and applies them to the bars on the chart based on their index. The colors are defined in an array and are applied cyclically, meaning each bar receives a different rainbow color.
Usage:
Add the "The Rainbow Unicorn" indicator to your chart.
Observe the rainbow-colored bars for a more visual and fun trading experience.
Use this indicator in conjunction with your other technical analysis tools for better visualization of trends and price movements.
Underlying Concepts:
This indicator is primarily designed to enhance the visual experience of traders by adding vibrant and dynamic colors to the charts. It does not rely on complex calculations or trend detection methods but aims to make technical analysis more enjoyable and engaging.

Internal Bar Strength (IBS) Strategy█ STRATEGY DESCRIPTION
The "Internal Bar Strength (IBS) Strategy" is a mean-reversion strategy designed to identify trading opportunities based on the closing price's position within the daily price range. It enters a long position when the IBS indicates oversold conditions and exits when the IBS reaches overbought levels. This strategy was designed to be used on the daily timeframe.
█ WHAT IS INTERNAL BAR STRENGTH (IBS)?
Internal Bar Strength (IBS) measures where the closing price falls within the high-low range of a bar. It is calculated as:
IBS = (Close - Low) / (High - Low)
- **Low IBS (≤ 0.2)**: Indicates the close is near the bar's low, suggesting oversold conditions.
- **High IBS (≥ 0.8)**: Indicates the close is near the bar's high, suggesting overbought conditions.
█ SIGNAL GENERATION
1. LONG ENTRY
A Buy Signal is triggered when:
The IBS value drops below the Lower Threshold (default: 0.2).
The signal occurs within the specified time window (between `Start Time` and `End Time`).
2. EXIT CONDITION
A Sell Signal is generated when the IBS value rises to or above the Upper Threshold (default: 0.8). This prompts the strategy to exit the position.
█ ADDITIONAL SETTINGS
Upper Threshold: The IBS level at which the strategy exits trades. Default is 0.8.
Lower Threshold: The IBS level at which the strategy enters long positions. Default is 0.2.
Start Time and End Time: The time window during which the strategy is allowed to execute trades.
█ PERFORMANCE OVERVIEW
This strategy is designed for ranging markets and performs best when prices frequently revert to the mean.
It is sensitive to extreme IBS values, which help identify potential reversals.
Backtesting results should be analyzed to optimize the Upper/Lower Thresholds for specific instruments and market conditions.

IU 4 Bar UP StrategyIU 4 Bar UP Strategy
The IU 4 Bar UP Strategy is a trend-following strategy designed to identify and execute long trades during strong bullish momentum, combined with confirmation from the SuperTrend indicator. This strategy is suitable for traders aiming to capitalize on sustained upward market movements.
Features :
1. SuperTrend Confirmation: Incorporates the SuperTrend indicator as a dynamic support/resistance line to filter trades in the direction of the trend.
2. 4 Consecutive Bullish Bars: Detects a series of 4 bullish candles as a signal for strong upward momentum, ensuring robust trade setups.
3. Dynamic Alerts: Sends alerts for trade entries and exits to keep traders informed.
4. Visual Enhancements:
- Plots the SuperTrend indicator on the chart.
- Changes the background color while a trade is active for easy visualization.
Inputs :
- SuperTrend ATR Period: The period used to calculate the Average True Range (ATR) for the SuperTrend indicator.
- SuperTrend ATR Factor: The multiplier for the ATR in the SuperTrend calculation.
Entry Conditions :
A long entry is triggered when:
1. The last 4 consecutive candles are bullish (closing prices are higher than opening prices).
2. The current price is above the SuperTrend line.
3. The strategy is not already in a position.
4. The bar is confirmed (not a partially formed bar).
When all these conditions are met, the strategy enters a long position and provides an alert:
"Long Entry triggered"
Exit Conditions :
The strategy exits the long position when:
1. The closing price drops below the SuperTrend line.
2. An alert is generated: "Close the long Trade"
Visualization :
- The SuperTrend line is plotted, dynamically colored:
- Green when the trend is bullish.
- Red when the trend is bearish.
- The background color turns semi-transparent green while a trade is active, indicating a long position.
Do use proper risk management while using this strategy.

Inside Bar Breakout/Fakeout with AI Scenarios [Yosiet]Inside Bar Breakout/Fakeout Indicator with Scenarios
The Indicator is a powerful tool for traders looking to identify potential breakout and fakeout opportunities based on inside bar patterns. This indicator combines multiple technical analysis concepts to provide a comprehensive view of market behavior, helping traders make more informed decisions.
Key Features
Inside bar detection with filtering
Breakout and fakeout identification
Three distinct scenario detections
Customizable moving average calculations
Flexible visualization options
Alert conditions for various events
How It Works
The indicator identifies inside bars and filters them based on a maximum number of consecutive inside bars. It then detects breakouts and fakeouts using user-defined parameters. The script also calculates moving averages to determine trend direction.
Three specific scenarios are detected:
Strong breakout followed by a strong reversal
Weak breakout with multiple doji/weak candles
Strong breakout without reversal
These scenarios are visually represented on the chart, allowing traders to quickly identify potential trading opportunities.
How to Use
Apply the indicator to your chart
Adjust the input parameters to suit your trading style
Look for inside bar patterns and subsequent breakouts/fakeouts
Pay attention to the three scenario markers for additional context
Use the alert conditions to stay informed of potential opportunities

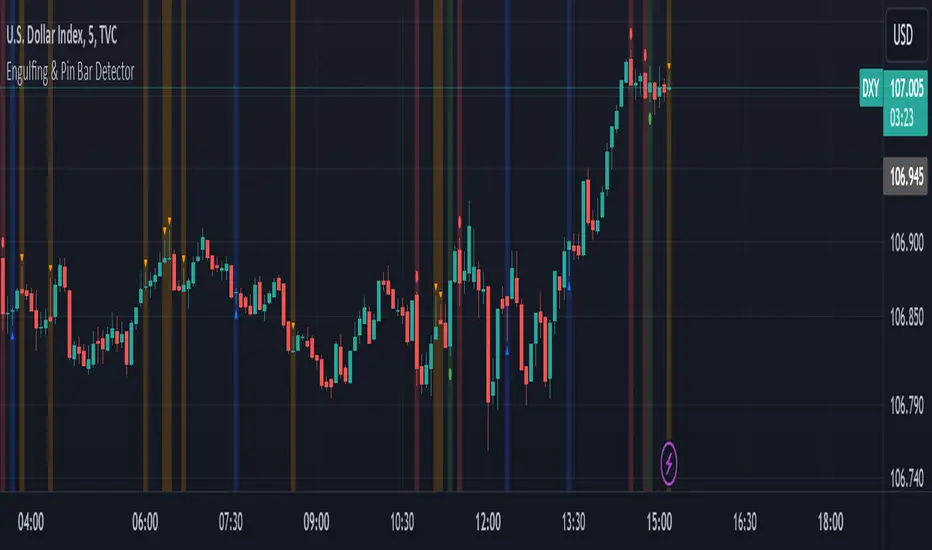
Engulfing & Pin Bar DetectorOverview
The "Engulfing & Pin Bar Detector" script identifies two important candlestick patterns: Engulfing Candles and Pin Bars. These patterns are widely used in technical analysis to signal potential reversals or continuations in the market. The script provides visual signals directly on the chart to help traders make informed decisions.
Features Bullish Engulfing:
The second candle completely engulfs the body and shadows (high and low) of the previous bearish candle.
Signals a potential reversal to the upside.
Marked with a green background and a label below the candle.
Bearish Engulfing:
The second candle completely engulfs the body and shadows (high and low) of the previous bullish candle.
Signals a potential reversal to the downside.
Marked with a red background and a label above the candle.
Bullish Pin Bar:
A candle with a long lower shadow and a small body near the top of the range.
Indicates potential upward price action.
Marked with a blue background and an upward triangle below the candle.
Bearish Pin Bar:
A candle with a long upper shadow and a small body near the bottom of the range.
Indicates potential downward price action.
Marked with an orange background and a downward triangle above the candle.
Customizable Visual Alerts:
Background highlights and shape markers for quick and easy identification of patterns.
How to Use
Add the script to your TradingView chart.
Look for:
Green background: Bullish Engulfing.
Red background: Bearish Engulfing.
Blue background: Bullish Pin Bar.
Orange background: Bearish Pin Bar.
Combine with other indicators or price action techniques for confirmation.
Adjust your entry and exit strategies based on the patterns:
For Bullish Engulfing or Bullish Pin Bar, consider entering long positions or exiting shorts.
For Bearish Engulfing or Bearish Pin Bar, consider entering short positions or exiting longs.
Example Use Cases
Identify potential reversal zones.
Use as confirmation in trend-following or counter-trend strategies.
Enhance your analysis with clear visual signals.
2 bars BarsInputs:
The script allows you to specify the values for each state (HH, HL, LL, LH) for two bars.
Labels as Bars:
Instead of line.new, this script uses label.new to simulate a pseudo-bar chart.
Bars are visually represented as labels, with distinct positions and colors.
Offset Logic:
The offset ensures that each category has its labels (bars) placed at the correct horizontal distance.
Custom Categories:
The categories array ("HH", "HL", "LL", "LH") links to their respective values.
