Ouside Bar First high/low DetectorIndicator wenting to the lower time frame(if compare with current chart time frame) and seek what happened first, the low of previouse bar was updated first or the high of previouse bar.
In some trading strategies need to know exactly sequence of actions for outside bars to program the logic for testing on deep history.
If first was updated the high of previouse bar indicator will draw green diamond above the outside bar. If first was updated the low of previouse bar then indicator will draw red diamon below the ouside bar.
In cases where both side diamonds is plotted it meant the current Lower time frame resolution is not enough to clear figure out what was first Low of High, need choose lower resolution.
I did not found ready to use examples and made my own.
I hope it will be usefull for you.
Best Regards.
Cerca negli script per "bar"

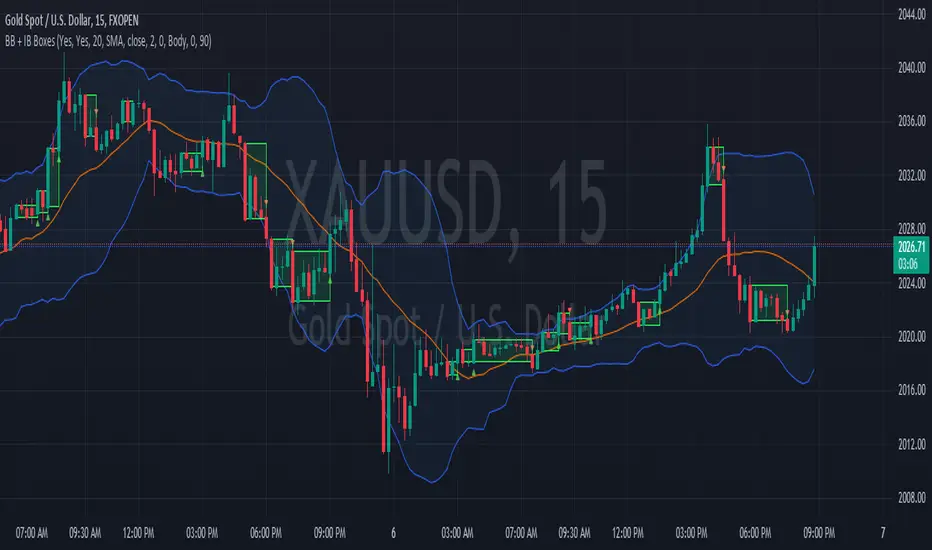
Bolingger Bands + Inside Bar BoxesBollinger Bands are a technical analysis tool consist of three bands—an upper, middle, and lower band—that are used to spotlight extreme short-term prices in a security. The upper band represents overbought territory, while the lower band can show you when a security is oversold. Most technicians will use Bollinger Bands® in conjunction with other analysis tools to get a better picture of the current state of a market or security.
An Inside Bar is a two-bar price action trading strategy in which the inside bar is smaller and within the high to low range of the prior bar. Inside bars show a period of consolidation in a market. They often form following a strong move in a market, as it ‘pauses’ to consolidate before making its next move. However, they can also form at market turning points and act as reversal signals from key support or resistance levels.
UDI barCandle has been divide into 3 types up bar, down bar and inside bar,
These bar classified comparing previous candle high low to current candle close.
This method used to ride the trend without exiting position.
We can use this candle color as a stop loss and take profit.
Previous candle H&L Vs Cur. Candle Close
I
U
D
------------------------
I - Inside Candle
U - Up Candle
D - Down Candle

Inside Bar FinderInside bars occur when the range of a candlestick falls entirely within the previous candlestick's range. This indicates volatility contraction which often leads to volatility expansion, i.e. large price movements.
This indicator includes options such as:
- The number of consecutive inside bars required to trigger the indicator
- Signal lines to indicate the high and low of the outermost or innermost bars
Try out this indicator with different options on different timeframes to see if inside bars increase the probability of identifying the direction of price movements. Breaks or closes outside the inside or outside signal lines can be used to trigger trade signals.

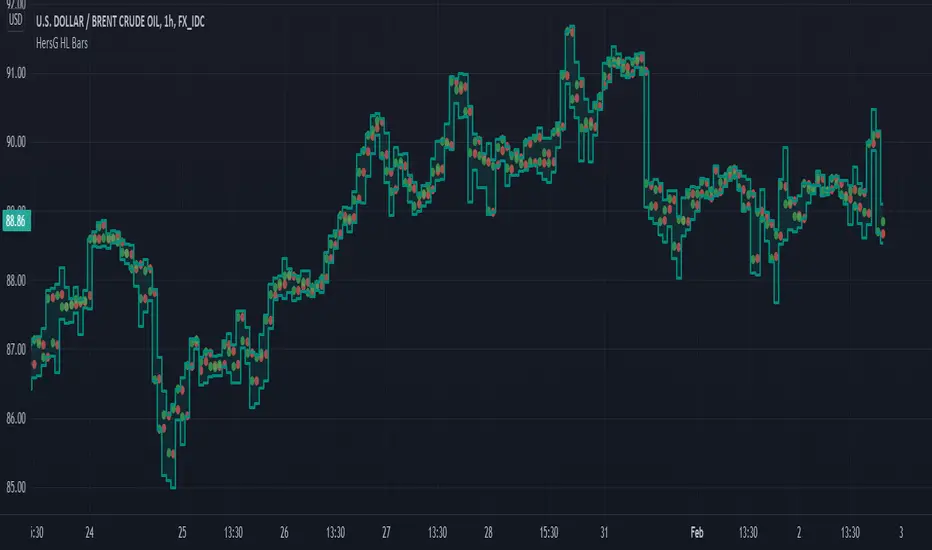
HersG High Low Bar Charts Layout
Hello friends,
The following indicator will create a new form of chart layout in High & Low as candle-like full bars instead of Open and Close. There are no wicks, only full bars highlighting High and Low of the select time frame. Two dots inside a bar will represent Open (Red dot) and Close (Green dot).
How can it help you as a trader?
High and Low candle-like bars will clear the noise from charts in identifying support & resistance, higher-highs and lower-lows will be clearly visible thus helping you make trades.
First add the indicator and then hover the mouse pointer over the ticker in the charts and click on the “eye-shaped” symbol to hide the candlesticks chart pattern.
The type of chart layout is standard charts. Data are not re-calculated or manipulated.
Regards!
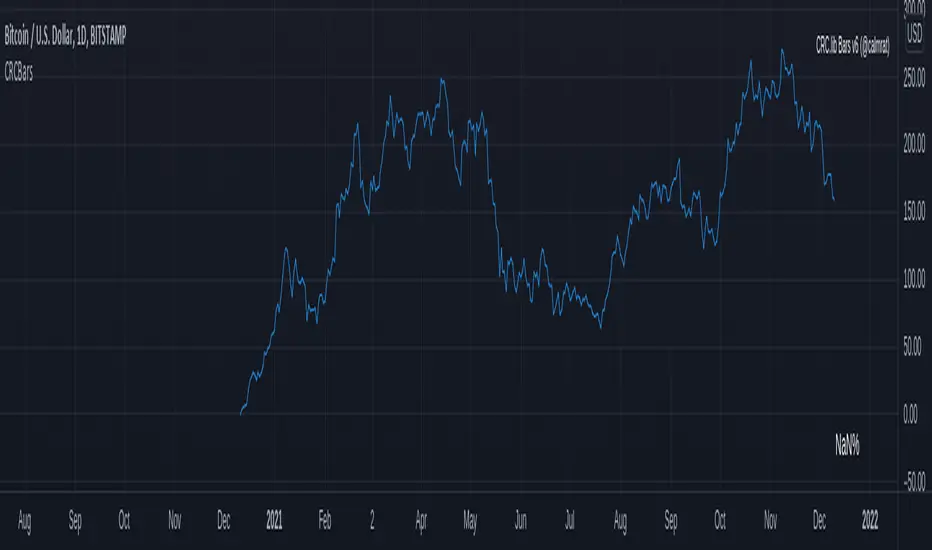
CRC.lib Bars - Bar FunctionsLibrary "CRCBars"
min_max(open, open) Get bar min (low) and max (high) price points
Parameters:
open : Open price data
open : Close price data
Returns:
is_bullish_bearish(open, open) Get bar bullish/bearish boolean signals
Parameters:
open : Open price data
open : Close price data
Returns:
sizes(open, open, open, open) Get bar sizes based on open/high/low/close data
Parameters:
open : Open price data
open : High price data
open : Low price data
open : Close price data
Returns:
10X Bars - Directional TrendsMy interpretation of John Carter's popular Simpler Trading 10X Bars indicator.
Momentum is displayed to quickly see the quality and strength of a trend based on a calculation of the Directional Movement Index (DMI). The DMI is an indicator developed by J. Welles Wilder in 1978 that identifies in which direction the price of an asset is moving. The DMI is calculated by comparing prior highs and lows and produces 2 measurements illustrating the strength of the current trend:
-> a positive directional movement line (+DI); and
-> a negative directional movement line (-DI).
The average directional index (ADX) measures the strength of the current trend, either +DI or +DI; a reading above 20 typically indicates a strong trend.
-> Green bars indicate an uptrend i.e. when +DI is above -DI and ADX is greater than 20 - there is more upward pressure than downward pressure in the price;
-> Red bars indicate a downtrend i.e. when -DI is above +DI and ADX is greater than 20 - there is more downward pressure on the price; and
-> Yellow bars indicate no strong directional trend and potential for a reversal.
Volume spikes 50% above average volume are then flagged as dots at the bottom of the chart (although you can change this location), confirming the momentum further.
This indicator should compliment other popular indicators, as confirmation whether to stay in a position or not.

Pin Bar//Pin Bar at the edge of BB
//Conditions to check
// 1. It must be a Pin Bar
// 2. Price Above/Below 200 SMA
// 3. Volume must be above 20 SMA
// 4. Low/High of the Pin Bar must cut across the BB upper/lower band
// 5. The very next candle closes above/below the high/low of the pin bar candle
Recommended timeframe - Daily and Weekly

4 SMAs & Inside Bar (Colored)SMAs and Inside Bar strategy is very common as far as Technical analysis is concern. This script is a combination of 10-20-50-200 SMA and Inside Bar Candle Identification.
SMA Crossover:
4 SMAs (10, 20, 50 & 200) are combined here in one single indicator.
Crossover signal for Buy as "B" will be shown in the chart if SMA 10 is above 20 & 50 and SMA 20 is above 50.
Crossover signal for Sell as "S" will be shown in the chart if SMA 10 is below 20 & 50 and SMA 20 is below 50.
Inside Bar Identification:
This is to simply identify if there is a inside bar candle. The logic is very simple - High of the previous candle should be higher than current candle and low of the previous candle should be lower than the current candle.
If the previous candle is red, the following candle would be Yellow - which may give some bullish view in most of the cases but not always
If the previous candle is green, the following candle would be Black - which may give some bearish view in most of the cases but not always
Be Cautious when you see alternate yellow and black candle, it may give move on the both side
Please comment if you have any interesting ideas to improve this indicator.

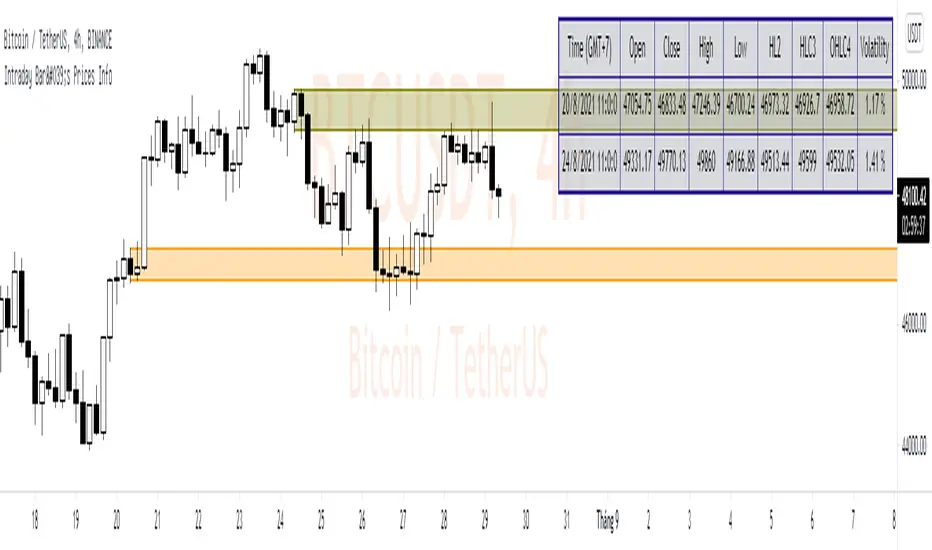
Intraday Bar's Prices Info* Intraday Bar's Prices Info display all prices type of a bar intraday and highlight Price Zone on Chart.
* These informations may useful for place Pending Order at exact price level.
* This simple script can show info of 2 bars at one time and setup as below:
1. GMT: default is GMT+7 and adjustable
2. Time setting: Date - Month - Year - Hours - Minutes - Seconds
3. Color setting: Can adjust color for each bar
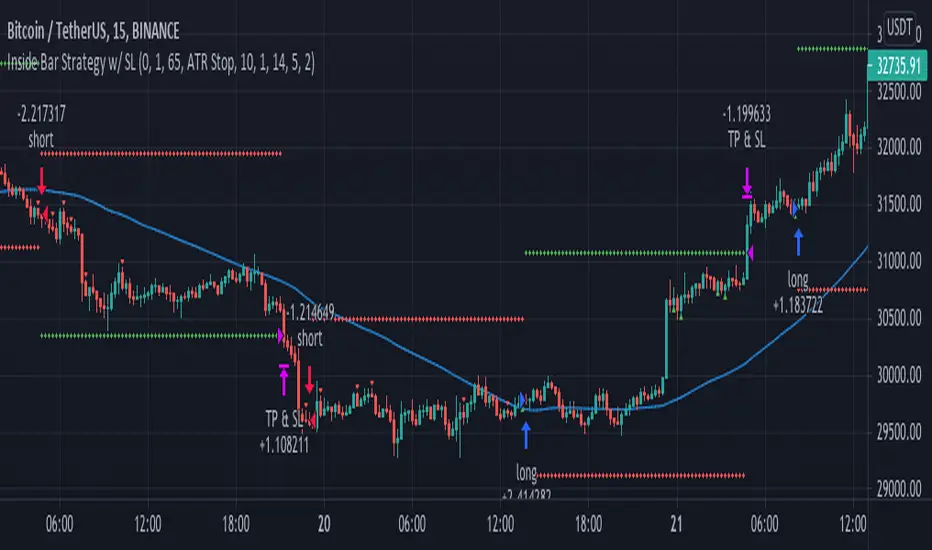
Inside Bar Strategy w/ SL"Inside bars are a two -bar pattern. They can indicate either a continuation of the
existing move or a reversal. A continuation occurs when there is no significant
support or resistance level in sight, while a reversal occurs close to a strong sup-
port or resistance level...
...A lot of traders are aware of inside bars but few manage to make money with
them. Why is this so? It goes back to interpreting price action. A lot of traders look
to trade in geometric ways. What I mean is that they search for fancy shapes on a
chart and think that this is what represents true price action.
This is not the case. A shape is just a shape. The formation by itself means
nothing unless underlying order flow backs it up. This is why it’s extremely
important that you look for inside bars when a trend is already in place.
The best place to look for them is in the beginning of trends."
macBar is a script for displaying the trend with colored barsThis script is based on educational materials I received at a webinar by Jeffrey Kennedy of Elliott Wave International. I didn't find such a script in the Tradingview library, so I wrote it myself.
This is a simple script that colors the bars depending on where the price is and its extremes relative to a simple moving average.
The green bars say the market is bullish.
The gray bars indicate that the market is neutral.
The red bars say the market is bearish.
In the script, you can change the period of the simple moving average, by default it is 10.

Volume on bar VSA - signal V2Google translate.
This indicator marks bars on the chart with high and medium volumes. The direction of the effort depends on whether the tail is on the bar, bullish or bearish.
In the settings you can set (sensitivity) for tinting volumes of high and medium
This indicator highlights volumes just like here
Этот индикатор помечает бары на графике с повышенными и средними объемами. Направление усилия зависимости от того какой хвост на баре, бычий или медвежий.
В настройках можно задать (чувствительность) для подкрашивания объемов повышенных и средних.
Этот индикатор выделяет объемы точно также как

Inside Bar AlertThis software finds inside bars even when the inside bar maybe not exactly inside the previous bar. It can also find inside range or smaller range then norm candles. By being able to identify the consolidation bar, it allows you to get on-board just before a likely expansion bars will happen.

Volume Weighted Price Over A Moving 60 Bar Window// By S.Black
// 4/24/2019
// Pine on TradingView.com
//
// This plot takes a simple 60 bar window
// For each bar in the window 3 things are plotted:
// 1.) The volume-weighted average, each bar's volumne * price summed, then divided by total volume
// 2.) The simple 60 bar average (not weighted)
// 3.) The close price (for reference)
//
// Green is used when the weighted price is above the average
// This is meant to indicate that actually, by volume the stock may be worth more that it is currently trading at.
// I made a new script was because I didn't see one that had a rolling hour window.

Expansion Bar IndicatorThis indicator shows bars with large bodies (large expansion bars) as a red bar.
They are important in the cd leg of a harmonic pattern, because they signal that extra confirmation is needed and that a failure of the PRZ is more likely.
The definition of this large expansion bar is a bar that has a body that is at least twice as big as the ATR with period 55.
This rule and indicator were originally created by Alexander Nikitin for MT4.

Renko Bar Time by JustUncleLThis indicator in designed to be used with Renko and other price only bars (ie Kagi, LineBreak, Point&Figure) and shows the number of minutes a bar was open before it was confirmed and printed.
NOTE: It will only work on currencies and symbols that are in the 24/5 market, it does account for weekend market close time but does not account for any Forex market holiday close times.
HINTS:
When the BAR TIME is long and the Renko Bricks have wicks, this is an indication of consolidation.
When the BAR TIME is short and the Renko Bricks have no wicks, this is an indication of acceleration.

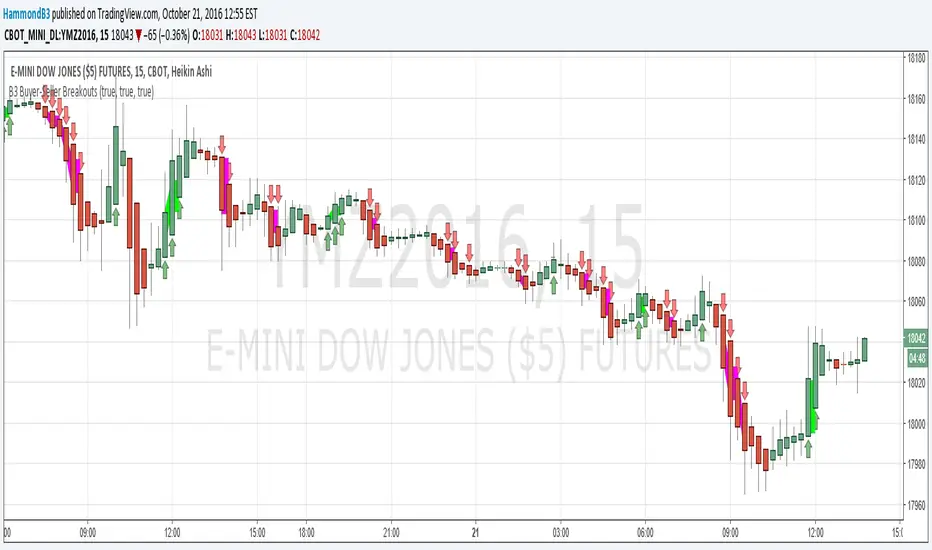
B3 Buyer-Seller BreakoutsB3 Buyer-Seller Breakouts = If a bar is showing that it is moving in a direction with highs lows and close, all of which are >respectively< moving against the open from the bar before, then it prints indicating buyers or sellers bringing momentum. The arrows and cloud carry into the next bar to give lots of awareness of the micro-term momentum. The cloud represents the better price range from which to add to a position.
This study repaints within the bar, most of my indicators do not, but this one is about timing to get an edge on adding to your already in play position, becoming part of the needed momentum to hit profit targets faster. Also, this theory helps you add to winners, and if you never add to losers, you now have statistical odds in your favor. I got the idea for the study reading about turtle trader method and how that statistical edge is really why it works, always adding on every breakout. Keep in mind that I never buy or sell breakouts to initiate trades, only to scale in.
~Cheers!~ ~B3
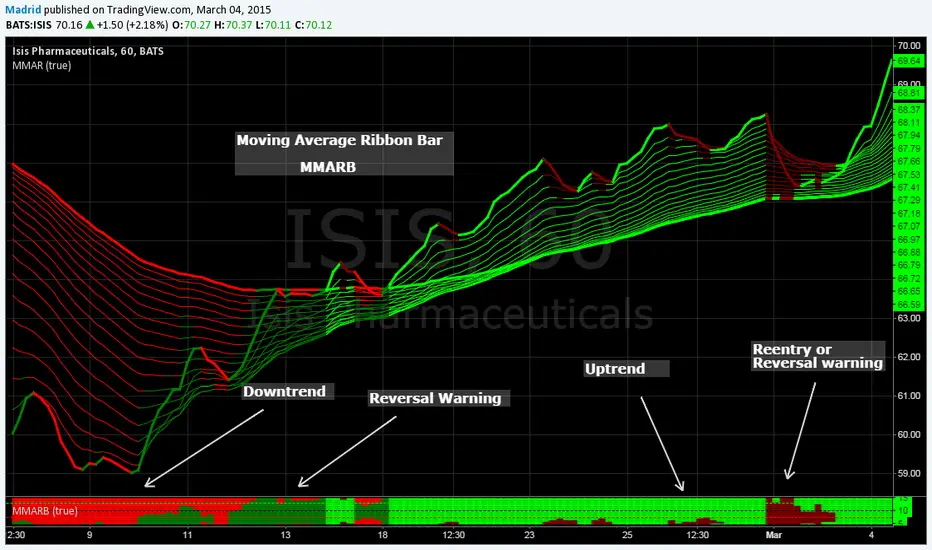
Madrid MA Ribbon BarThis is the MMAR companion study. This along with the MMAR study help visualize in a concise way the trend direction, patterns, trend strength, entry points and reversals.
Trading with MMAR: Look for the size of the bar, when it is partially filled with a color starting from bottom to top it means there is a reentry point, but if it fills 50% or more then there is a strong possibility that this will turn into a trend reversal. You may want to wait for confirmation. Normally after two or three solid bars you can have an idea of where the trend goes.
The standard colors are
1. Red : Downtrend
2. Maroon : Short reentry or uptrend warning
3. Lime : Uptrend
4. Green : Long reentry or downtrend warning
This indicator is based on the MMAR, so the only parameter it needs is the kind of MA you want to use, if you're using a regular standard moving average or an exponential moving average (this reduces lagging). Normally I use the exponential MA, which is the default value. It is simple, it only has four output values, it can be easily interpreted and practically no input parameters to tune. This doesn't require too much space on the screen
I suggest you to shrink the bar so it gives the visual effect of a solid bar and put it at the bottom of the screen.
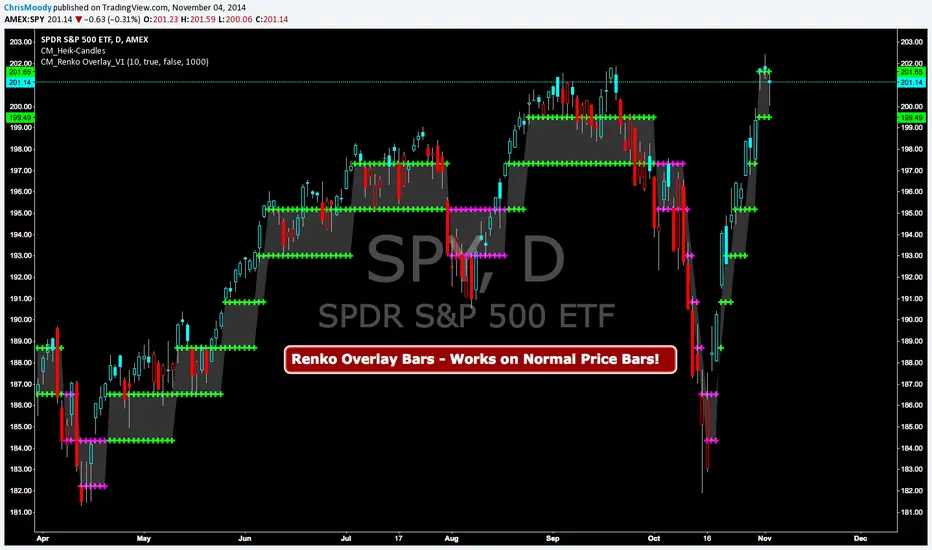
CM Renko Overlay BarsCM_Renko Overlay Bars V1
Overlays Renko Bars on Regular Price Bars.
Default Renko plot is based on Average True Range. Look Back period adjustable in Inputs Tab.
If you Choose to use "Traditional" Renko bars and pick the Size of the Renko Bars the please read below.
Value in Input Tab is multiplied by .001 (To work on Forex)
1 = 10 pips on EURUSD - 1 X .001 = .001 or 10 Pips
10 = .01 or 100 Pips
1000 = 1 point to the left of decimal. 1 Point in Stocks etc.
10000 = 10 Points on Stocks etc.
***V2 will fix this issue.
CM_Stochastic Highlight BarsCM_Stoch Highlight Bars
belgusinc Wanted to Know How To Create Highlight Bars based on Stochastic Bars Being Overbought/Oversold
Basics:
Ability to turn On/Off Crosses Only Above or Below High/Low Lines.
User sets Values Of High/Low lines. (Determines how highlight Bars are plotted, Based on the Value of the High/Low lines.
Ability to turn On/Off All Crosses, Both BackGround Highlights and “B”, “S” Letters.
Ability to turn On/Off BackGround Highlights if Stoch is Above Or Below High/Low Lines.
Ability to All or Any Combination of these Features.
Lower Indicator

Timeframe Continuity BarsTimeframe Continuity Bars is a script that is extremely simple for good reason
So please, do not remove this post because it seems 'simple'
Now that's over with. Lets dive in to understand what timeframe continuity IS and what this indicator does.
Timeframe continuity is defined by 4 or more timeframes and it is the relationship of the last price traded to those 4 opening prices. Standard timeframe continuity would be using the M,W,D,60min timeframes.
The reason we use MTF analysis is because of the truth of what price is and how it works.
Price movement is SOLELY caused due to aggressive buying / selling. Some may attempt to refute this however at the end of the day. If the price is at 100.00 it is because a buyer is willing to buy there and a seller is willing to sell there. If those market participants did not want to buy or sell at 100.00 price would go up or down to meet the more aggressive participant.
So what does this look like you may ask...
If an aggressive buyer takes the offer we will see prices go up if they were willing to pay more than the last guy who took the offer.
So price may go from 100.00 to 100.01 because you decided to invest in that stock that day at that time with a market order
This same thing occurs when every other institution creates, adds, reduces, or exits a position. They have to buy or sell and they have to either do it aggressively or do it passively by sitting on the bid / ask and waiting.
So since this is true, we know that the relationship to the opening price is extremely important. This is because if price is above it's open that means buyers were willing to take the offer and buy at higher prices. If price is below it's open it means that sellers were willing to sell at the bid and they sold at lower prices.
So any candlestick chart is simply an aggregation of this aggressive buying/selling that is taking place at all times.
By using the timeframe continuity bars indicator we can measure the distance from the current open across 4 or more timeframes.
By doing this we can identify monthly participation groups, weekly participation groups, daily participation groups, and 60min participation groups.
When all those groups align green or red this is considered full timeframe continuity. Where the monthly weekly daily 60min groups are all taking the offer and buying, or all selling at the bid!
When this aligns this is when price is for CERTAIN going in one direction.
However, It is subject to change every 60 minutes as the 60min determines if those monthly weekly daily buyers are present RIGHT NOW.
So if the 60min changes we go into direct conflict against the month/week/day groups.
If we see the 60min and day align we go into direct conflict against the month/week
if the 60min day and week are red we over-take the monthly group for control. At the time of the week day and 60 being red we have ZERO evidence of the previous monthly buyer/seller that was present.
Now that you understand a little bit about continuity.. Check it out on the chart!
P.S Here is some tips
1) it is not about just all timeframes aligning, we want to see long green / red bars!
2) The opens reset on a cyclical basis. Each day, each week, each month... When the new timeframes open we will see timeframes have the SAME open. When the opens are the same price we have LESS evidence versus having all opens seperate.
3) Investors can use the Y Q M W as their 4 timeframes to see when institutional buying is occurring [go do a case study on AMEX:GLD and AMEX:SLV weekly timeframe with these settings]
4) You need to add 4 separate indicators and change the timeframes. It is ideal to then save this layout!
5) The best way to do price analysis is using #TheStrat across all 4 timeframes instead of one timeframe with this indicator. This is soley a tool we use to show changing of control between participation groups!

PA Bar Count (First Edition)This script is written by FanFan.
It is designed to count price action bars and identify the bar number in a sequence.
The script helps traders track bar structure and improve PA analysis.
