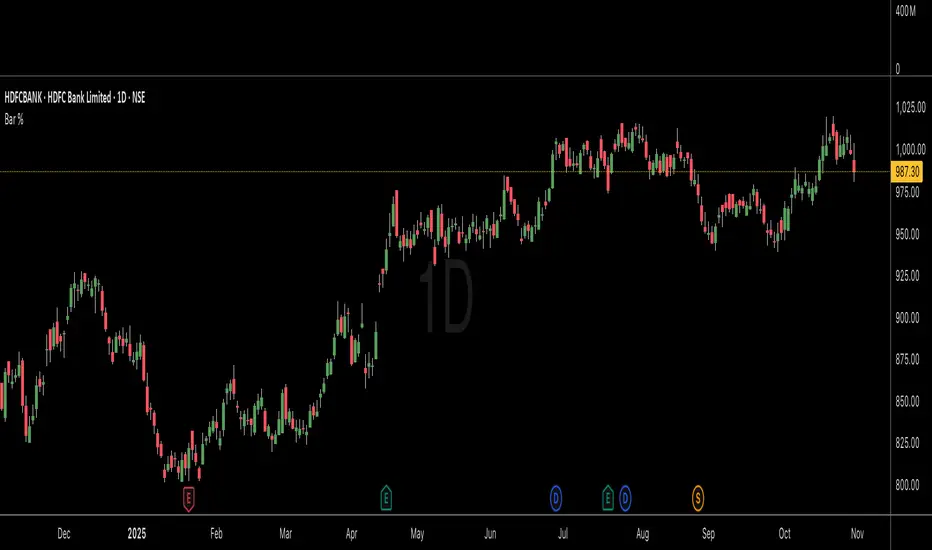
Zendog Bar PercentageThis script will add text to bars showing the price change of the bar as a percentage, both for open/close and high/low.
It can be used together with Rate of Change to better get an idea of how the price moved at a previous point in time.
Script uses labels for text, as there is a maximum limit of 500 labels if you want to study price movement for a specific timeframe, you can limit the timeframe from the script settings. Keep in mind that labels are applied to the last 500 candles of any timeframe.
Script also displays statistics for max changes in the selected time period, for both green and red candles both as percentage and base currency absolute value.
Uses:
- Study the behavior of an asset under previous market conditions, black swan events a.s.o.
- Calculate leverage position risk versus extreme price movements
Example: ZENUSDT pumped ~35% on 15 Sep 2021 in the first seconds after the news on getting listed on Coinbase so shorts with 3x leverage would have been liquidated.
Cerca negli script per "bar"

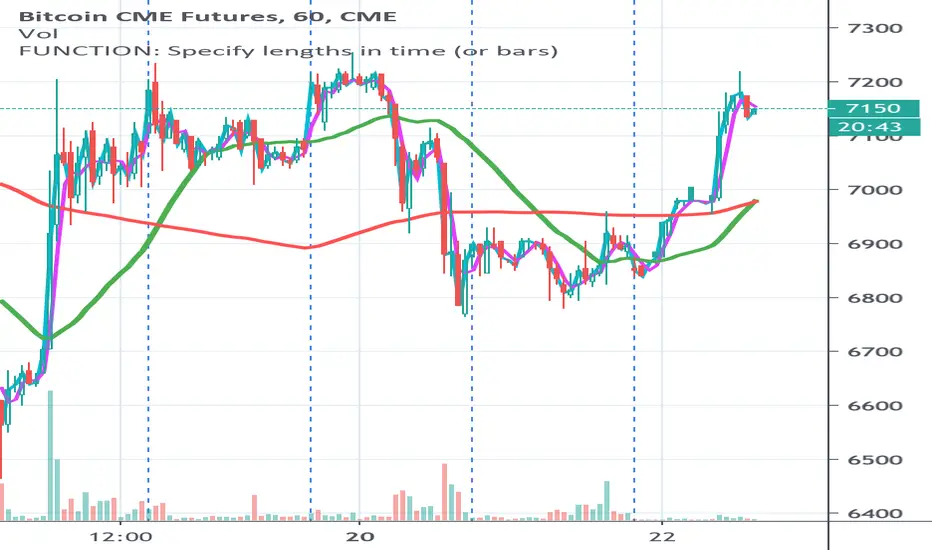
FUNCTION: Specify lengths in time (or bars) This is a function to give measures in time rather than bars...
I often want to measure in things in time rather than bars and change the sample rate (the candle size)
without reconfiguring my settings. This is a handy function for setting you input lengths in time units
(or bars when you want that)
For example
I want a 3 hour moving average, regardless of whether I have 5 minute candles or 30 min candles...
I want a 200 day moving average, regardless of whether I have 1 day or 1 week candles...
This is designed for you to put in your own scripts for your own purpose, but you can use this as is for time constant moving averages
or as an indicator on an indicator.
This shows the same moving averages 45 min / 3 hours in aqua / fuchsia and 1 day / 1 week in red / green
First row: On an extended session chart with 10m, 30m and 60m candles (all of them use the same settings (day length is 16 hours) everything else default.
Second row: On a standard session chart with 10m, 30m and 60m candles (all of them use the same settings everything else default.
Kaz Style BarsChange bar colors based on above or Below EMA
I use it to match Kaz's bars look on my charts

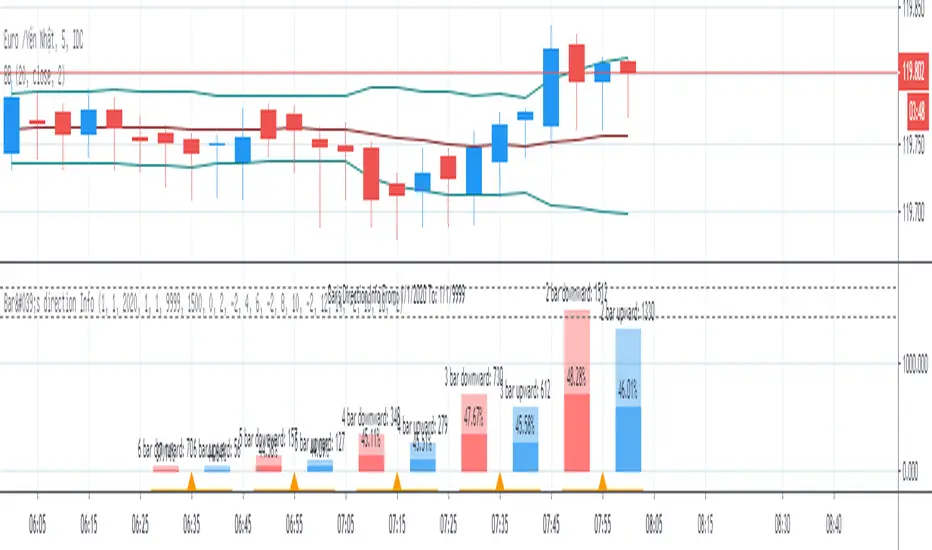
Bar's direction InfoBar's direction Info show number of case which bars have same direction and counting percent of next bar's direction.
This info may be useful to trade Binary Option.
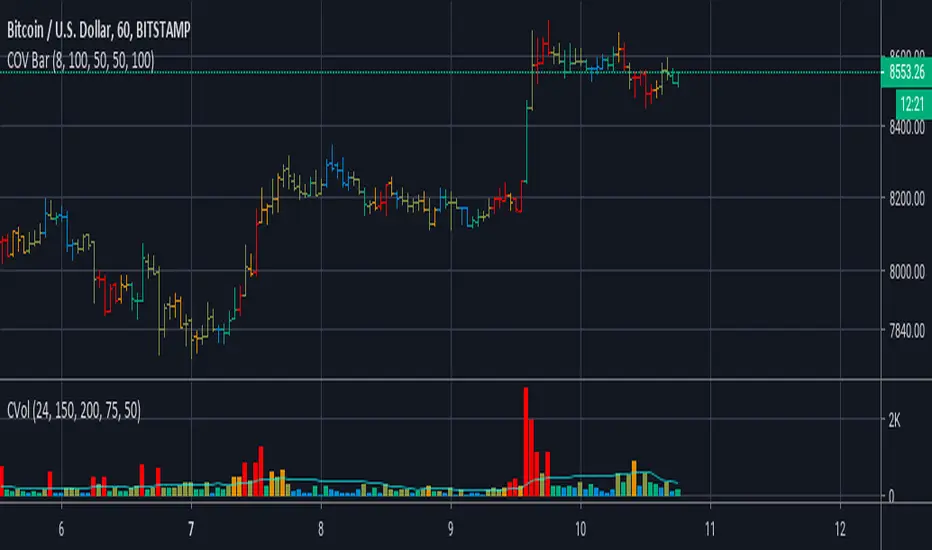
Cumulative Overlapping Volume BarsThis is cheap replacement for volume profile.
Red bars is where accumulated high volume in small range.
if new bar moves out of range all accumulated volume will be lost and color will change.
[RS]Volume BarsVolume Bars inspired by Richard W. Arms Jr. EquiVolume.
the bars change in width by the amount of volume within that bar.
see links in the source code for reference.
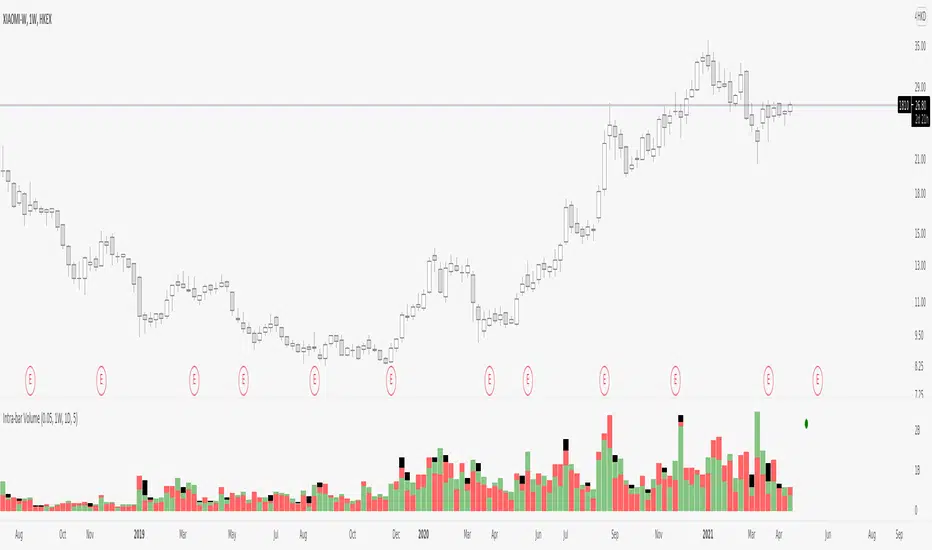
Intra-bar VolumeDisclamer : READ THIS BEFORE USING IT !!!
I have take and try to improuve the source code of indicator "intra-bar volume" by backtest-rookies.com
This indicator categorized the volume in lower timeframe, if the candle close up it's a buying volume, if it close down...
Beware that is not easy to work with different TF on tradingview so you have some limitation on the TF with this indicator. Also in TV we can't have a mutable variable in a security fonction.. so my approche is not clean but it works, if someone find better way, please comment or contact me :)
So by default the indicator can work on the following TF : 5m 15m 30m 60m 120m 240m 480m 720m 1D 1W 12M.
But ... this indicator need a lower timeframe and the number of bar to work correctly, in my code i suppose that the market run 24/7, so you need to adapte it or use intraday TF for other market.
To make sure that the indicator work correctly i have juste add circle, if it's green the buying+selling+balance volume is equal to the volume on the last close candle. If it's red theire is a problem.
I hope you enjoy it, feel free to modify the code and comment if you have any sugestion, i have just make it so maybe i will ajust some part of the code.
Bollinger BarsA partial implementation of Bollinger Bars, as developed by John Bollinger.
This seems to be as close as one can get to true Bollinger Bars with TradingView's current implementation of the Pine language.
It may be possible to complete one day.

PIN BAR INDICATOR real pin bar The indicator identify real pin bar candle (the shadow must be 2x the body)

B3 Bar Cycle MTF (fix)Apologies, there was an error in printing for the thick gray boxes, happened when MTF was switched on. All better, and here is the details from before:
This is an interesting study that can be used as a tool for determining trend direction, and also could be a trailing stop setter. I use it as a gauge on MTF settings. If on, you can look at the bar cycle of the 1h while on the 15m giving you a lot of information in one tool. If a line is missing high or low, it is because it was broken, if both exist you are trading in range and cloud appears. If both sides break you get thick gray boxes above and below bar.
Get used to editing the inputs to suit your liking. Often 3-5 length and always looking at different resolutions to get a big picture story. You could put multiple instances of the study up to see them simultaneously. I based the idea off of Krausz's 3 day cycle which you can read about in his teachings. I tend to find it looking better using Heikin Ashi bar-style.

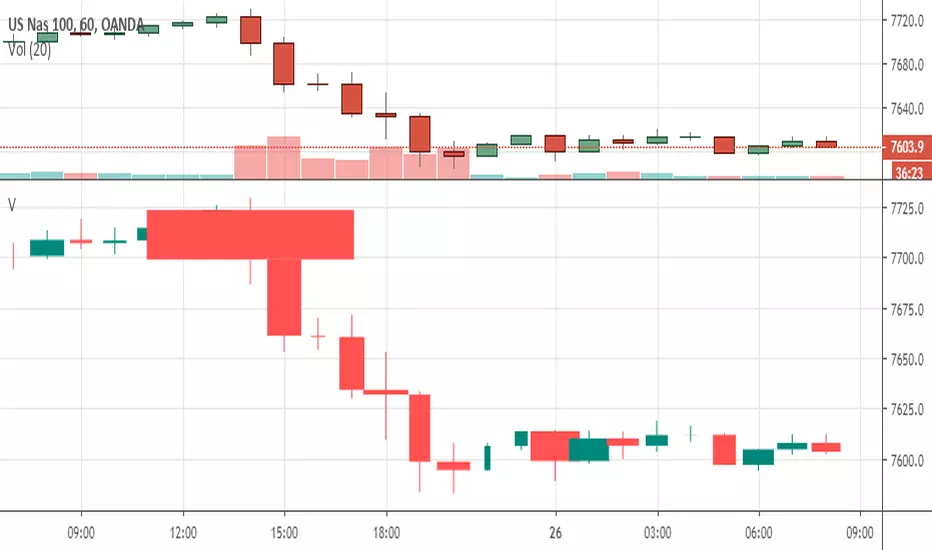
B3 Bar Cycle MTFThis is an interesting study that can be used as a tool for determining trend direction, and also could be a trailing stop setter. I use it as a gauge on MTF settings, in the pic MTF is turned off. If on, you can look at the bar cycle of the 1h while on the 15m giving you a lot of information in one tool. If a line is missing high or low, it is because it was broken, if both exist you are trading in range and cloud appears. If both sides break you get thick gray boxes above and below bar.
Get used to editing the inputs to suit your liking. Often 3-5 length and always looking at different resolutions to get a big picture story. You could put multiple instances of the study up to see them simultaneously. I based the idea off of Krausz's 3 day cycle which you can read about in his teachings. I tend to find it looking better using Heikin Ashi bar-style.


New Bar AlertThis is probably the simplest indicator on Tradingview, it generates an alert on every new bar.
Useful for strategies where you only need chart attention at the new bar, see if you have a setup.
Helps not having to stare at the charts, the alert will tell you when it's time to take a look.
Works on all timeframes but in order to keep your sanity, best used on higher timeframes, 5mins and up.
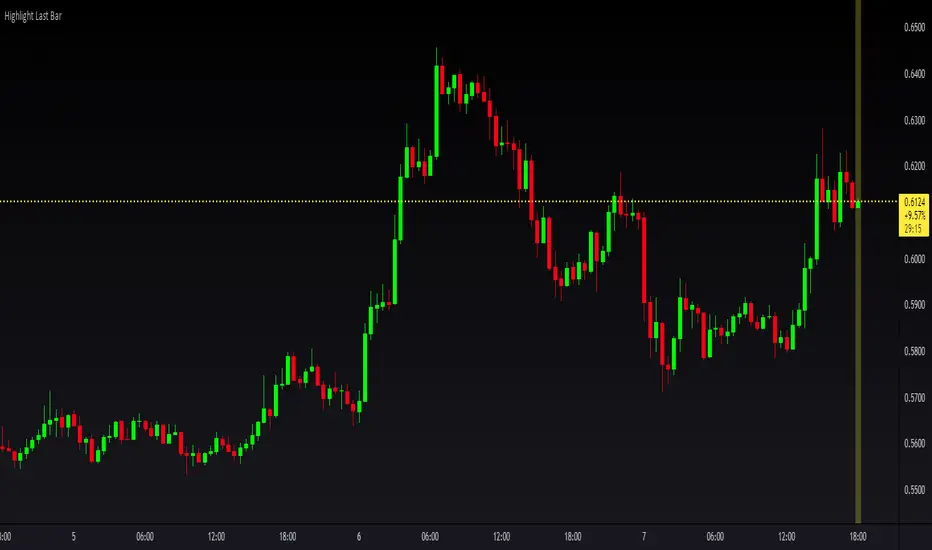
Highlight last bar, work on all timeframe, v4 & v5 @magnummHighlight last bar only. No refresh needed.
Works on all time frame and for version 4 & 5.
Can be added in your own scripts copy/pasting just one line.
//DON'T FORGET TO HYDRATE

Volume Bars and Regions of InterestThe bars are colored according to the volume traded. The volume weights were distributed logically for a better analysis.
<0.666 low volume
0.666 to 1.333 median volume
1,333 to 2,666 high volume
> 2,666 'institutional' volume
The moving average bands are the average of the highs and lows. They show a region of interest and not just a 'line'.

RSI BAR COLOR (KETT)RSI BAR COLOR
1) White - looking for a long
2) Orange - looking for a short
3) Gray - think
//-----------
1) Белый - ищем вход в LONG
2) Оранжевый - ищем вход в SHORT
3) Серый - думаем

Dreadblitz BarsThese bars can give you good opportunities if you know how to analyze the context.
blue=bullish
black=bearish
thumbs up
[LunaOwl] RSI 美國線 (RSI Bar, RSIB)Last year, I saw someone using the candle innovation called "RSI Candle" or "RSIC". so let me have the idea of making RSIB. the Candlestick was Steve Nison in the 1990s. He introduced the concept from Japan to America and published it in the book "Candlestick Course". Welles Wilder is the creator of the relative strength index. after several years of commodity trading, Wilder focused on technical analysis. In 1978 he published "New Concepts in the Technology Trading System". RSI is the new momentum oscillator mentioned in the book. then, if you use Bars to display RSI, it might be an artistic idea. everyone is familiar with the method of use.
以前看過人家使用 " RSI 蠟燭線 "(RSIC)的版本,於是就想做一下美國線的版本。1990年代史蒂夫.尼森將蠟燭線的概念從日本引進華爾街,並在《陰線陽線》詳細介紹;威爾德是 RSI 的作者,做商品交易的他專注於研究技術分析,1978年他出版《技術交易系統新概念》提到了這個。如果用美國線表示 RSI 會是另一個模樣。至於它的用法大家都很熟悉了。
The purpose of publishing Chinese Scripts is to make Pine close to more Chinese user.
發布中文腳本的目的,是希望可以讓 Pine 親近更多中文圈的使用者。

Inside Bar Visualizer PineV4I didn't find a study for Inside bar as I wanted. Therefore I wrote a one with PineV4. This may help you to see inside bars.
It can recalculate and works with either (opens-closes) or (highs-lows)
Cheers! :)
