Combo Backtest 123 Reversal & 2/20 Exponential MA This is combo strategies for get a cumulative signal.
First strategy
This System was created from the Book "How I Tripled My Money In The
Futures Market" by Ulf Jensen, Page 183. This is reverse type of strategies.
The strategy buys at market, if close price is higher than the previous close
during 2 days and the meaning of 9-days Stochastic Slow Oscillator is lower than 50.
The strategy sells at market, if close price is lower than the previous close price
during 2 days and the meaning of 9-days Stochastic Fast Oscillator is higher than 50.
Second strategy
This indicator plots 2/20 exponential moving average. For the Mov
Avg X 2/20 Indicator, the EMA bar will be painted when the Alert criteria is met.
WARNING:
- For purpose educate only
- This script to change bars colors.
Cerca negli script per "bar"

Strategy of Strategic Trend By TrendciHocaHello everyone, this strategies, which is actually the Strategic Trend indicators strategy, which is one of the most used indicators in the market, also has the following features.
In 15 min interval choosen speacial ATR and ATR multiplier by default it get more profit. The ATR is then a moving average, generally using 14 bars, of the true ranges. But as seen on strategy its changed the 11 for most profit for 15 min interval. You can change settings for different intervals. This indicator must combined with the Strategic Trend by TrendciHoca indicator. . You must change only ATR length and ATR multiplier part of on the strategy.
Barcolors change with crossover 1 bar EMA with cross with ATR value.

Delayed RSI StrategyThis strategy uses a 21 period RSI with an overbought (RSI indicator
is greater than) level of 60 (user defined) to determines long entries and an oversold
(RSI indicator is less than) level of 40 (user defined) for shorts. It introduces a bar delay that starts
counting when the RSI < Oversold or RSI > Overbought conditions are true, delaying the entry with
the amount of bars determined by the user. The trading logic can be reversed, which seems to work better.

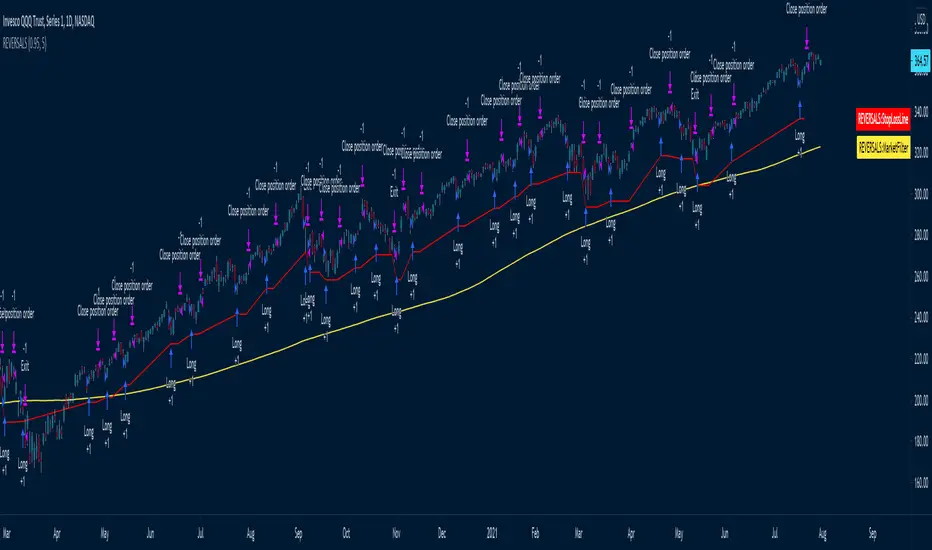
REVERSALS
The systems basically play reversals, it enters when the close is lower than its low of 5 bars ago to enter
It exits when the price is higher than the high of 5 days ago
Uses a 200 MA as a market filter, does not trade when the price is below its 200 Moving average
Uses a 5% stop, as per the red Stop Loss Line -- can be adjusted
The amount of bars it uses to look for reversals is set to 5 by default, but can be adjusted in settings.
Best to use on directional instruments where you know that the long term direction is up, for example:
TQQQ, SSO, SPX, SPY, or sector tickers -- but it would be best to include some more advanced filtering for sectors
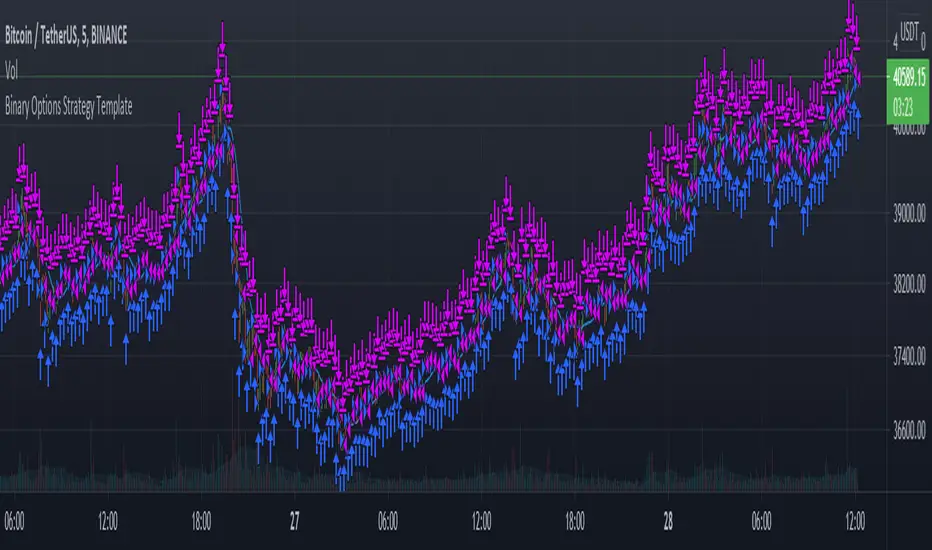
Binary Options Strategy TemplateWith the hype around Binary Options trading (more like gambling instead of trading) it is good to be able to backtest a strategy before using it in the live markets.
In a Binary Options trade the trade get's closed after a specific amount of time and the only thing that matters is if the market has increased in price or decreased after that amount of time.
Because of this a strategy backtest should close all positions after a specific amount of time. In this super small script the number of bars since the trade was opened is used as a way to close the position. So for example if you use this strategy on the 1 minute charts with number of bars set to 5 it will close the position 5 minutes after opening it. Purpose of this script is using it as a strategy on already existing scripts to check viability for options trading.
With the limited pine knowledge that I have I do not know if it is possible to create a more realistic binary options strategy which also calculated the profit. If someone knows a more advanced version of this please let me know.
BURST AlgorithmBURST is a trend catching system that uses a combination of time series data and current price to decide when to buy or sell. It colors bars green when it concludes that an uptrend is in effect and red on down trends. The bar coloring differs from the actual buy and sell signals the algorithm produces due to added features for optimization, however it can be used to aid manual trading. BURST was created to capture trend in digital assets and works best on the major coins, such as Bitcoin and Ethereum, on the 30min chart.
This is a long-only strategy.
Performance Summary is calculated using 80% of total equity, with fees and slippage accounted for.
If purchased, please do not use leverage. Past performance does not guarantee future results and high leverage can turn a profitable strategy into a losing one.

Godtrix's Crypto HA+RSI+EMA+ATH+DCA Strategy 3.0New Updates is here! Upgrade from previous version 2.0 (Please avoid using v2.0 as it's outdated.)
Great stability, Repaint bug fixes, and New features!
==================
| Introduction: |
==================
This is a Long Term Strategy, using compounding profit method, it can generate high returns, but it also risk for losses, this can be overcome if you set Stop Loss to over 25% for bitcoin & 60% for Altcoins.
Best profit plan with this strategy is you trade on Future leverage while you hold on to your coin, so that when price goes up, your coin value goes up, and at the same time, you trade with your leverage to earn even more, easily doubling up your total profit.
Benefits:
Fully customizable and you can easily personalized it and FINE TUNE it according to the market or coin you trading on.
The strategy is based on REAL PRACTICAL trading skills, so it works in real-world.
I fixed the "repainting" issue so the backtest it shows you IS ACCURATE when you run for real-time.
We all know one indicator is not going to help you win your trades, so this strategy combines ALL three: EMA for long+short term trend, HA for short term trend, RSI for entry/exit
This strategy is designed for LONG trade (Buy low, Sell high), not for SHORT trade.
This is not day trading, it is more to mid-term trading, where there's only few trades per month
Mainly is coded to work with 3Commas bot auto trading, so you only need to key in your Bot ID & Email Token.
Bot trading NOTE:
- You need to replace the Alert Message with this: {{strategy.order.alert_message}}
- And you'll need the Bot's webhook Url set with the Alert too.
- One Alert will work for both Buy and Sell Order
- If you using other Bot service, you can enter Custom Command in Input Settings too, it works on any bot service.
Lastly,
regarding the setting advice, I would say you try playing with different settings and your objective is to achieve a backtest result that has:
1) Profitable is > 80%
2) Losing trades is nearly 0 or below 25% of your winning trades. Trick is using far stop loss %
3) Net Profit be almost same or more than "Buy & Hold Profit"
==================
| Latest Updates: |
==================
=| Tidy Up Codings |=
- Group input fields so it'll be easier to understand and find the settings
- Upgrade code for obsolete 'transp' options
=| Repaint Issues |=
- Previous v2.0's RSI has repaint issue, creating false result against real-time data. I've fixed this.
- Also done fine-tuning other parts of the codes to prevent possible repaint issues.
=| Bot System |=
- Improved Custom Bot system, so that you're able to set dynamic order size/quantity with my custom keyword: and
Base Order Example:
{ 'message_type': 'bot', 'bot_id': 1234567, 'email_token': 'abcdefgh-1234-1234-1234', 'base_order': , 'delay_seconds': 0, 'pair': 'USDT_BTC'}
=| EMA Downtrend Exit |=
- Added option for you to decide whether to close position when detected EMA Long term downtrend.
=| EMA 2 (short term) is removed |=
- After several test, I've decided to remove this because it doesn't contribute to improving the results.
=| Heikin Ashi System |=
- Improved the chart display, now you'll see the HA candle 'shadowed' behind, so you'll see both actual price candle and HA candle at same time.
- Added the system that detect the HA candle sizes to decide specifically when it's suitable for Entry and Exit.
>> For "Entry/Exit Range"
- This means after HA is valid for Entry or Exit, how many following bars are allowed to stay valid so it will match other requirements to be completely fulfilled for Entry or Exit.
>> For "Crossing Interval"
- This means after detected HA line crossover, how many HA intervals is allow to Entry or Exit
>> For "Reversed Exit"
- This function let's you decide whether to close position if after HA bull (green candle) changed into HA Bear (red candle)
=| RSI A Entry |=
- Added option to avoid Entry during NTZ (No trade Zone)
- Also added the option to avoid next same condition RSI A entry too soon
=| RSI B Entry |=
- This function is for Entry if RSI is going very low, mostly due to bigger price drops in short time, it's good for buying DIP, however we'll never be able to know when a DIP ends, so do more test on this settings before put into real use.
- Added "avoid" options to help avoid getting Entry at "false" DIP, more like a short & fast pullback which causes RSI to drop very low but actually the price is near ATH or Recent High.
- Added option for Entry with Trailing Price Lower Buy combine with a limit order that grabs low price, so whichever it fulfill first.
=| New: Avoid Entry |=
- Well, it's a pain if you bought at the top, so I've added two options that will avoid buying near ATH and Recent High.
=| Time-limit Removed |=
- Sorry that I've missed look on the script policy which I'm not allowed to put a time-limit for public scripts.
=| System Improvements |=
- HA condition detection is optimized and bug fixed
- RSI values now reads accurately on each bar despite using higher timeframe, especially when moving to next interval
=| New: Dollar Cost Averaging (DCA) Orders |=
- Although DCA strategy is not appealing for Long term strategy, but I've added it for your extra options and flexibilities.
- The settings are quite straight-forward and standard, so I won't be explaining here.
=| New: Backtest Start & End Date |=
- This is very good function when you need more accurate result starting at specific date & time.
- Also if you set the date & time for your real trading starts, it'll much result the same as your actual trading records, which helps you to see clearer and make future decisions.
Any found bugs or flaws, please feel free to PM me, I can't get notifications from comments here below, so I'll not able to reply you the soonest possible, still not sure how to turn on notification for comments, anyone who knows can PM and teach me, lol... Thanks in advance!
Well, this is free version, hope it helps! Feedbacks are all welcome :)
(To Moderators: I've fully use the "f_security()" guideline, but instead of creating a separate function, I apply directly on all security() function. Please don't ban my script before fully check if I've truly fixed repaint. Thank you.)
BITSTAMP:BTCUSD COINBASE:BTCUSD COINBASE:ETHUSD BINANCE:BNBUSDT

levelTraderThis strategy can be used to play price levels with long or short setups. The idea behind is to have an automatic execution engine to long support levels or short resistance levels.
There are 9 levels that can be defined: Daily levels (solid), Weekly Levels (dotted) and 3 other additional levels (blue dotted).
The concept of the levels are based on Layup Futures trading room owner @Oblique (layuptrades.com)
Bias = Pivot Point , Bullish above, bearish below
Up-clue = Clue for more upside, last resort for bears
Down-clue = Clue for more downside, last resort for bulls
Each level can be selected for long or short plays, as well as a trail profit or fix profit taking strategy.
Trades are also executed in the specified timeframe (indicated by green arrows on the chart).
Additional rules can be configured:
- trade size
- profit targets
- stop loss
- No of tests to be played on each level
- Level distance control: Execution control is done via 30min closes (blue line) to avoid chop, trades are taken only if the prior 30min bar closes X points above or below a level (default is 2).
The current default settings are based on the daily plan from June 8th 2021 from Layup Futures that Oblique posts each morning before the open.
I personally use a 1min bar chart for back-testing and trade execution, but the script also works on 5min. Higher timeframes than 5min are not recommended.
There are two use cases how the levelTrader logic can be used:
- Backtesting of levels, how well long / short setups would have worked and how certain levels behave
- Auto Trading (I personally use the Trading View alert engine to trigger autotrades through the Oanda Broker API , when I am not able to trade at my PC).
The idea is basically to read the daily plan, decide which setups to take and then let the levelTrader execute all trades that I want.

Combo Backtest 123 Reversal & Recursive Moving Trend Average This is combo strategies for get a cumulative signal.
First strategy
This System was created from the Book "How I Tripled My Money In The
Futures Market" by Ulf Jensen, Page 183. This is reverse type of strategies.
The strategy buys at market, if close price is higher than the previous close
during 2 days and the meaning of 9-days Stochastic Slow Oscillator is lower than 50.
The strategy sells at market, if close price is lower than the previous close price
during 2 days and the meaning of 9-days Stochastic Fast Oscillator is higher than 50.
Second strategy
Taken from an article "The Yen Recused" in the December 1998 issue of TASC,
written by Dennis Meyers. He describes the Recursive MA in mathematical terms
as "recursive polynomial fit, a technique that uses a small number of past values
of the estimated price and today's price to predict tomorrows price."
Red bars color - short position. Green is long.
WARNING:
- For purpose educate only
- This script to change bars colors.

All in One Strategy no RSI Label - For higher dollar cryptoThis is the All in One Strategy without the RSI suggestion label that will work well for any of the crypto currencies trading above $500 so the overlay shows up better. I am using ETH as an example on this.
Based on some comments on my previously published script that has been replaced I have added Alert Conditions to this version that can be used in other bots. You can also copy and paste these alert conditions into the other All in One script I published for the lower priced cryptocurrencies.
To use the alert conditions I have in here, you will need to convert this strategy into a study to do so. Delete the entry and exit logic at the end (lines 299 through 351), delete line 18 and paste the following in place of line 18:
study(shorttitle='Ain1 No Label',title='All in One Strategy no RSI Label', overlay=true, scale=scale.left)
Here are the settings to mimic what you see here in the back test strategy I am publishing. Remember that previous results do not guarantee future results.
Chart Time = 30 Minutes (if you didn't read my original All in One post, read it. Shorter isn't better. You lose your money faster in a shorter amount of time and I learned that the hard way)
Start Time = 1 April 2021 00:00
End Time = 31 December 2021 00:00
Trade Type = Long/Short
Stop Loss % = 20.1
Take Profit % = 14.57
RSI Length = 20
Overbought = 44
Oversold = 45
EMA Fast Length = 5
EMA Slow Length = 15
Overbought Lookback Minimum Value = 62
Overbought Lookback Bars = 3
Oversold Minimum Value = 43
Oversold Lookback Bars = 5
Source = Close
Max Lookback Period = 5
Use EMA Only = True (check the box)
K = 9
D = 17
K Mode = SMA
High Source = ohlc4
Low Source = ohlc4
Properties - Starting Amount is $3500, everything else is the same.
Any questions, feel free to ask. I will answer as soon as I can.

Dankland Playground Moneymaker - V2“version 2” of my playground bot script. Its essentially a powerhouse suite of strategies. Although it is similar to the previous script, it nets different results as sections have been changed. Such as the somewhat reluctant removal of the Chande Momentum... The RSIs have also been updated, this was one of the main changes. RSIS now include a Moving Average cross of RSI to generate signals above and below the given thresholds instead of simply on crossing a threshold. This should give greater functionality overall. Most functions including Moving Averages have been updated to include a wider range of kinds of moving averages. This includes not just the moving average cross, but MACD and RSIs as well. I tried to perform the same upgrade on the %B, Stochastics and SMI, but hit the unpacked code limit of 60,000 lines... So, more “versions” will have to come for future “upgrades”, with the recognition that there will be cases where the old, “downgraded” versions may perform better and that some people (like myself) may continue to use them on some markets until I/we devise superior settings on the new ones for said markets. For instance, instead of replacing my 1 hr BTCUSD bot (where I used the now deleted Chande to pretty pleasing affect...) I made a new one for LINKUSD 10 min so I can have both running for now and work on replacing the BTCUSD later.
How it works basically is this... you have 16 oscillators which can all be used as independently as you wish. They can be split up into different groups or ran all together.
When in separate groups they should not be able to sell eachothers positions without triggering a full stop loss by turning the Independence/Stop All switches on. Every single oscillator has its own entry and exit position sizing which can be stated as either a percent of balance or a flat amount of contracts (or both combined). Each oscillator has a minimum amount of profit you can tell it to sell it, which is calculated from the average cost of your current position, which does include all groups. This works out to help you average out better entry and exit prices, essentially a method of DCAing.
You can set the minimum sale amount, which is to keep it from placing orders below your exchanges minimum dollar trade cost.
All this functionality combined also ensures more accurate back tests by ensuring that the script simply cannot spend money it doesn't see as in the balance, whereas other scripts will use a percentage of equity, and once 100% of your equity is in BTC for instance, it will keep buying more BTC for free and thus spoof up backtest numbers. If you look through the strategies here, many people claim to have amazing scripts and then you look into it and this is happening and skewing their numbers. These people are either very ignorant or what they made or scam artists and trolls in my opinion.
This version also includes On Bar Close switches for each oscillator. When switched on, signals are only allowed to generate on Bar Close. This helps to prevent retriggering from live signals, which when you are running this many oscillators, will become a problem! However, in most cases, you do not need to generate signals intrabar, as backtests will show, ignoring intrabar buys and sells (intrabar stop losses can still be very important though!) won't exactly keep you from high profitability strategies, but rather, allowing elements of chaos from live indicators moving up and down intrabar will, in fact, drift your actual results further and further from the backtest. You want an accurate backtest though. So choose wisely when you turn these off and you will do better.
The included oscillators are as follows:
NO MORE Chande Momentum cross – REMOVED – I was hitting PINE code limits here so I had to make choices and this one simply had to go. Begone!
Moving Average Cross
MACD cross
%B Bollinger cross
Stochastic cross + region filter
Stochastic RSI cross + region filter
SMII cross and region filter
Three RMIs
Know-Sure-Thing line-cross
Coppock Curve line-cross
TRIX line-cross
RSI of MA w/ MA cross
RSI of MA of KST w/ MA cross
RSI of MA of Coppock Curve w/ MA cross
RSI of MA of Trix w/ MA cross
So the idea is that this is essentially multiple strategies combined into one backtestable house. Balance is calculated for all position sizes in order to try to prevent false entries that plague so many scripts (IE, you set pyramiding to 2, each buy $1000, initial balance $1000, and yet it buys two orders off the bat for $2000 total and nets 400% profit because the second was considered free, happens on 90+% of scripts on Tradingview if you aren't very very careful!)
You tune each indicator and position size them so that they work together as well as you can and in doing so you are able to create a single backtest that is capable of running a bot, essentially, between multiple strategies - you can run a slower Moving Average cross, a faster SMI cross or MACD , or Bollinger that grabs big moves only, all the while having MACD trade small bonuses along the way. This way you can weight the Risk to Reward of each against eachother.
I will not try to claim this is something you can open and with no work have the best bot on the planet. This scripts intention is to take a lot of relatively common trading strategies and combine them under on roof with some risk management and the ability to weigh each against eachother.
If you are looking for a super advanced singular algorithm that tries to capture every peak and valley exactly on the dot, this is not for you. If you are looking for a tool with a high level of customizability, with a publisher who intends to update it to the best of his ability in accordance to seeking to make the best product that I personally can make for both myself and the community (because I will be using this myself of course!) that was specifically designed with the intention of performing well in spot markets by averaging low entry costs and high exit costs, this is for you! That is the exact intention here. It can certainly work with margin, but you will have to take extra care in setting your stop losses. I intend to make a version capable of going short which will be included as part of the package. It may take some work to keep all of the risk management working as well for shorts though. There will be more scripts added to the “package” as I hit the limit on this one a few times and have had to keep some ideas out already.
The current backtest shown is hand-optimized by myself for Link /USD 10min market (Binance US – shouldn't need much work to fit to other exchange markets) with multiple stop losses.

Heikin-Ashi MACD"Heikin-Ashi, also sometimes spelled Heiken-Ashi, means "average bar" in Japanese. The Heikin-Ashi technique can be used in conjunction with candlestick charts when trading securities to spot market trends and predict future prices. It's useful for making candlestick charts more readable and trends easier to analyze. For example, traders can use Heikin-Ashi charts to know when to stay in trades while a trend persists but get out when the trend pauses or reverses. Most profits are generated when markets are trending, so predicting trends correctly is necessary."
HA bars help us to smooth the price action, and I think MACD gives me a lot of signals and I need to eliminate them and add MACD strategy on Heiken-Ashi candles to look performance.
Mostly, it eliminates %75 of the signals, and most of the time it did increase backtest performance significantly.
There is still a way to it to combine other indicators for complete strategy, but at least We can achieve better MACD with this approach.

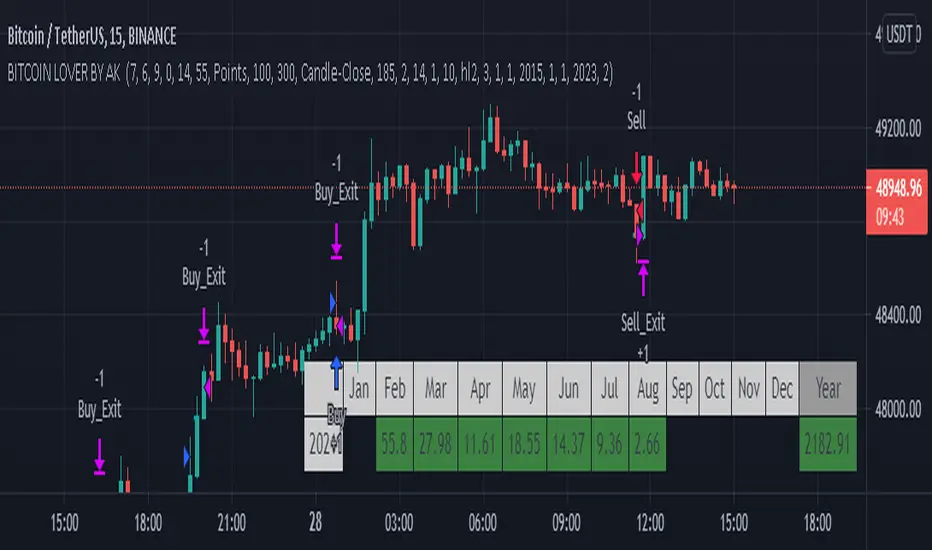
Bitcoin lover by Akthis strategy used to determine and anticipate potential changes in market price and reversals. The Highs referred to in the title are created based on the number of bars that exhibit lower highs on either side of a High, whereas the Lows are created based on the number of bars that exhibit higher lows on either side Low.it also analyzing price changes and reversals, a trader has more of an ability to determine and predict price patterns and general price trends...It take profit on pre define 500 points.. u can also change is take profit level. .and also added max intraday trades..so it help in risk management
brokerage added 0.02% and slippage added 20.
How it works??
It calculate swing on 5min chart.. When swing high is break it shows buy signal and when swing low is break it show sell signal.. And it book profit on 500 points.. U can also change profit points. .After booking profit if high or low of price break it again show buy and sell signal.. U can also use it with trend lines and moving average for better entry and exits..
I hope this will help trader for find out trends and profit booking and if u want to use it with comment strategy action you have to just add comment in comment box
caution: always follow risk management before using strategy
Combo Backtest 123 Reversal & Money Flow Indicator This is combo strategies for get a cumulative signal.
First strategy
This System was created from the Book "How I Tripled My Money In The
Futures Market" by Ulf Jensen, Page 183. This is reverse type of strategies.
The strategy buys at market, if close price is higher than the previous close
during 2 days and the meaning of 9-days Stochastic Slow Oscillator is lower than 50.
The strategy sells at market, if close price is lower than the previous close price
during 2 days and the meaning of 9-days Stochastic Fast Oscillator is higher than 50.
Second strategy
Indicator plots Money Flow Indicator (Chaikin). This indicator looks
to improve on Larry William's Accumulation Distribution formula that
compared the closing price with the opening price. In the early 1970's,
opening prices for stocks stopped being transmitted by the exchanges.
This made it difficult to calculate Williams' formula. The Chaikin
Oscillator uses the average price of the bar calculated as follows
(High + Low) /2 instead of the Open.
The indicator subtracts a 10 period exponential moving average of the
AccumDist function from a 3 period exponential moving average of the
AccumDist function.
WARNING:
- For purpose educate only
- This script to change bars colors.

JBravo Swing with GoGo JuiceThis follows Johnny Bravo Dominate Stocks strategy. When a full price bar closes above SMA 9, this indicates a buy. When the price bar closes below EMA20, this indicates a sell. If the MAs are all sloping up and aligned in order 9,20,180, then this indicates a Strong Buy. If the MAs are all sloping down and aligned in order 180,20,9, then this indicates a Strong Sell.
In addition, when VWAP crosses above the EMA20, "GoGo Long" is indicated on the chart. When VWAP crosses below the EMA20, "GoGo Short" is indicated on the chart. JBravo refers to this as the GoGo juice.

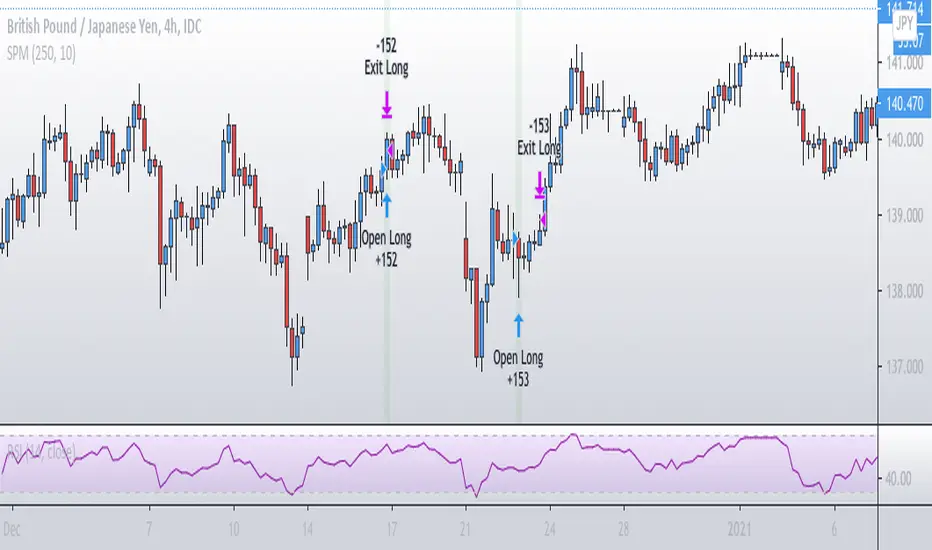
Simple Price MomentumSimple Price Momentum Strategy ( SPM )
The term momentum was borrowed from Newton’s first law of motion. The law states that where an object in motion tends to stay in motion until an external force is applied to it. Like in the law of physics, a market in motion tends to stay in motion rather than reverse. This is the reason why a momentum indicator strategy is so powerful.
My algorithm depends on two signals, an open and an exit.
Basically, while the Green shows earlier, the signal actually takes place at the end of the bar. Remember “close” source is the current price while the candle is still forming, because it can change its state it could create a situation where “A > B” and then change to “A < B”, so we don’t know which one is the final value until the bar officially ends. This is why the backtest engine opens a position in the bar after.
Ultimate Oscillator [Long] StrategyAfter I published Short Selling strategy with RSIofUO , I have been working for Long side strategy with same indicator.
but for Long strategy , I have used only the Ultimate Oscillator ... (Not the RSI of UO)
Logic behind this is , when UO goes below oversold level , high chance of possible reversal from there ...
Ultimate Oscialltor values , I have used are 5, 10 and 15
Signal Line 9
Above values are best/defaulted based on testing the strategy multiple symbols
BUY
when UO crossing up buyLine and close > open ( if the cross over is already done , it will wait for 3 candles to see a green bar i.e close>open )
Note when the bar color changes to orange , that means startegy is ready to take LONG position on next bar. But dont jump here , waith for the startegy take the Long Position :-)
Add
Signal appears when there is divergence (marked in yellow color ) ... strategy doesnt add the position , it is ony indicating you could add to existing OR if you missed the BUY signal you could enter here
Partial Exit
when UO crossing down partial exit level
Exit
When UO crossing down sell line
StopLoss
stop loss defaulted to 3%
Please note , I have slightly modified stop loss exit in this strategy.
Even though price hits 3% stoploss , strategy wont wind up the position ...
First , it will check if RSIofUO is above 30 , then it will hold on to the Long position.
Very reason behind this is , price is falling down and UO is going up ... That means there is bullish divergence here .. so it might turn this losing position to profitable one or will exit you with less than 3% loss.
Tested with SPY , QQQ , TSLA on 30mins to 4hrs. Though winning rate is average , net profit is exponential ...
Best working on 30 mins and 1 HR chart for QQQ
Warning
For the eductional purposes only ...
This is not a financial advise , before taking trading decission please do your own research

Momentum Strategy (BTC/USDT; 30m) - STOCH RSI (with source code)Here's a strategy for low time frames (30min suggested) for BTC , based on momentum Analysis using Stochastic RSI
By default the strategy will use the 50% of the specified capital for each trade; if "Gamble Sizing" is enabled, it will add the specified amount of capital (25% by default, until reaching the 100% limit or lower) for the next trade after having detected a loss in the previous trade; if the next trade is successful, the size for the next trade comes back to 50%
• Trend Filter LONG: If the fast exponential moving average is UNDER the slow exponential moving average , it won't open LONG positions
• Trend Filter SHORT: If the fast exponential moving average is ABOVE the slow exponential moving average , it won't open SHORT positions
• Bars delay: the strategy will wait the specified amount of bars before closing the current position; the counter is triggered as soon as the closing trade condition is verified
BY MAKING USE OF THIS STRATEGY, YOU ACKNOWLEDGE AND AGREE THAT: (1) YOU ARE AWARE OF THE RISKS ASSOCIATED WITH TRANSACTIONS OF DIGITAL CURRENCIES AND THEIR DERIVATIVES; (2) YOU SHALL ASSUME ALL RISKS RELATED TO THE USE OF THIS STRATEGY AND TRANSACTIONS OF DIGITAL CURRENCIES AND THEIR DERIVATIVES; AND (3) I SHALL NOT BE LIABLE FOR ANY SUCH RISKS OR ADVERSE OUTCOMES.
SOURCE CODE BELOW

Momentum Strategy for cryptos (V7.B.4)Here's a strategy for low time frames (30min suggested) for BTC, based on momentum Analysis using Stochastic RSI
By default the strategy will use the 50% of the specified capital for each trade; if "Gamble Sizing" is enabled, it will add the specified amount of capital (25% by default, until reaching the 100% limit or lower) for the next trade after having detected a loss in the previous trade; if the next trade is successful, the size for the next trade comes back to 50%
• Trend Filter LONG: If the fast exponential moving average is UNDER the slow exponential moving average, it won't open LONG positions
• Trend Filter SHORT: If the fast exponential moving average is ABOVE the slow exponential moving average, it won't open SHORT positions
• Bars delay: the strategy will wait the specified amount of bars before closing the current position; the counter is triggered as soon as the closing trade condition is verified
BY MAKING USE OF THIS STRATEGY, YOU ACKNOWLEDGE AND AGREE THAT: (1) YOU ARE AWARE OF THE RISKS ASSOCIATED WITH TRANSACTIONS OF DIGITAL CURRENCIES AND THEIR DERIVATIVES; (2) YOU SHALL ASSUME ALL RISKS RELATED TO THE USE OF THIS STRATEGY AND TRANSACTIONS OF DIGITAL CURRENCIES AND THEIR DERIVATIVES; AND (3) I SHALL NOT BE LIABLE FOR ANY SUCH RISKS OR ADVERSE OUTCOMES.

Optimized Trend Tracker STRATEGY & SCREENEROptimized Trend Tracker - OTT STRATEGY & SCREENER screens the BUY and SELL signals (trend reversals) for 20 user defined different tickers in Tradingview charts.
Simply input the name of the ticker in Tradingview that you want to screen.
Terminology explanation:
Confirmed Reversal: OTT reversal that happened in the last bar and cannot be repainted.
Potential Reversal: OTT reversal that might happen in the current bar but can also not happen depending upon the timeframe closing price.
Downtrend: Tickers that are currently in the sell zone
Uptrend: Tickers that are currently in the buy zone
Screener has also got a built in OTT indicator which users can confirm the reversals on graphs.
Screener explores the 20 tickers in current graph's time frame and also in desired parameters of the OTT indicator.
Also you can optimize the parameters manually with the built in STRATEGY version.
Optimized Trend Tracker indicator :
Built in Moving Average type defaultly set as VAR but users can choose from 8 different Moving Average types like:
SMA : Simple Moving Average
EMA : Exponential Movin Average
WMA : Weighted Moving Average
TMA : Triangular Moving Average
VAR : Variable Index Dynamic Moving Average aka VIDYA
WWMA : Welles Wilder's Moving Average
ZLEMA : Zero Lag Exponential Moving Average
TSF : True Strength Force
Tip: In sideways VAR would be a good choice
You can use OTT default alarms and Buy Sell signals like:
1-
BUY when Prices are above OTT
SELL when Prices are below OTT
2-
BUY when OTT support Line crosses over OTT line.
SELL when OTT support Line crosses under OTT line.
3-
BUY when OTT line is Green and makes higher highs.
SELL when OTT line is Red and makes lower lows.
IMPORTANT: SCREENER ONLY EXPLORES AND SCREENS FOR THE 2nd SIGNAL TYPE:
BUY when OTT support Line crosses over OTT line.
SELL when OTT support Line crosses under OTT line.

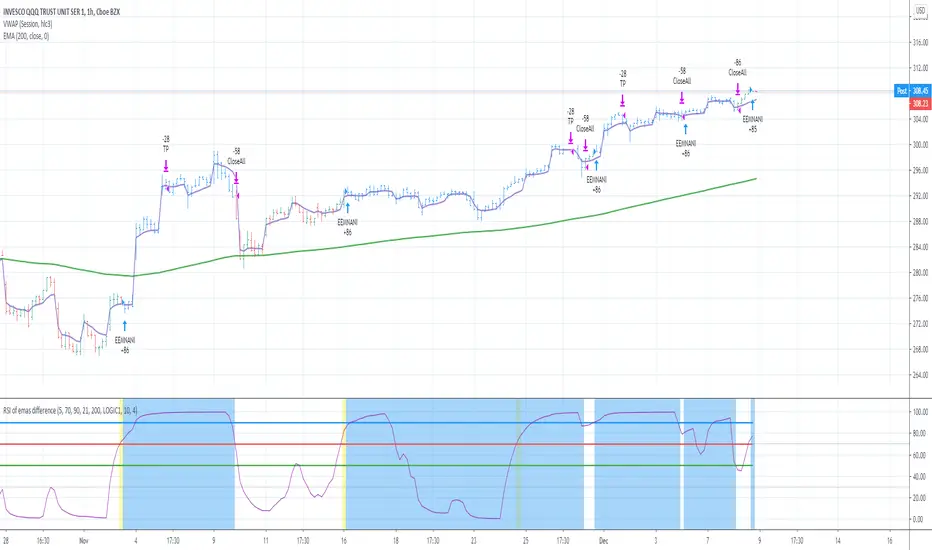
RSI of emas difference [ EEMANI ]This strategy is found by error.
Initially I started to find the weekly version of RSIofVWAP strategy. somehow I didn't see good results. Then , on the same script I did change it to find rsi emas difference strategy.
while changing the code , for the long term ema /slow ema input , I had entered fastema value instead of the price close. That is the error.
But strategy showed good results , then I extended it to add stop loss and take profits. Since this is found by error, I cant explain much how it is working.
Please check if your symbol works with this strategy and let me know ... your feedback is greatly appreciated to improve the strategy ...
I name it as EEMANI strategy
BUY
======
When the RSIofEMAsdiff is crossing above 70 (buy Line) and fastEma is rising
Note:
On the indicator it shows yellow background ... thats the entry point ....
when strategy is already in Long position , if you see yellow back ground thats where you can add or enter if you missed earlier signal
background and bar color color changes to blue when strategy is in Long position
Partial Exit
=========
when RSI value reaches 99 , 1/3 of the position si closed with profit
Close
======
when RSI value crossing down 90 (exitLine)
Stop Loss
=========
defaulted to 4% (increasing this value might improve the performance , but number of bars will go high , that means you need to wait longer time to get out of the trade ... Thats boring !!!
Note :
I have added two formulas , both of them are produce similar results. But different equities on different logic. check which formula is working for you
LOGIC1 => fastEMAval-slowEMAval
LOGIC2 => (slowEMAval+fastEMAval)/weeklyVwap
Warning
=========
For the use of educational purposes only
Cyatophilum Scalper [BACKTEST]This indicator comes with a backtest and alert version. This is the backtest version. Its purpose is to create low timeframe and scalping strategies, by choosing from a list of built-in entry points which are described in detail below, and by configuring a risk management system to your liking.
Before diving into the entry points, I will explain the strategy and risk management settings.
These 3 settings allow to choose your strategy direction, and main behavior.
- Go Long ↗: activate or deactivate long entry points.
- Go Short ↘: activate or deactivate short entry points.
- Reversal strategy ↗↘↗↘: Activate this option will allow trades to reverse position from an opposite entry point. Keep it deactivated and trades will either wait a TakeProfit(TP) or StopLoss(SL) to be closed. When neither SL nor TP or set, this option is automatically activated.
StopLoss settings:
Both Long and Short SL can be activated and configured.
The base % price is the starting point of the stoploss, in a percentage of current price.
Trailing stop, when activated, works with 2 settings:
- % Price to Trigger: a percentage of current price the price should move in a bar to trigger a trailing movement.
- % Price Movement: the stoploss variation in a percentage of current price that moves on each bar.
TakeProfit settings:
Both Long and Short TP can be activated and configured.
The base % price is the value of the TP, in a percentage of current price.
Trailing Profit Deviation %: Percent deviation for the trailing take profit.
DCA:
DCA stands for Dollar Cost Average. The idea is to open additional orders from the base order so as to improve risk management.
These additional orders are also called Safety Orders. The indicator can handle up to 9 safety orders.
The strategy will exit either from a take profit based on percentage from base order or from a total volume percentage (Configurable in the parameters).
The steps spacing (space between each step) and safety orders volume (order size) can both scale by adding a scale multiplier.
By choosing from the base strategy dropdown menu, the indicator will generate entry points.
1. BUY SELL:
-> Low timeframes spot trading, with simple buy and sell orders.
How it works:
The indicator used is a combination of QQE (Atr based trend following indicator) and RMA 100 trendline.
I think the QQE does a great job in low timeframes because it is not impacted by the noise.
The RMA which is the moving average used in the RSI, will help giving confirmation to the entry points.
How to use:
It is meant to be used as a reversal strategy, but you can add a TP or SL if you want.
When comparing to Buy & Hold, make sure to deactivate the "Short results in the backtest" setting.
2. TREND SCALPING
-> A strategy for low timeframes trading.
How it works:
The strategy creates high volatility entries filtered by a duo convergence of adaptive trendlines (Adaptive HULL MA using the chart's resolution, Adaptive Tilson T3 using 1H resolution) and a higher timeframe (1H) RSI filter (long threshold: 70, short threshold: 40, RSI length: 10).
How to use:
Must be used on charts with a resolution smaller than 1H. Recommended: from 1m to 30m.
Must NOT be used as reversal strategy. Use it with a take profit and stop loss, and DCA if you can.
Sample risk management settings:
3. Support/Resistance BREAKOUTS
-> Trade low timeframes pivot points breakouts.
How it works:
The indicator calculates the 100 previous bars swing high and low. Any break above high or below low will trigger an entry point.
The entry is however filtered by an Adaptive Tilson T3 Trendline, an ADX 30 minimum threshold and a minimum average volume threshold.
How to use:
I recommend to click "Reversal" Strategy and set a Takeprofit target.
Find the best timeframe between 1m and 30m using the backtest version.
Example here with BTCUSDTPERP on 15m:
4. AGGRESSIVE SCALPING
-> Lots of trades in low timeframes.
How it works:
Created using Cyato AI, Higher/Lower Highs and Lows and 2 HULLMA crosses as entries, and 2 Adaptive Tilson T3 as trendfilter, a 25 ADX threshold filter and a volume filter.
How to use:
Recommended Risk Management settings: Takeprofit, Stoploss and DCA (Safety orders).
Find which timeframe work the best from 30 min and below. Should not be used above 30 min since this is the resolution for the MTF Tilson.
How to create Strategy Alerts:
Write your alert messages for EXIT, LONG and SHORT orders in the settings (Backtest section).
Then click add alert, and in the alert message, write the following:
{{strategy.order.alert_message}}
BACKTEST PARAMETERS
- Inital capital: 10 000$
- Base order size: 0.1 contract (0.1 btc)
- Safety order size: 0.1 contract (0.1 btc)
- Commission: 0.1%
- Slippage: 100 ticks
Oldest trade: 2020-08-31
Backtest Period: From 2020-08-31 to 2020-11-12
Configuration used: see the live chart configuration panel at the top.
To gain access to this paid indicator, please use the link below.

Trading Safely Market Crusher Pro Strategy BuilderWith The Market Crusher Pro You Can Build Trading Strategies For Options, Futures, Cryptocurrencies, Equities, Commodities, Currencies, and Stock Market Indexes.
The Market Crusher Pro Buy And Sell Strategy Builder gives you the ability to back-test all tradeable markets. You can back test using specific trading times on any chart time frame before you execute any trades for both manual trading and automated trading.
The Market Crusher Pro Buy & Sell signals are determined utilizing our price range volatility algorithmic technical indicator designed to generate alpha.
The Market Crusher Pro Buy & Sell signals will only be visible during your specified trading times.
The Market Crusher Pro Profit Targets are determined in percentages and you can take profit up to 4 times per trade.
I suggest setting limit orders at profit targets.
To determine how much of position to close divide position size by number of profit targets
Example: If your position size is 100k and you are in a Long trade set 4 limit sell orders of 25k each at your 4 profit targets.
*Percentage of position to be closed for each trade is set to 25% however, you can adjust this to take profit 3 times by changing settings on 1st, 2nd, and 3rd profit targets to 33.3%, or 2 times by changing 1st and 2nd profit targets to 50%
Highlights:
Add to any ticker, and time frame
Specify trading times
Specify both long and short profit targets in percentages
Take profit up to 4 times per trade
Use either a fixed stop loss or a trailing stop loss or both
Set Strategy alerts
Prints on the current bar in real time
DOES NOT repaint several bars after the fact
*We only use candles for trading and back testing because, Heikin Ashi, Renko, Kagi, Point & Figure, and Range produce unrealistic results.
*Back test results below are based on a initial capital of $5000 and Trade using 10% of initial capital.
Please Note: For forex trading to enter a trade on EURUSD for example the spread is typically 1.2-2.0 pips to enter a trade so you are not charged a commission on every market buy or sell or for limit orders set at profit targets. We are not able to input this into back test settings.
Example: If you open a 100k position it will cost you $12-$20 assuming the spread is 1.2 to 2.0 pips
Please Note: All users get access to weekly trading and strategy building sessions and a interactive Q&A. You can get more information on these benefits as well as get access to the strategy builder by clicking the MC PRO link listed in signature section below
