Bar MagnifierMany times while developing algos based on patterns and reversals, I come across issues which needs lower timeframe inspection. Loading multiple charts and comparing equivalent lower timeframe is slightly cumbersome at times. Hence, I thought of building this simple tool - which will instantly provide me lower timeframe candles for given candle. Since the candle selection happen via confirmed time input, we can use this as slider to move from one candle to other for inspection.
🎲 Usage
🎯Loading the script
When you load the script, a prompt appears which asks you to select a time by clicking on the chart.
Select the bar you want to magnify and study
🎯Components
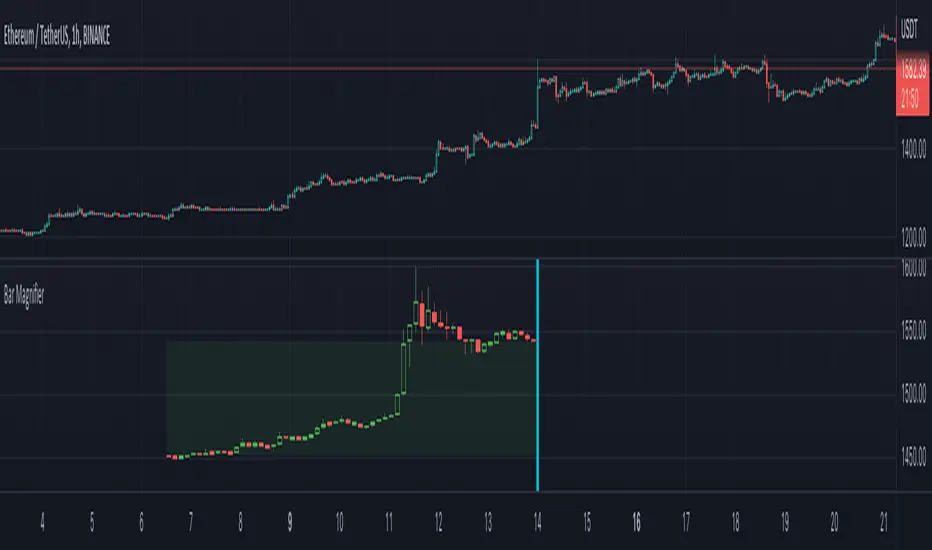
Once loaded, you can see the marker which tells which bar is magnified. And you can also see all the lower timeframe candles before that point. Please note that due to pine restrictions, we can only show last 250 lower timeframe bars. You can change the lower timeframe via settings to cover if the chart timeframe is very high.
🎯Moving to different bars
Click on the middle of the marker, you will see slider which you can slide to move from one bar to other.
Example, after sliding, you will see the lower timeframe data of new candle.
🎯Settings
Settings has only two inputs.
Bar time - selects the bar which needs to be inspected.
Lower timeframe - Default is 1 min. And select a timeframe according to your chart timeframe. Less than 1 min is not supported by security.lower_tf function. Hence, will not work.
Cerca negli script per "bar"
Bar Replay Fix - Smooth Candle Transition for TradingViewThe Bar Replay Fix indicator addresses a known issue in TradingView’s Bar Replay mode, where the last completed candle is incorrectly drawn when switching from a lower timeframe to a higher one. This issue can create confusion during analysis, especially when replaying historical price action.
Key Features:
Accurate Candle Rendering: Ensures that candles are displayed correctly in Bar Replay mode by referencing and plotting the previous candle data.
Customizable Appearance: Configure the candle body, wick, and border colors for bullish, bearish, and doji candles to match your chart theme.
Seamless Integration: Works invisibly in the background to provide a smoother and more reliable replay experience.
Use Cases:
Enhance your backtesting accuracy by eliminating incorrect candle rendering during Bar Replay.
Maintain consistency in candle visualization when transitioning between timeframes in Replay mode.
Disclaimer: This indicator is specifically designed to resolve a visual issue in Bar Replay mode and does not provide any trading signals or analysis recommendations.
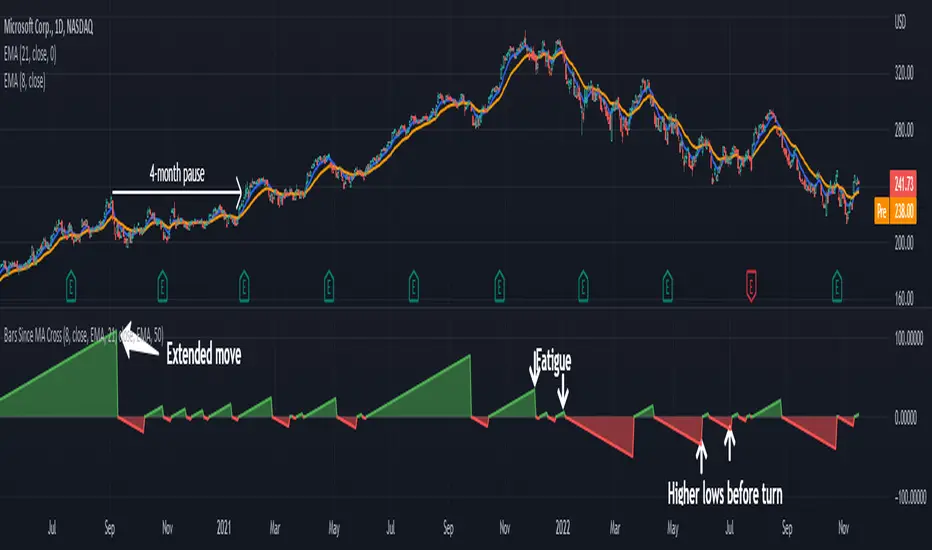
Bars Since MA Cross Can Help Trend FollowingMoving average crosses are popular signals for trend followers. Like many conditions, they tend to reverse after a certain amount of time. Today’s script is designed to help traders visualize and interpret these turns.
Bars Since MA Cross counts how many bars have passed since a fast-moving average crossed a slower MA. Bullish readings, with the faster MA above the slow, are plotted with positive numbers. The opposite is true for bearish conditions. Users can choose between simple, exponential and weighed average types. They can also mix them, comparing a fast EMA for a slower SMA, for example.
By default, it uses the 8- and 21-day EMAs.
This approach can help in a couple of ways. First, it can show divergences as a move weakens. Microsoft, in the example above, had a shorter bullish phase as it made new highs last December. This was followed by even briefer periods in January before the bear market took hold.
Likewise in May and June, Bars Since MA Cross showed shorter bearish periods before July’s counter-trend rally.
The second potential application is to know the age of a move. In this case look at September 2020. MSFT’s 8-day EMA was above its 21-day EMA for 108 days. The chart shows this was unusually long by previous examples, giving traders a sense the rally was getting long in the tooth. (MSFT would go the rest of that year without a new high.)
In conclusion, Bars Since MA Cross judges a move by its age and not its intensity. It’s a different approach that can sometimes help more than viewing simple price action.
TradeStation has, for decades, advanced the trading industry, providing access to stocks, options, futures and cryptocurrencies. See our Overview for more.
Important Information
TradeStation Securities, Inc., TradeStation Crypto, Inc., and TradeStation Technologies, Inc. are each wholly owned subsidiaries of TradeStation Group, Inc., all operating, and providing products and services, under the TradeStation brand and trademark. You Can Trade, Inc. is also a wholly owned subsidiary of TradeStation Group, Inc., operating under its own brand and trademarks. TradeStation Crypto, Inc. offers to self-directed investors and traders cryptocurrency brokerage services. It is neither licensed with the SEC or the CFTC nor is it a Member of NFA. When applying for, or purchasing, accounts, subscriptions, products, and services, it is important that you know which company you will be dealing with. Please click here for further important information explaining what this means.
This content is for informational and educational purposes only. This is not a recommendation regarding any investment or investment strategy. Any opinions expressed herein are those of the author and do not represent the views or opinions of TradeStation or any of its affiliates.
Investing involves risks. Past performance, whether actual or indicated by historical tests of strategies, is no guarantee of future performance or success. There is a possibility that you may sustain a loss equal to or greater than your entire investment regardless of which asset class you trade (equities, options, futures, or digital assets); therefore, you should not invest or risk money that you cannot afford to lose. Before trading any asset class, first read the relevant risk disclosure statements on the Important Documents page, found here: www.tradestation.com .
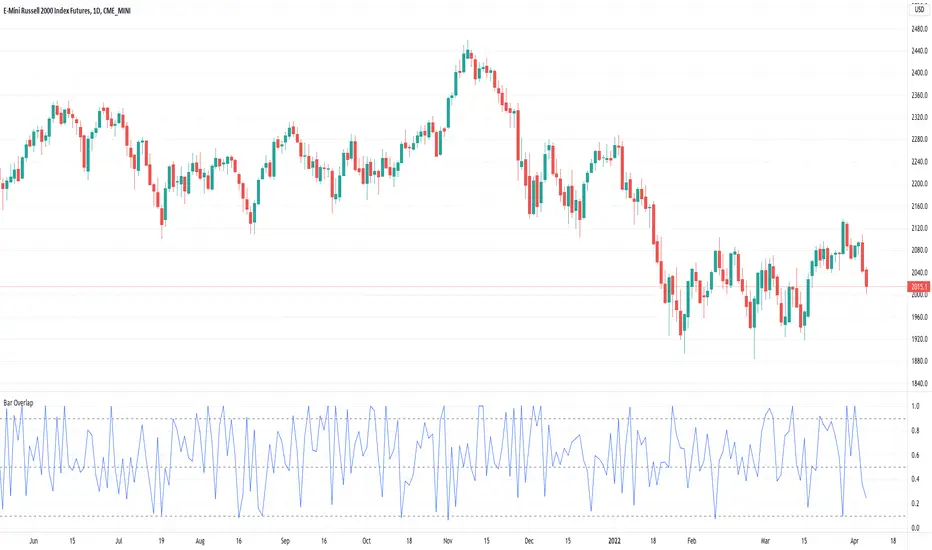
Bar Overlap - Sort of inside barsCalculates the amount the current bar overlaps with the previous bar as a percentage. 1 = totally overlapping (inside bar) , 0 = no overlap at all
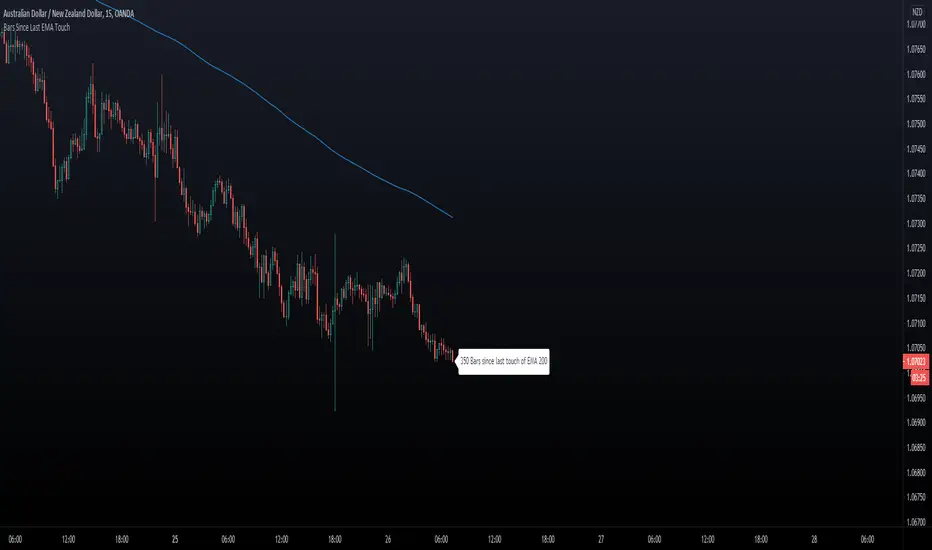
Bars Since Last EMA Touch
This indicator keeps track of how many bars since price touched any EMA last time. You can for example
set 200 EMA. Tell the script to send an alert if/when 400 bars has been reached away from the EMA 200.
- You can hide/show The EMA Line.
- You can hide/show bar Count.
- You can set X bars from EMA to get Alert.
- You can change color of The Badge and EMA line to fit your background colors.
Enjoy!
Another Indicator From The Hunter Trading Group
Bar ChartI decided to change the type of charts for myself. Liked this one. When you add this script, the chart may slow down on a long history. Since this is my first script, I don't know how to make it easier.
A dot indicates a close, bars are displayed from high to low.
Black - inside bar
Blue outer bar
Green - high and low higher than the previous one
Red - high and low below the previous one

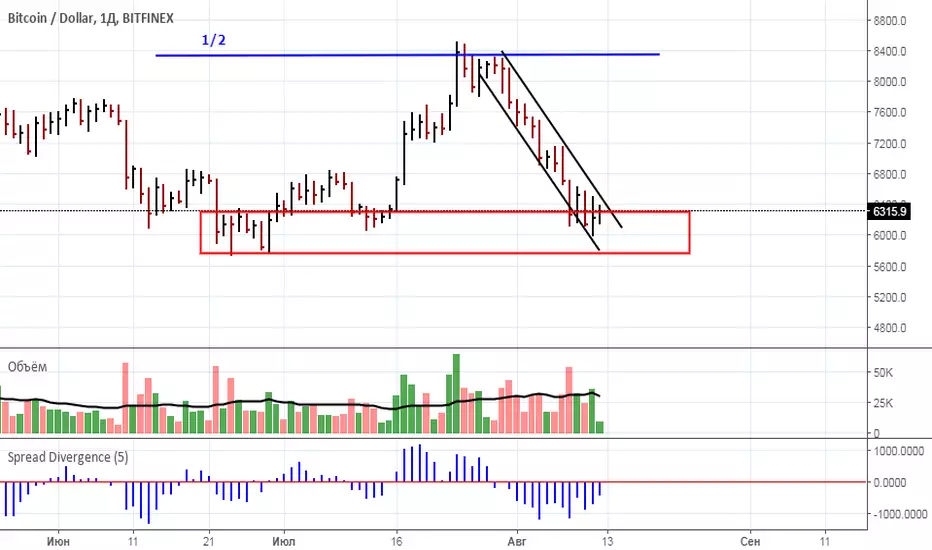
Bar by BarCalculation of weakness or force of the market. The current bar at the closing price to the number of bars specified by number in settings. At the time of growth or falling of the price if the spread decreases it means weakness and a possible turn. I recommend to use on 1D with settings 3-5. Use this indicator according to volume.
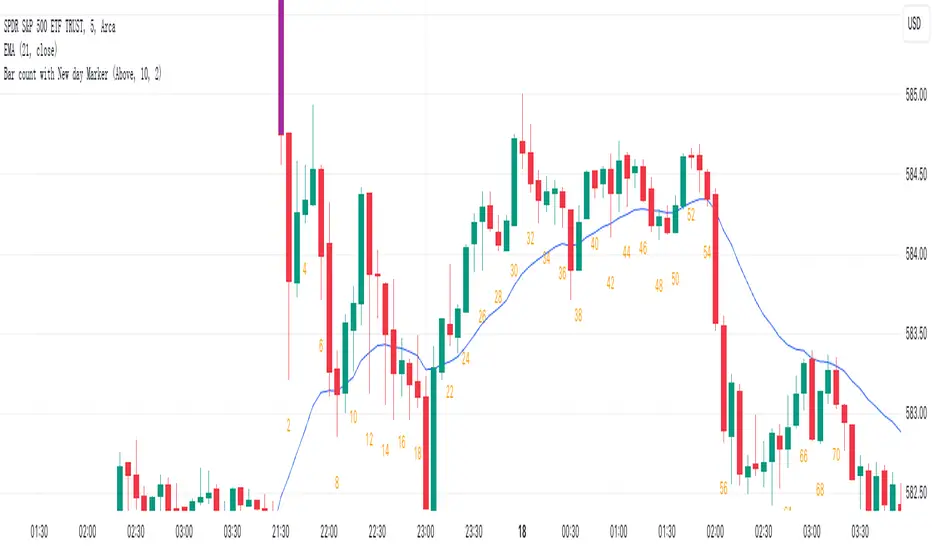
Bar count with New day Markerbased on bar count, highlight the first Bar with special colour on every day.
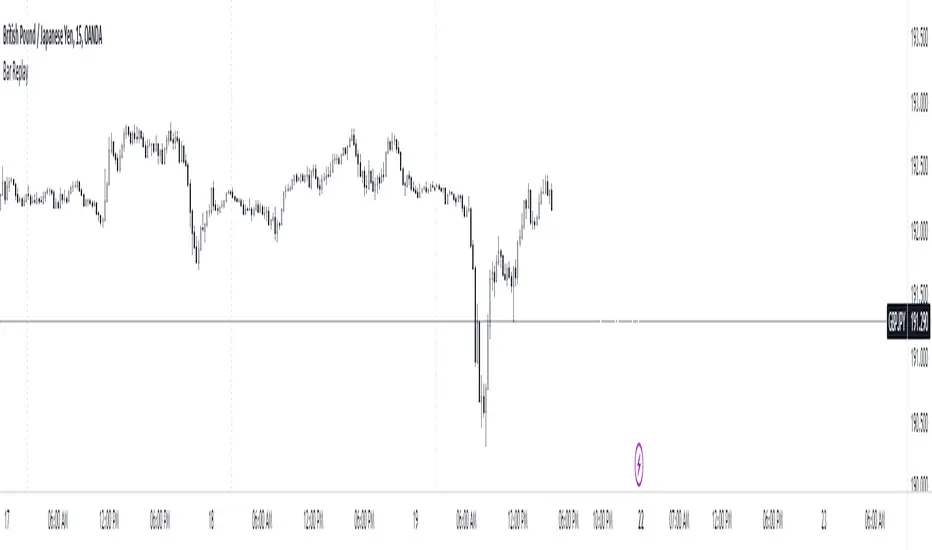
Bar ReplayThis indicator mirrors TradingView's bar replay feature to a certain extent, offering traders a streamlined way to analyze past market movements. It's a practical tool for strategy testing, pattern recognition, and refining trading approaches.
While it may have some limitations, it offers a practical solution for strategy testing and refining trading approaches for free and gets the job done. After all, having a tool is better than having none.
This is just an experiment so don't take it that seriously. I hope you guys find it useful.
If you have some ideas for improvement or found any bugs, kindly let me know.
How to use it?
Step 1 : Add the indicator to the chart.
Step 2 : Select the candle .
Step 3 : Make the changes visible.
Step 4 : How to Navigate
Step 5 : Change the date easily
The blank screen issue.
Note : There are some limitations
The data is limited to the free plan.
It's not smooth as the real Bar replay feature.
I haven't checked the bugs so let me know if you found any.
Bar Retracement Do you love Fibonacci ratios/levels? Have you ever thought to apply them to individual bars? If you are not familiar with these ratios and their significance, you can read about them here: www.investopedia.com
This simple indicator applies Fibonacci levels on the previous bar. This enables the quick determination of how far the current bar retraced relative to the precious one. Key levels are highlighted in yellow, orange, and red. You can choose to set an alert for "Large Retracements". This can be very useful for ending trades and avoiding full price reversals. There are other insights that can be gleaned as well.
Happy trading...

Bar By Bar ATR [upslidedown]After seeing strategy after strategy refer to calculating ATR values using a "calculator" (how barbaric!), I thought I'd take a stab at one possible solution to the "problem" as an overlay indicator on the main chart that replaces traditional standard ATR bands. This indicator presents ATR within a channel with a slick trick: invisible hover-able tooltips for you to know the ATR value for your strategy from bar to bar. Just zoom in and hover over the high ATR range and you'll see take profit and stop loss values for whatever strategy you might be running. I defaulted the indicator to a 1:1.5 ATR standard setup because that is good for many strategies but this is as configurable as you'd like to make it. One notable improvement for this indicator over standard ATR bands is that many existing ATR bands only use integers and this one uses a float value, so you can endlessly customize based on whatever strategy you might be running.
Note: Because labels are limited by default, the best way to historically see ATR values is to use TV's replay feature. I did this on purpose to limit resource usage. One could certainly print more labels but I felt it unnecessary to go beyond the default number of labels.

Bar Percent CompleteThis is an example script for checking how far the current bar has progressed towards it's completed state. This works for any time frame, eliminating extra logic calls and conversions for each timeframe.period. It is not intended to be a standalone indicator, but rather as a resource for additional logic triggers on the real time bar of a pine script.
The main caveat is that pine script calculations occur on a per-tick basis. This means that the completion percentage can exceed the percentage threshold before any logic is executed. This happens when the next tick occurs after the threshold. The relevance then will depend on the activity of the underlying asset. Longer time frames on low activity assets will likely be more relevant than their shorter time frame counterparts.

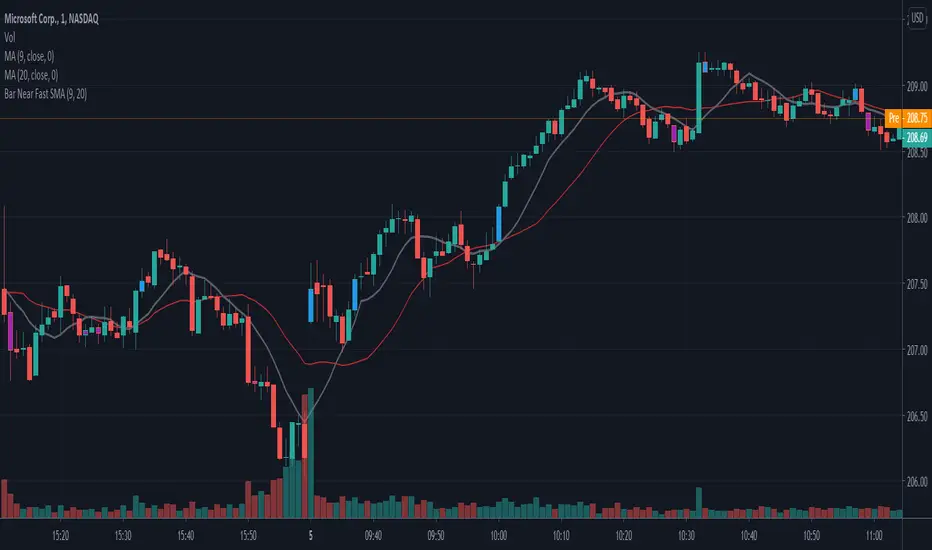
Bar Near Fast SMAPaints bars based on whether they are above or below the Fast SMA. You can optionally show/hide bars that are below the slow SMA.
This is supposed to be used as confirmation and validation of an idea.
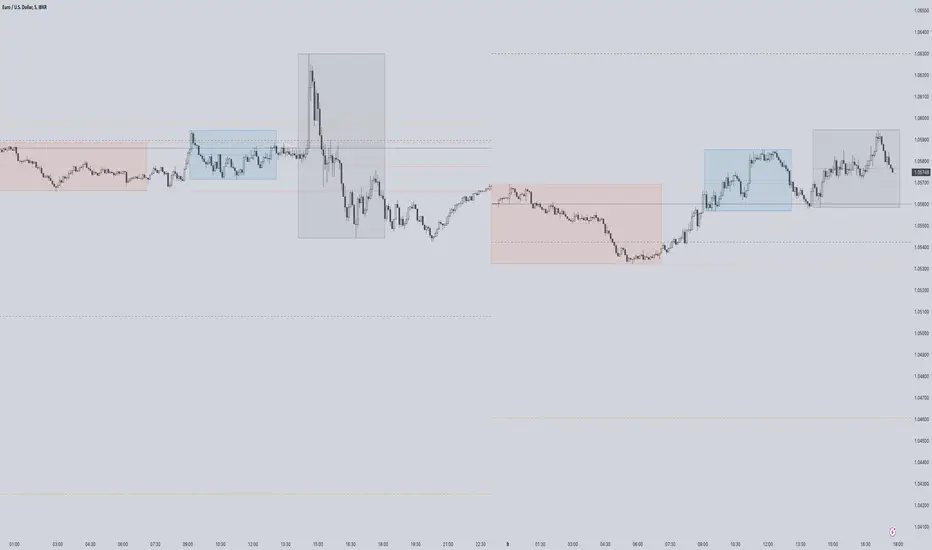
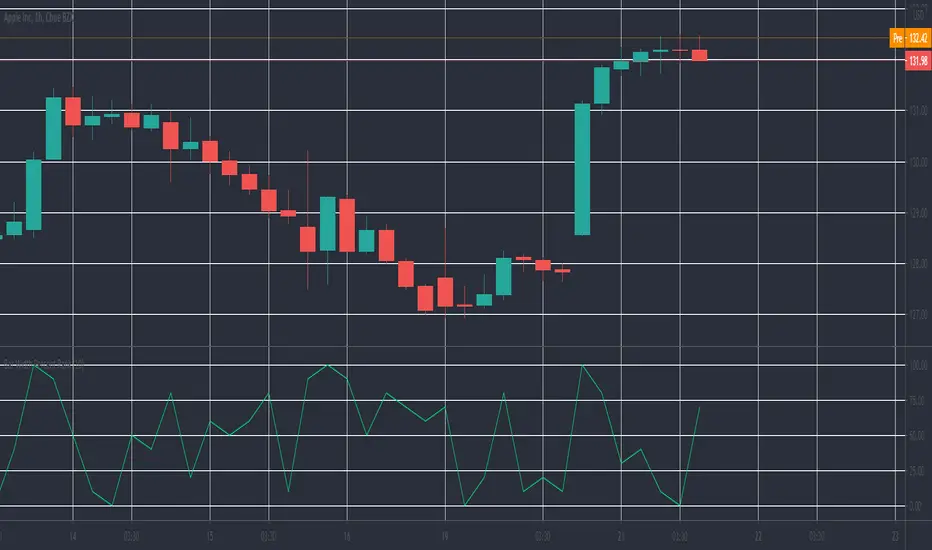
First 5 Minutes Open/Close LinesThis very simple indicator paints lines at the high and low of the first 5m candle of the session. It is primarily intended for big cap NYSE traded stocks with high volume. I wrote this indicator to save me the trouble of manually drawing the lines each day.
The lines drawn at the 5m high/low will remain constant regardless of which timeframe you switch to. In the example screenshot, we are looking at the 1m timeframe. This helps us switch effortlessly between different timeframes to see if a given price movement meets our entry criteria.
In addition to drawing lines at the first 5m high/low, it will optionally paint two zones, one each around the high and low. The boundaries of this zone are configurable and expressed as a percentage of the total movement of the first 5m bar. By default, it is set to 25%.
This indicator is based on the concept that the first 5m bar always has massive volume which helps us infer that price may react around the extremes of that movement. The basic strategy works something like this:
- You identify the high timeframe (HTF) trend direction of the stock
- You wait for the first 5m candle of the session to close
- You wait for price to puncture through the outer boundary of the zone marked by the indicator.
- You enter when price retraces to the high, or low, which marks the midpoint of the punctured zone.
- Only enter long on stocks in a HTF uptrend, and short on stocks in an HTF downtrend.
- Use market structure to identify stop loss and take profit targets
Note: Use at your own risk. This indicator and the strategy described herein are not in any way financial advice, nor does the author of this script make any claims about the effectiveness of this strategy, which may depend highly on the discretion and skill of the trader executing it, among many other factors outside of the author's control. The author of this script accepts no liability, and is not responsible for any trading decisions that you may or may not make as a result of this indicator. You should expect to lose money if using this indicator.

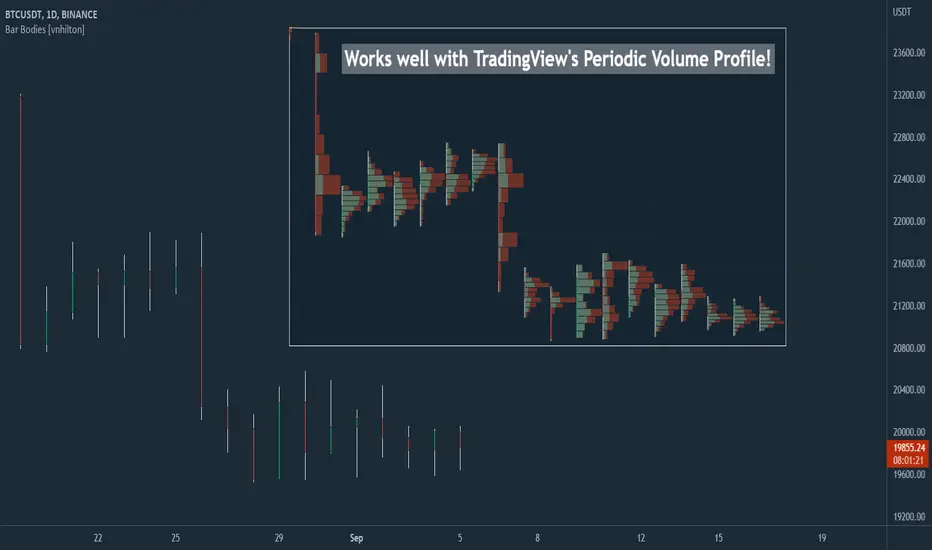
Bar Bodies [vnhilton]Note: Go to "Chart Settings" & hide "Body" & "Borders". Also uncheck "Labels on price scale" & "Values in status line" as they're not needed.
This script plots candlestick bodies with the same thickness as the wicks (similar to the bar chart, but without the horizontal lines to represent the open & close). To do this, it plots an invisible candlestick body with an invisible candlestick border from the high to the close/open for a green/red candle respectively, & uses the low wick as the candlestick body itself by plotting it from the low price to the open/close for a green/red candle respectively.
My personal use for this script is to use it in conjunction with TradingView's Periodic Volume Profile, in order to still see OHLC data without obstructing the candlesticks' volume profiles, as seen in the chart snapshot image above.
Bar Width Percent RankA simple script to calculate and show the current percent rank of the absolute open - close (candle bar width) over a given period.
Useful to determine the current volatility.
A higher value indicates that the current period is having a big swing.
Bar Delta SentimentScript that accumulates the magnitude of positive and negative bar change deltas. These differences are used to estimate market sentiment. When the sentiment line crosses the zero line downwards the sentiment is bearish and when it crosses it upwards it is bullish.
To enable the indicator to add value as a leading indicator, the ema of the sentiment line is plotted. When the sentiment line crosses below the ema it indicates a possible shift to a bearish market, and when it crosses above the ema it indicates the possibility of the market turning bullish.
The indicator can be used on all time-frames and all symbols. In general it works best when the length is quite short, like a 13, 21, but the user can play around with the settings a bit depending on the symbol and time frame in use.

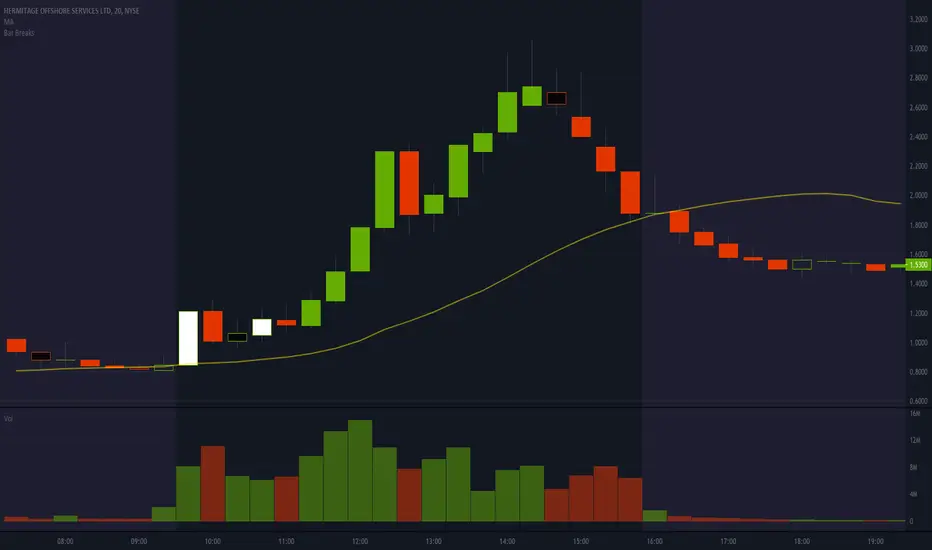
Bar BreaksThis indicator helps visualize bar breaks, where one candle trades higher than the previous candle's high, or lower than the previous candle's low. This is especially helpful for spotting larger timeframe "cups".
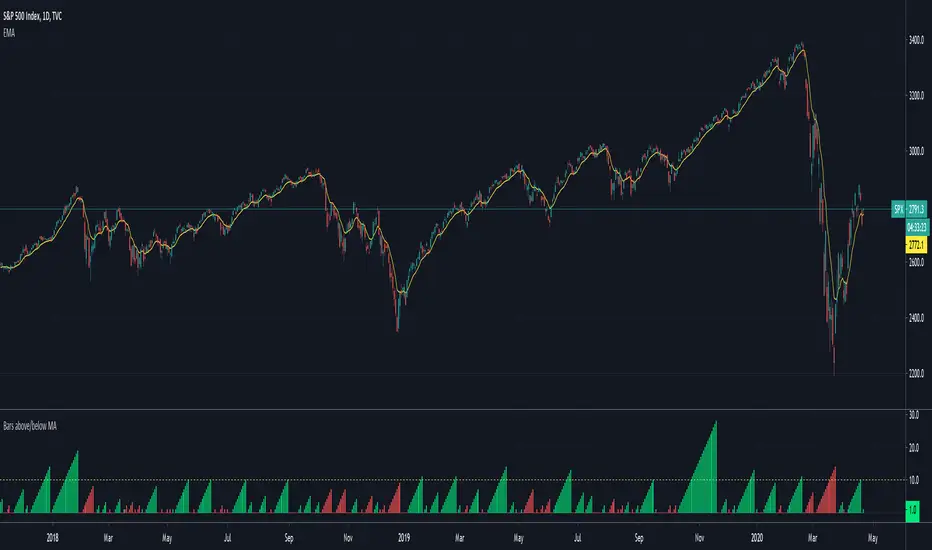
Bars above/below EMACount of previous bars above or below a chosen Exponential Moving Average. Typically price reconnects with well defined EMAs regularly. If the price has been above/below an EMA for too long, you can expect a reconnect in a short order and bet on mean reversion strategies.
Bar Info: Major Currency PairsMajor currency pairs are based on a list of popular currencies that are paired with the USD.
This scripts consists of 6 pairs only and show the information of 3 Bars: 15M - 1H - 4H

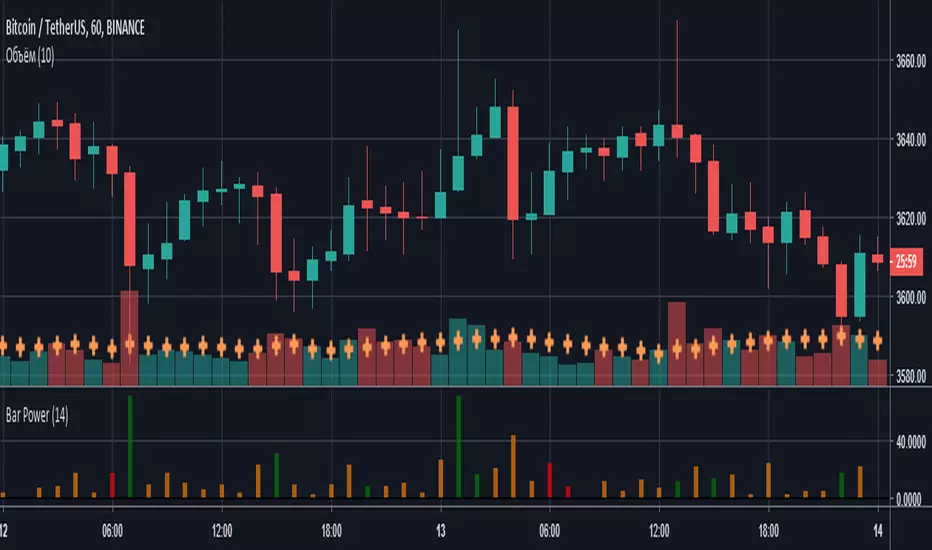
Bar PowerВысота столбцов характеризует силу (то, на сколько быки/медведи были активнее) сформированной свечи, а цвет - количество затраченной на это энергии (объем).
- Красный - маленький объем;
- Оранжевый - средний объем;
- Зеленый - высокий объем.
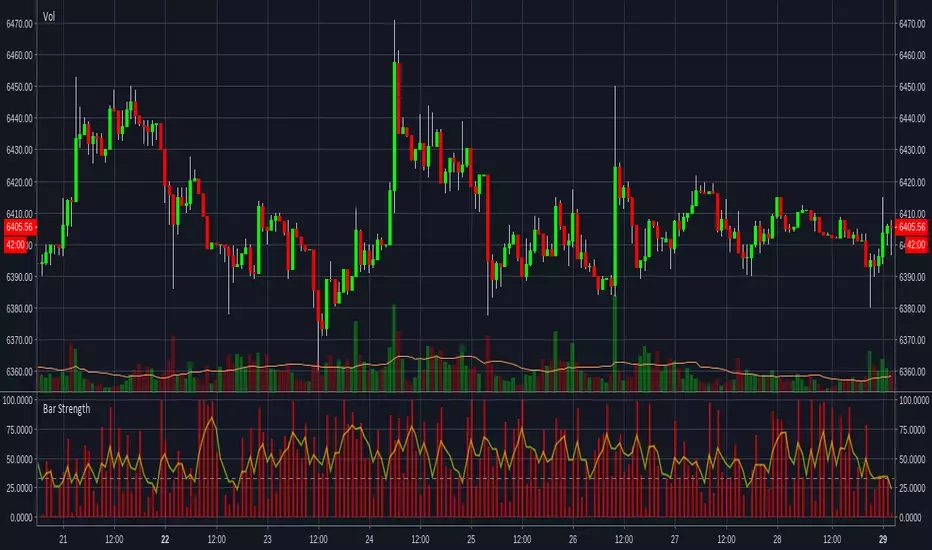
Bar Strength IndicatorIndicator to measure the size of the candle body against the whole candle including the wicks. More information can be found here www.fxstreet.com
This indidactor is based on Marco Mayers article. All credits go to him.