Bull Bear Power VoidThere are a million oscillators out there based on volume. My biggest problem with them is that they simply tell you whether you have volume to the upside or volume to the down side. it's kind of tricks you with the lack of information into thinking you have a change in your trend or that you're going to be able to break out of a range across a moving average or through some trend line or support and resistance.
However many of these Oscillators are failing because they lacked to tell you one key thing. they tell you that you have volume but they never tell you if it's enough volume.
Even a popular indicator like the MACD can have its MACD Line crossing upwards over the signal, telling you that you have an uptrend but again it's still failing to give you the results of how much volume you have and is it enough volume in that crossover. It boils down to the one key fact that with out volume there is no momentum. This should be able to make trading crossovers a lot easier.
So in today's video I'm going to show you the newest addition to the trading View Community Scripts and it is called,
"The Bull Bear Void Volume Oscillator"
From my own testing, this oscillator can predict weather the next candle will get you the move you need or not.
In the markets you cannot have anything good without volume. after you have volume you have momentum. you cannot have momentum without volume and this is the key thing that causes people to fail when they look for breakouts, trend reversals, or if they're wondering whether this move is a fake out.
This indicator is based on the study volume spread analysis or VSA.
This indicator is designed to be paired perfectly with the Heiken Ashi Algo oscillator.
www.INSERTA-LINK-HERE.com
This indicator is strictly to be used as a confirmation indicator and not to be used by itself to tell you when to buy or sell.
what are its parts.
The void
is a bullish and bearish Cloud that appear extending from the center of words and the center down words. This is the average range of volume. anything that appears to close inside of this void is usually a ranging volume and it is not enough to break the trend or break out.
The MACD and MACD Signal Line
Just like using the macd these two lines indicate whether the trend is moving up for the trend is moving down
The Colored Columns
RED Column - Indicates volume movie downward
Light Red - indicates volume is pulling back from a downward move
Green - indicates volume is moving upwards
Light Green - indicates volume is moving down from an outboard move
Rules for a SELL CONFIRMATION TRADE
The macd line must be underneath the signal line and the macd line must be below the midline.
A bullish column must appear below the midline and it must extend outside of the red void.
if you are using the heikin-ashi Aldo oscillator you must also have a red heiken Ashi candle close below -10.
To do a by trade you simply reverse the rules.
Cerca negli script per "bear"

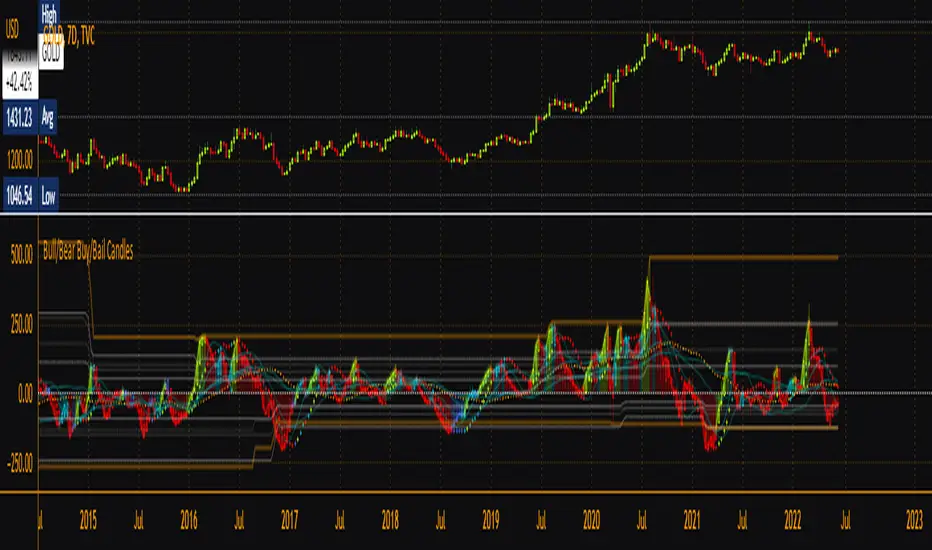
Bull/Bear Buy/Bail CandlesBased on BullBearPower indicator, this is a heavily modified version with colored candles to show when bulls or bears are buying or bailing. Includes Fibonacci Levels based on Highest/Lowest value in variable length, along with optional second timeframe and alternative calculation for candles and linear regression curves for increased versatility. Green = bullish /long, Aqua = still-bullish albeit weakening, blue = weak albeit strengthening and red = weak/short. Perfect as a confirmation indicator for those looking to time markets.
Bull& Bear Bars Count/CalculatorIn bull trend, bull bars are more than bear bars and vice versa.
More important, if the bull/bear bars are more continuous, the trend is typically stronger.
So, if the bars amount is visualized, it would be much more easier to identify the unfolding trend in front of you.
This indicator shows you the amount of bull/bear bars by columns.
The higher the column, the bars are more continuous, the trend is stronger.

Indicator Direction Table With Bullish & Bearish LabelsINDICATOR DIRECTION TABLE WITH BULLISH AND BEARISH LABELS
This is a table that shows the bullish, bearish or neutral trend for nine different popular indicators. Each indicator label will change color in real time to make you aware of each change in direction. This way you don’t have to read and analyze a bunch of different indicators constantly and you can focus on price action instead.
Look for the entire table to turn green or red before taking positions.
You can also set alerts for when the entire table of indicators is bullish or bearish.
The indicator settings allow customization of indicator lengths & values, table position and turning the indicator table on or off.
The length and other values for each indicator can be customized to suit your preferences, but by default all of them are set to the normal default settings that Tradingview supplies the indicators with. Typically 14 as the length.
The indicators used in this table are as follows:
MACD - Moving Average Convergence Divergence
Stochastic RSI - Stochastic Relative Strength Index
Vortex - Vortex Indicator
Momentum - Momentum Indicator
RSI - Relative Strength Index
PSAR - Parabolic Stop & Reverse
DMI - Directional Movement Index
MFI - Money Flow Index
Fisher - Fisher Transform Price Action
***MARKETS***
This indicator can be used as a signal on all markets, including stocks, crypto, futures and forex.
***TIMEFRAMES***
This indicator table can be used on all timeframes.
***TIPS***
Try using numerous indicators of ours on your chart so you can instantly see the bullish or bearish trend of multiple indicators in real time without having to analyze the data. Some of our favorites are our Auto Fibonacci, Directional Movement Index + Fisher Price Action, Volume Profile With Buy & Sell Pressure, Auto Support And Resistance and Money Flow Index in combination with this indicator direction table. They all have unique features to help you make better and faster trading decisions.

MTF Bull Power Bear Power(Elder Ray Indicator)■Overview
This indicator enables to select an upper timeframe’s Bull Power Bear Power(aka Elder Ray Indicator) (MTF) and the one of chart’s timeframe simultaneously by which users can always analyze looking at upper timeframe situation.
Also, it displays signals when bull power bear power cross zero line with an ability to set alerts.
■Formula
The indicator calculates bull power and bear power following the original Elder Ray indicator as follows.
1.Bull Power : High - EMA(13)
2.Bear Power : Low - EMA(13)
3.Bull Power Bear Power : 1 + 2
※MTF is same as above
※MA period can be changed
※High/Low is highs/lows of a chart timeframe that users are opening unless you show MTF.
See the link below for the details.
www.investopedia.com
To enable MTF, users can select “Auto” mode and “Manual” mode. When “Auto” selected, upper timeframes are determined based on the chart’s timeframes that users are currently opening as follows.
Chart timeframes -> upper timeframes
Weekly -> Monthly
Daily -> Weekly
4hour -> Daily
1hour -> 4hour
30min -> 4hour
15min -> 1hour
5min -> 1hour
1min -> 15min
■Signals
When bull power bear power cross zero line, signals can be displayed. These can be used to analyze reversal of buying/selling power.
Alerts can be set with the same condition.
——————————————
エルダー·レイ·インジケーターとしても知られるブルパワー·ベアパワーのMTFバージョンインジケーターです。
一つの上位足のブルパワー·ベアパワーとチャートのタイムフレームのブルパワー·ベアパワーの両方を同時に表示することができるため、常に上位足の状況を鑑みながら分析することができます。
また、それぞれのブルパワー·ベアパワーとゼロラインとの交差でシグナル表示、アラート設定が可能です。
■計算式
ブルパワー·ベアパワーの計算式は以下の通りです。
オリジナルのエルダー·レイ·インジケーターと同じくEMAと高値·安値を用いて計算しています。
1.ブルパワー: 高値 - EMA(13)
2.ベアパワー: 安値 - EMA(13)
3.ブルパワー·ベアパワー = 1 + 2
※MTFも上記に同じ
※MAの期間は変更可能
※高値·安値は現在開いているチャートの高値·安値です。(MTFは指定したタイムフレームの高値・安値)
ブルパワー·ベアパワーの詳細は以下のリンクを参照してください。
www.investopedia.com
MTFのブルパワー·ベアパワーを表示するにあたっては、”Auto”モードと”Manual”モードの二つから選択することができます。
“Auto”モード選択時は、現在開いているチャートのタイムフレームに基づき、上位足のタイムフレームが下記の通りに自動的に決定されます。
チャートタイムフレーム -> 上位足タイムフレーム
週足 -> 月足
日足 -> 週足
4時間足 -> 日足
1時間足 -> 4時間足
30分足 -> 4時間足
15分足 -> 1時間足
5分足 -> 1時間足
1分足 -> 15分足
■シグナル
ブルパワー·ベアパワーとゼロラインとの交差でシグナルを表示します。
売り買いの強弱反転ポイントの目安として使ってください。
同じ条件でアラート設定も可能です。

Rebalance as a Bear/Bull indicatorCheck if the current market has a Bear tendency or a Bull tendency.
Bear areas are marked as red squares going down from 0.
Bull areas are marked as green squares going up from 0.
Buying/Selling windows of opportunity
On top of the Bear/Bull squares, this indicator tries to show you the windows where to look for good buying/selling opportunities.
These are marked as full columns:
Blue columns represent a window to look out for good buying opportunities
Pink columns represent a window to look out for good selling opportunities
How is this possible?
This is an indicator of a simple idea to check if the market has a Bear or Bull tendency:
1. Start with a virtual portfolio of 60/40 tokens per fiat.
2. Rebalance it when its ratio oscillates by a given % (first input)
3. Count the number of times the rebalancer buys, and sells
4. When the number of buys is greater than the number of sells => the market is going down
5. When the number of sells is greater than the number of buys => the market is going up
This is shown as the "Bear/Bull Strength" squares (red when bear, green when bull)
An extra rebalancer is also kept that works at each bar (regardless of the input %).
This is used to calculate an amount of tokens beying sold/bought and used as a "market force" coefficient.
Another extra: based on both the bear/bull strengh and market force an attempt is made to
provide good buying/selling windows of analysis.
The blue background is a buying opportunity, the red background is a sell opportunity.
In a bear market sales are delayed, and in a bull market buys are delayed.

SB Average Gain/Loss OscillatorI created an algorithm to analyze overbought/oversold levels through the use of average gain/loss.
This method of measurement is utilizing the 20 period and 50 period moving averages.
Light Green: 20 Period Oversold
Dark Green: 50 Period Oversold
Green Dot: 20 and 50 Period Oversold
Light Red: 20 Period Overbought
Dark Red: 50 Period Overbought
Red Dot: 20 and 50 Period Overbought
Places of overlap green/red would be considered indecision and/or volatility in both directions.
I would consider this more of an sentiment indicator, bullish/bearish. The reason for this classification is that its only using price action. No real technical indicators other than period gain/loss).

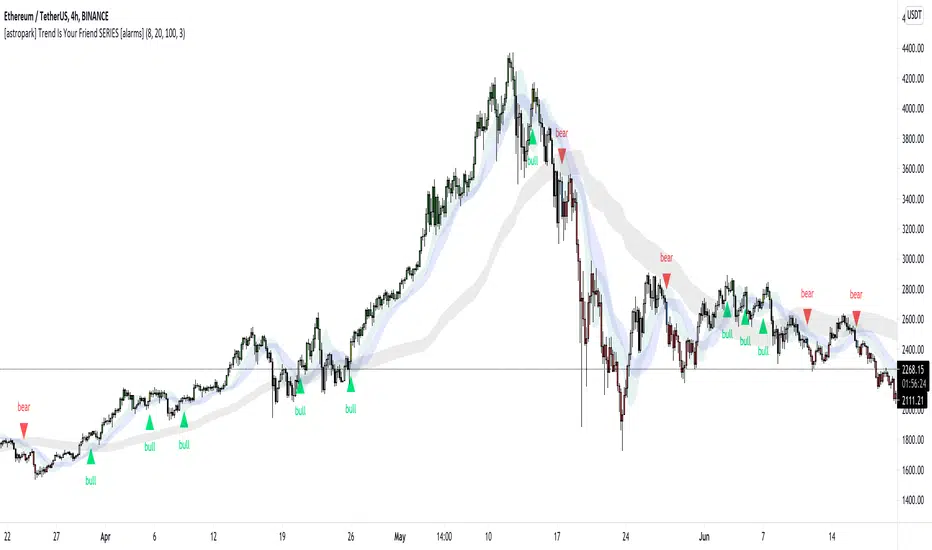
[astropark] Trend Is Your Friend SERIES [alarms]Dear Followers,
today I'm glad to present you an indicator which is a mix of three indicators of mine: Trend Is Your Friend Series !
As you may easily understand from the name, this indicator incorporates all 3 Trend is You Friend indicators I made in past.
This way you can control all of them just with one indicator.
Of course this comes with some useful integration features:
a bull green triangle appears when all trends are bullish (you can set an alert for this)
a bear purple triangle appears when all trends are bearish (you can set an alert for this)
bar coloring reflects the bullish/bearish integration too
you have an option to enable/disable all trends buy/sell signals
you have an option to hide trend clouds borders (chart will be way cleaner this way)
you can still customize each trend indicator settings and set alerts on each trend individually
you can enable/disable heikin ashi analysis
As per Trend is Your Friend V1/V2/V3, this indicator is for higher timeframe trading, from 4h and above is suggested.
This indicator is pretty good for both Swing and Scalping , you can run it over a bot or use it on Renko chart!
If you are a scalper, you will love suggested entries for fast profit. You can run it on 1h timeframe in this case (below is not suggested, there is "no-trend" below 1h!). If you are used to scalp trading, be sure to close each trade whenever you feel happy (a proper trailing stop strategy is suggested for example).
As I always say, all tools are great if you use them correctly: this is not the "Holy Grail", so always use proper money and risk management strategies.
For your reference, here you can see original basic indicators that were integrated here:
V1 backtesting strategy
V2 backtesting strategy
V3 backtesting strategy
This is a premium indicator , so send me a private message in order to get access to this script.
Fibonacci and Ema Trend + Pullback alerts This indicator tells you what to do with supports and resistances based on fibonacci with signs and alarms
and Ema 200 with buy or sell fast pullback alarms
When 0.5 is bear the price will seek to break the lower supports
sell from 0.5 to bear zone and obtain profits below the supports
stop loss above resistence
When 0.5 is bull the price will seek to break the highest resistances
buy from 0.5 to bull zone and profit above the resistances
stop loss below support
you can edit the indicator to have slower or faster levels if you want
The alarms that the indicator has :
Resistence down
Resistence up
Bull zone UP
Buy 0.5 Bull
Sell 0.5 Bear
Bear zone DOWN
Bear zone UP sell to 5.0 bear
Bull zone DOWN Buy to 0.5 bull
Support zone DOWN
Support zone UP
ema 200 pullback alerts
when price is going up active the buy fast pullback alarm
stop loss below ema 200 or support
when price is going Down active the sell fast pullback alarm
stop loss above ema 200 or resistence

KINSKI ADXThis ADX indicator (Average Directional Index) tries to estimate the strength of a trend. The Average Directional Index is derived from the positive (+DI) and the negative directional indicator (-DI). The direction of movement is determined by comparing the highs and lows of the current and past periods.
As soon as the indicator determines a trend strength for upward or downward trend, a label is displayed. An upward trend is labelled "Bullish Trend". The downward trend bears the label "Bearish Trend".
The clouds in the background represent the movements of the Average Directional Index High/Low:
Color orange: neutral, uncertain in which direction it is going.
Color green: upward trend
Color red: downward trend
The line represents the average value of the ADX signal:
Color orange: neutral: still uncertain in which direction it is going
Color green / outgoing line: upward trend
Color green / descending line: weakening upward trend
Color red / exiting line: downward trend
Color red / descending line: weakening downward trend
The following configurable options are possible:
"ADX Smoothing
Directional Index Length
Level Range
Level Trend

Best Bulls Bears Volume trend Breakout V2 [badshah_e_alam]This is a intraday indicator. Only to be used on timeframe less than daily charts.
This indicator purely uses volume to plot the graph. The indicator helps in conforming a breakout strategy.
This indicator is advanced version of my previously developed indicator you can check this link
Total volume is made up of buying volume and selling volume . Buying volume is the number of shares, contracts, or lots that were associated with green bars, and selling volume is the number that were associated with red bars.
The labels on the right side are the current bar value and that days bulls /bears weightage.
the first value shows the current bar volume.
second value show the bulls weight in %
third value show the bears weightage throughout the day ( %)
The Blue plot in graph keeps the track of bulls movement in intraday( %)
The Red plot in graph keeps the track of bears movement in intraday ( %)
X axis is time.
Y axis ranges from 100 to -100
I use 1:2 risk to reward ratio. Do your own research.
**not a financial advice**
Example of price increasing, volume decreasing
this indicator can be used for confirming a breakout strategy with bulls or bears in action. In the current example, the buyer’s volume percentage is reducing and the price is increasing throughout the day. Hence a breakout of the trendline is confirmation of a short trade.
Example of Price reducing, volume decreasing
example of price moving down , bears losing the grip
Example of price decreasing volume increasing
Thanks to nizar9599 for giving idea to improve my previous indicator.
DISCLAIMER
Any and all liability for risks resulting from investment transactions or other asset dispositions carried out by the user based on information received or a market analysis is expressly excluded by me.
All the information made available here is generally provided to serve as an example only, without obligation and without specific recommendations for action. It does not constitute and cannot replace investment advice. We therefore recommend that you contact your personal financial advisor before carrying out specific transactions and investments.
Do your own research, This is not a financial advice.

Percentile Rank Market FilterA simple script to filter bull and bear markets by using percentile rank filter. Using market regimes to filter by bull/bear/sideways markets helps to understand how your strategy will
behave in various market regimes and allows you to avoid unprofitable regimes and only trade in profitable ones.
The idea of market regime filtering is used in the most successful technical algorithmic trading strategies, as one should always design a trading strategy with a particular market in mind according to trading legend, Larry Connors
Feel free to use this script in your strategies to improve your profits and lower drawdowns.

Altered True Strength Indicator (TSI) Reupload-
Altered TSI provides a slightly more volatile signal that demonstrates extremities in price action with greater success than standard TSI. In addition, I added bull/bear cross indicators (green/red) to make it easier to notice the crosses to save time when the market is moving fast (I couldn't find a regular TSI script with this addition). Finally, the signal also has overextension parameters (red and green lines)
I think this is best used on Intraday time frames as the signals respond to volatility very well and using Heikin Ashi candles, trend is more visual. In this particular example, I am showing SPY on the 3m time chart (my favorite short time frame) and the signal alone provided many opportunities for trades when using simple divergences and countering overextension direction when short term (blue) signal crosses either
In the first example (purple lines), SPY ramps but it was a dull signal given the signal strength flatlining- we would be looking for a short entry. When the signal fires, it provides a clean $1.50 move down in spy.
In the second example (orange), the blue signal provides a nice V shape (rebound signal) in which we are looking for a long entry. 390.50 is a strong SPY support in confluence with 2nd std dev VWAP extension, but disregarding that bull signal fires resulting in a 2 dollar move upwards. Exit is provided when blue line crosses green overextension.
In the third example (white), we are searching for a short entry at 392.5 resistance in confluence with divergently higher highs. Bear cross signal when fired and a significant cross is visible provides a $2.50 move to the downside with a potential exit provided when blue line crosses red overextension line in confluence with previous LOD area.
In the fourth example (green), we watch as the blue line provides a V pattern, we are searching for a long entry. If you didn't take a riskier long at 2nd std dev VWAP overextension with V recovery on blue line at red overextension for a ride to vwap, then you are looking for a secondary entry long as you wouldn't take the trade at resistance (vwap). Bullishly divergent lows provide this entry and the signal does not bear cross at all (but looking for significant crosses is more important even if the signal were to make a minor bear cross). Bullishly divergent double bottom provides a long entry to end of day with a nice clean signal for a $5.00 move until eod or when signal crosses overextension range.
Ideally, close to the money options or SPY/SPXS/SPXL are best used in the intraday time frame.
Again, this is not a standalone indicator but it's best used in conjunction with other indicators/trading strategies
Any questions feel free to comment

Bull Bear Power1. Calculate
* Base on RSI status in the same period of price bar, "Bull Bear Power" is counting number of bars moved above 70 then return result to "bull power" series, and counting number of bars moved below 30 then return result to "bear power" series.
* By default RSI period is 2 and Bar period is 15.
2. Interface
* Bull power: green columns.
* Bear power: red columns.
* Info Line: show info of RSI and Bull Bear Power
- Bull Bear Power info: Period, Bull value, Bear value
- RSI info: RSI value, RSI status: overbought (>70), oversold(<30), crossunder 70, crossover 30.
3. Trade:
* Consider place Long oder when Bull power increase from below to above Bear power
* Consider place Short oder when Bear power increase from below to above Bull power

PT Trend BarsVersion 1.0 of our Trend Bars Indicator offers a visual of the current trend. The purpose of it is to help you avoid counter trading the trend. It will not identify the exact top or bottom, but it will help you identify overall in which direction the market wants to head. High time frame trend bar candles will allow you to ride the wave for multiple weeks.
White candles indicate bullish trend
Black candles indicate bearish trend
Strategy:
Daily is our favorite time frame to use when trying to identify the overall macro trend of the asset. Once we cross bull with three consecutive white candles, we can assume we are bullish until the candles flip bear again (black). On lower time frame, if the candles flip color but the price is going against trend, you can assume we are going for a retest.
This Oscillator is best used with the PT Buy Sell indicators we provide. It offers extra confluence for a stop loss & for a target for swing setups. It is included as part of the library. Just message us for access!

[astropark] DMI/ADX strategy [alarms]Dear Followers,
today I'm happy to share with you my DMI / ADX Strategy .
It provides directional trend information, so if a bullish or a bearish trend is going to start. Statistically it works better on lower timeframes (from 5 minutes to 1 hour).
It is both a Swing and Scalping Strategy indicator , based on a simple trend following theory , good for trading FOREX, Indexes, Stocks, Commodities and Cryptocurrencies.
To help in Taking Profits, the strategy integrates 2 special other than bull/bear signals:
Overbought and Oversold RSI Signals , which appear both as darker background (the darker the color, the more the price is in overbought/oversold) and green "ob"-"tp" / red "os"-"tp" labels (they optionally pop up only on a configurable stronger overbought/oversold condition) (you can enable/disable it optionally)
Peak Profit Tracker , which resets every time a new trade starts and keeps track of price fluctuation during the trade: the message is don't be too greedy and take profits or lock them with a stoploss in profit (you can enable/disable it optionally)
You can edit many options in order to
have more/less bull/bear signals
enable/disable showing bull/bear signals
enable/disable showing RSI TP signals (you can edit RSI length, overbought (OB) and oversold (OS) levels)
enable/disable showing peak profits on each trade
The user who wants to use this strategy, especially via an automated bot, must always set a stoploss (example 150$ from entry on bitcoin ) or use a proper risk management strategy .
This is not the "Holy Grail", so use it with caution. It's highly suggested to use a proper money management .
This script will let you set all notifications you may need in order to be alerted on each triggered signals.
You can find the strategy version for backtesting here below:
Here there are some examples how this DMI / ADX strategy works on many markets:
LTC/USDT 15m
BTC/USD 15m
BNB/BTC 15m
ETH/USD 15m
GOLD (XAU/USD) 15m
GOLD (XAU/USD) 1h
FB 15m
AAPL 15m
TSLA 1h
BANKNIFTY Index 5m
NIFTY 50 Index 5m
This is a premium indicator , so send me a private message in order to get access to this script .

RSI with Bull/Bear Resistant -SupportRSI with Bull/Bear Resistant -Support
RSI 14 , Overbought = 70 , Oversold = 30 as original signal use.
RSI line change to be Red when higher 70 and change to be Aqua when lower 30
Bullish or Uptrend use Lime color area.
RSI 80-90 is Bullish Resistant Area.
When RSI hit this area, price are hardly to move up more
RSI 40-50 is Bullish Support Area.
When RSI down from Overbought area to this area, to be alert.
If Price flip up and RSI still in Bullish Support Area, Price have enough momentum to return high.
If Price fall down and RSI break down lower Bullish Support Area, Price change to be down trend.
Bearish or Downtrend use Pink color area.
RSI 15-25 is Bearish Support Area.
When RSI hit this area, price are hardly to move down more.
RSI 55-65 is Bearish Resistant Area.
When RSI go up from Oversold are to this area, to be alert.
If Price flip down and RSI still in Bearish Resistant Area, Price have enough momentum to go more low.
If Price go up and RSI break up higher Bearish Resistant Area, Price change to be uptrend.
..
#WaveRiders

Combo Strategy 123 Reversal & Elder Ray (Bear Power) This is combo strategies for get a cumulative signal.
First strategy
This System was created from the Book "How I Tripled My Money In The
Futures Market" by Ulf Jensen, Page 183. This is reverse type of strategies.
The strategy buys at market, if close price is higher than the previous close
during 2 days and the meaning of 9-days Stochastic Slow Oscillator is lower than 50.
The strategy sells at market, if close price is lower than the previous close price
during 2 days and the meaning of 9-days Stochastic Fast Oscillator is higher than 50.
Second strategy
Developed by Dr Alexander Elder, the Elder-ray indicator measures buying
and selling pressure in the market. The Elder-ray is often used as part
of the Triple Screen trading system but may also be used on its own.
Dr Elder uses a 13-day exponential moving average (EMA) to indicate the
market consensus of value. Bear Power measures the ability of sellers to
drive prices below the consensus of value. Bear Power reflects the ability
of sellers to drive prices below the average consensus of value.
Bull Power is calculated by subtracting the 13-day EMA from the day's High.
Bear power subtracts the 13-day EMA from the day's Low.
You can use in the xPrice any series: Open, High, Low, Close, HL2, HLC3, OHLC4 and ect...
WARNING:
- For purpose educate only
- This script to change bars colors.

BTC Bullish or Bearish (Joy)Quite often we are faced with the question of whether Bitcoin is macro bullish or bearish.
I tried to take a punch at this.
There many ways to find that answer.
This is one crude way.
Whenever the background colour is light lime, it means it thinks the Bitcoin is macro bullish
Whenever the background colour is red lime, it means it thinks the Bitcoin is macro bearish
How would I use this information?
I can possibly use it in position sizing and hedging. If I see a sell in a lime background, I can potentially just hedge & vice versa.
Do note that it works best in the higher timeframes.
Do note that it is not supposed to be used to open any new trade or to close any trade.
I use it alongside other indicators for confirmation bias.
This can possibly be used for other instruments. As I only use it for trading BTCUSD, I have crudely tested for BTCUSD
For info on gaining access see the ⬇ link below ⬇ in our signature field & direct message me. I have a busy schedule at my own workplace. Trading is my hobby. Hence, please be kind to me if I am late in replying.
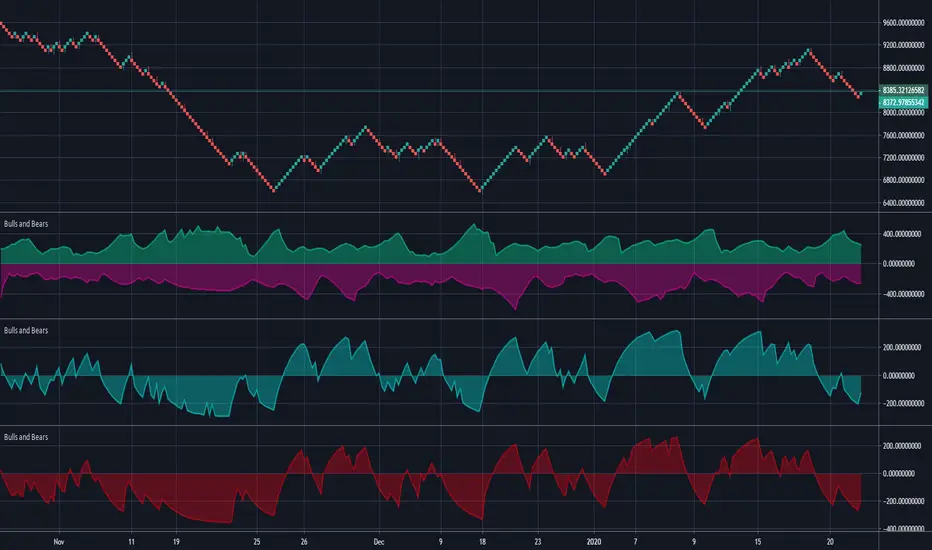
Bulls and BearsThis is a standard 'Bulls and Bears Power" Oscillator, how ever,...
There are two different formulas for calculating bulls and bears, the standard version, uses Highest and Lowest of prices in a given period, BUT, the version we have in meta trader platform, uses the current high and current low for each bar.
Within this indicator, you can use the standard version or the meta trader version, it will draw both bulls and bears and you can turn each one on and off in the style section.
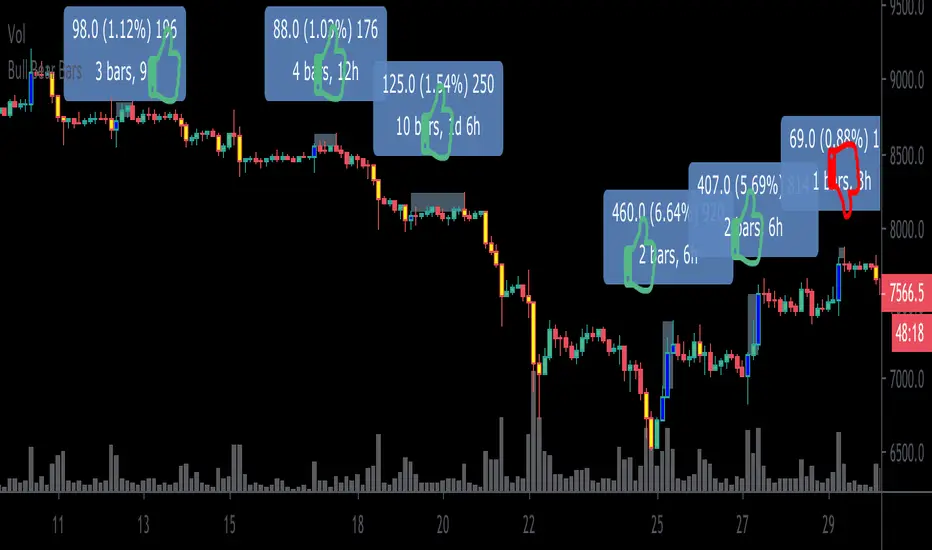
Bull Bear BarsHighlights when the movement of a candle is supported by a major increase in volume. Thus one could reasonably assume that a follow thru is likely to occur.
Blue= bullish
Yellow = bearish
I personally use this as an entry system. I enter only if the blue high or yellow low is surpassed by the very next candle , if not, then i do not enter. Thus trading with momentum and greatly avoiding choppy market conditions.
***Example*** In the chart above, during $XBT’s month long November 2019 Downtrend.. I am showing my bull long entries (without showing the obvious winning bear entries!) and found that only once did the price fail to advance less than 1% before any significant drawdown occurs (As shown on the chart by thumbs up & thumbs down symbols.)
***When using this indicator it is important to keep in mind that Blue bullish bars can and will appear at the top of upswings likewise, yellow bearish bars can and will appear at the bottom of downswings.. which could potentially signify trend reversals.
This knowledge can also can be used to ones advantage (” buy when everyone is selling, sell when everyone is buying.”)
This is a common occurrence because retail traders are often late to the party before they catch on to a trend resulting in buying heavily at the top and selling heavily at the bottom providing liquidity to earlier entrants to exit and as per usual the price then reverses on the mass of late bloomers.***
This indicator can be used in many different ways so goodluck in finding the method that best suits your style and be careful out there. Cheers
BONUS: Also has the ability to set alerts!
Periodic Price ActionI have developed this indicator to compare the current price with the any given periods opening price and to spot if the market is bullish or bearish. You can compare the current price with the past periods using "Shift" feature.
Disclaimer: This is not financial advice
Trade safe,
Atilla

Bull/Bear Test v0.1 [Experimental/Conceptual]For now, I shall assume that the script fulfills the idea that I have in my mind, but since I barely have any programming knowledge, it is likely that it does not.
I am not claiming any originality, it is just that I do not know if there is any indicator that meets this exact purpose. The coding was relatively easy, so here we are.
This is more like an experimental and conceptual study. It needs “cut-off” points to be efficient, like 38.2 and 61.8 Chop values.
So, the reasoning: We know that even during bear market, the number of red candles is larger than the number of green candles, thus any study used to determine whether it is a bull or bear market cannot rely on that. Instead, the “B/B test” focuses on how strong green/bull candles and red/bear candles are.
I think that every market is in any of the following three stages: Bull, Bear, Neutral. A Neutral Stage differs from a consolidation period. Simply looking at the chart does not tell you what stage the market is in. If you have the monthly BTC/USD chart in front of you, it is definitely a bear market. If it is the daily one, then it is controversial.
It sums every percentile change in last n green (red) candles, then divides it to n. This is shown by the Bull (Bear) Test. If the green line (the Bull Test line) is above the red line (the Bear Test line), that means that the Bull movement is stronger than the Bear movement in the last n periods.
Bull Test= Sum (Percentile change of green candles in last n periods) / n
Bear Test= Sum (Percentile change of red candles in last n periods) / n
Percentile change of a candle = (Close – Open) / Open
Relative Strength is obtained by dividing Bull Test to Bear Test, so yields a “clearer” study.
Relative Strength = Bull Test / Bear Test
In the same manner, Relative Strength’s being above 1.0 means that the bull attacks are stronger than the bear attacks in the last n periods.
Currently, there are two ways to use it:
1) Use Bull Test and Bear Test, but not Relative Study
2) Use Relative Study, but not Bull Test and Bear Test
A few things to consider:
1) As the use of Heiken-Ashi candles over ordinary candlesticks changes some of the candles’ colors, they yield relatively different results. I have back-tested some bear markets only with Heiken-Ashi.
2) For charts with ordinary candlesticks, as far as I can tell, a higher n number is better.
3) Due to the way Bull Test, Bear Test, and Relative Strength values are calculated, the same result of n x p (n: the number of candles, p: chart period [like 12h, 1d, 1w, etc.) yields different Bull Test, Bear Test, and Relative Strength values.
For instance: 10 bars on a 12h chart gives slightly different results than 5 bars on a 1d chart.
For the future, I am planning to add a derivative of Relative Study, so we can observe its change rate. Although I am not sure, I think that a crossover of the derivative on Relative Study might be used to determine if the market provably went parabolic.
