Bullish/Bearish Reversal Bars Indicator [Skyrexio]Introduction
Bullish/Bearish Reversal Bars Indicator leverages the combination of candlestick reversal bar pattern and the Williams Alligator indicator to help traders in understanding where there is a high probability of market reversal or correction. Indicator works for both bearish and bullish cases. It visualizes the bearish and bullish reversal bars with red and green dots and also plots the Alligator's lips to make it more convenient for traders to understand if price is above or below lips line (more information in "Methodology and it's justification" paragraph).
Features
Market Facilitation Index(MFI) filter: with the specified parameter in settings user can choose to filter bullish and bearish reversal bars which passed the MFI condition.
Awesome Oscillator(AO) filter: with the specified parameter in settings user can choose to filter bullish and bearish reversal bars which passed the AO condition.
Alerts: user can set up the alert and have notifications when bullish/bearish reversal bar has been printed.
Methodology and it's justification
In the script’s methodology, we apply the concepts of bullish and bearish reversal bars introduced by Bill Williams in his book Trading Chaos. So, what exactly is a bullish or bearish reversal bar? At its core, it’s a candlestick pattern. A bullish reversal bar is a bar that closes in its upper half, while a bearish reversal bar closes in its lower half.
Why is this type of bar significant? Let’s look at the bullish reversal bar as an example. When the price is trending upward, forming higher highs with each candle, and we suddenly see a bullish bar that makes a new high but ultimately closes in its lower half, it signals a shift in control. Bears have taken control toward the end of that candle's period, pushing the price back down. This can be interpreted as a sign of trend weakness and a potential reversal (or at least a correction).
An additional key point is that a reversal bar often indicates a possible end to the trend. Therefore, for a reversal bar to be valid, several preceding candles should show lower highs (for bullish bars) or higher lows (for bearish bars), reinforcing the likelihood of a trend change.
The second step on methodology is the location of the bar related to Williams Alligator. The Williams Alligator Indicator, developed by Bill Williams, is a technical analysis tool that helps traders identify trends and potential turning points in the market. It consists of three lines, often called the jaw, teeth, and lips of the alligator, each representing different moving averages:
Jaw (Blue Line): A slower moving average, typically a 13-period smoothed moving average shifted 8 bars into the future.
Teeth (Red Line): A medium moving average, typically an 8-period smoothed moving average shifted 5 bars into the future.
Lips (Green Line): A faster moving average, usually a 5-period smoothed moving average shifted 3 bars into the future.
When the three lines are spread out and moving in the same direction, it suggests a strong trend (the "alligator" is "awake and feeding"). When they intertwine, the indicator suggests that the market is moving sideways, or in a range, signaling a lack of clear trend (the "alligator" is "sleeping"). Traders use the Alligator Indicator to enter trades in trending markets and avoid trades in choppy, non-trending markets.
If bullish reversal bar's high is not below and bearish reversal bar's low is not above all three Alligator's lines (jaw, lips, teeth) they cannot be interpreted as these types of bars. It can be explained as following: if we are waiting for the bullish reversal bar it shall be reversal from downtrend. If price is not below all three lines it can't be interpret as the downtrend according to this method. The opposite is true for the bearish reversal bar.
All described above are obligatory conditions for reversal bar, now let's discuss two not obligatory conditions. The first one is Market Facilitation Index (MFI) restriction. Let's briefly look what is MFI. The Market Facilitation Index (MFI) is a technical indicator that measures the price movement per unit of volume, helping traders gauge the efficiency of price movement in relation to trading volume. Here's how you can calculate it:
MFI = (High−Low)/Volume
MFI can be used in combination with volume, so we can divide 4 states. Bill Williams introduced these to help traders interpret the interaction between volume and price movement. Here’s a quick summary:
Green Window (Increased MFI & Increased Volume): Indicates strong momentum with both price and volume increasing. Often a sign of trend continuation, as both buying and selling interest are rising.
Fake Window (Increased MFI & Decreased Volume): Shows that price is moving but with lower volume, suggesting weak support for the trend. This can signal a potential end of the current trend.
Squat Window (Decreased MFI & Increased Volume): Shows high volume but little price movement, indicating a tug-of-war between buyers and sellers. This often precedes a breakout as the pressure builds.
Fade Window (Decreased MFI & Decreased Volume): Indicates a lack of interest from both buyers and sellers, leading to lower momentum. This typically happens in range-bound markets and may signal consolidation before a new move.
For our purposes we are interested in squat bars. This is the sign that volume cannot move the price easily. This type of bar increases the probability of trend reversal. In this indicator we added to enable the MFI filter of reversal bars. If potential reversal bar or two preceding bars have squat state this bar can be interpret as a reversal one.
The second additional filter is Awesome Oscillator. The Awesome Oscillator (AO), developed by Bill Williams, is a momentum indicator that measures market momentum by comparing recent price action to a longer historical context. It helps traders identify potential trend reversals and the strength of trends. Formula:
AO = SMA5(Median Price) − SMA34(Median Price)
where:
Median Price = (High + Low) / 2
SMA5 = 5-period Simple Moving Average of the Median Price
SMA 34 = 34-period Simple Moving Average of the Median Price
If AO is decreasing momentum is bearish, if increasing - bullish. According to Bill Williams approach reversal bars are the potential trades against the trend. As a result we added second filter for bullish reversal bars AO shall be decreasing, for bearish increasing.
How to use indicator
Apply it to desired chart and time frame. It works on every time frame.
Setup the filters with the "Enable MFI" and "Enable AO" checkboxes in the settings. By default they are turned on.
Analyze the price action. Indicator plotted the white line, this is the lips of an Alligator. It will help you to understand how price is moving in comparison to lips line. Indicator will print the green dot and text "BULL" below it current bar is bullish reversal. It will print the red dot and text "BEAR" above it if current bar is interpreted by algorithm as a bearish reversal.
Set up the alerts if it's needed. Indicator has two custom alerts called "Bullish reversal bar has been printed" and "Bearish reversal bar has been printed"
Disclaimer:
Educational and informational tool reflecting Skyrex commitment to informed trading. Past performance does not guarantee future results. Test indicators before live implementation.
Cerca negli script per "bear"

Candlestick Structure [LuxAlgo]The Candlestick Structure indicator detects major market trends and displays various candlestick patterns aligning with the detected trend, filtering out potentially unwanted patterns as a result. Multiple trend detection methods are included and can be selected by the users.
A dashboard showing the alignment percentage of each individual pattern is also provided.
🔶 USAGE
By distinguishing major and minor trend detection, we can still detect patterns based on minor trends, yet filter out the patterns that do not align with the major trend.
By detecting candlestick patterns that align with a major trend, we can effectively detect the ending points of retracements, potentially providing various entry points of interest within a trend.
Users are able to track the alignment of each candlestick pattern in the dashboard to reveal which patterns typically align with the trend and which may not.
Note: Alignment % only checks if the pattern's direction is the same as the current trend direction. These are only raw readings and not any type of confidence score.
🔶 DETAILS
In this indicator, we are identifying and tracking 16 different Candlestick Patterns.
🔹 Bullish Patterns
Hammer: Identified by a small upper wick (or no upper wick) with a small body, and an elongated lower wick whose length is 2X greater than the candle body’s width.
Inverted Hammer: Identified by a small lower wick (or no lower wick) with a small body, and an elongated upper wick whose length is 2X greater than the candle body’s width.
Bullish Engulfing: A 2 bar pattern identified by a large bullish candle body fully encapsulating (opening lower and closing higher) the previous small (bearish) candle body.
Rising 3: A 5 bar pattern identified by an initial full-bodied bullish candle, followed by 3 bearish candles that trade within the high and low of the initial candle, followed by another full-bodied bullish candle closing above the high of the initial candle.
3 White Soldiers: Identified by 3 full-bodied bullish candles, each opening within the body and closing below the high, of the previous candle.
Morning Star: A 3 bar pattern identified by a full-bodied bearish candle, followed by a small-bodied bearish candle, followed by a full-bodied bullish candle that closes above the halfway point of the first candle.
Bullish Harami: A 2 bar pattern, identified by an initial bearish candle, followed by a small bullish candle whose range is entirely contained within the body of the initial candle.
Tweezer Bottom: A 2 bar pattern identified by an initial bearish candle, followed by a bullish candle, both having equal lows.
🔹 Bearish Patterns
Hanging Man: Identified by a small upper wick (or no upper wick) with a small body, and an elongated lower wick whose length is 2X greater than the candle body’s width.
Shooting Star: Identified by a small lower wick (or no lower wick) with a small body, and an elongated upper wick whose length is 2X greater than the candle body’s width.
Bearish Engulfing: A 2 bar pattern identified by a large bearish candle body fully encapsulating (opening higher and closing lower) the previous small (bullish) candle body.
Falling 3: A 5 bar pattern identified by an initial full-bodied bearish candle, followed by 3 bullish candles that trade within the high and low of the initial candle, followed by another full-bodied bearish candle closing below the low of the initial candle.
3 Black Crows: Identified by 3 full-bodied bearish candles, each open within the body and closing below the low, of the previous candle.
Evening Star: A 3 bar pattern identified by a full-bodied bullish candle, followed by a small-bodied bullish candle, followed by a full-bodied bearish candle that closes below the halfway point of the first candle.
Bearish Harami: A 2 bar pattern, identified by an initial bullish candle, followed by a small bearish candle whose range is entirely contained within the body of the initial candle.
Tweezer Top: A 2 bar pattern identified by an initial bullish candle, followed by a bearish candle, both having equal highs.
🔹 Trend Types
Major trend is displayed at all times, the display will change depending on the trend method selected.
The minor trend can also be visualized; to avoid confusion, the minor trend can optionally be displayed through the candle colors.
Supertrend: Displays Upper and Lower SuperTrend, When we break above the upper, it is considered an Uptrend. When we break below the lower, it is considered a Downtrend.
EMAs: Displays Fast and Slow EMAs, When Fast>Slow, it is considered an Uptrend. When Fast

Weighted Bulls-Bears Variety Smoothed [Loxx]Weighted Bulls-Bears Variety Smoothed highlights potential buy and sell moments in the market. Users can customize the data source and select their preferred type of moving average for calculations. The resulting visualization is a column-style plot that changes color based on bullish or bearish market conditions. Additionally, the script can color chart bars and provide visual markers to indicate buying ("Long") or selling ("Short") opportunities. Alerts can also be set for these trading signals.
█ Inputs:
Users can choose the source for calculations (e.g., closing price).
They can set periods for calculations and smoothing.
They can select the type of moving average they prefer for smoothing: EMA, FEMA, LWMA, SMA, or SMMA.
█ Weighted Bulls-Bears Calculation:
It determines the highest and lowest prices over a user-defined period.
Then, it calculates the 'bull' and 'bear' values based on these highest and lowest prices. These values are weighted based on their distance from the current price.
█ Extras
Alerts
Signals

Adjustable Bull Bear Candle Indicator (V1.2)Indicator Description: Adjustable Bull Bear Candle Indicator
This indicator, named "Adjustable Bull Bear Candle Indicator ," is designed to assist traders in identifying potential bullish and bearish signals within price charts. It combines candlestick pattern analysis, moving average crossovers, and RSI (Relative Strength Index) conditions to offer insights into potential trading opportunities.
Disclaimer:
Trading involves substantial risk and is not suitable for every investor. This indicator is a tool designed to aid in technical analysis, but it does not guarantee successful trades. Always exercise your own judgment and seek professional advice before making any trading decisions.
Key Features:
Preceding Candles Analysis:
The indicator examines the behavior of the previous 'n' candles to identify specific patterns that indicate bearish or bullish momentum.
Candlestick Pattern and Momentum:
It considers the relationship between the opening and closing prices of the current candle to determine if it's bullish or bearish. The indicator then assesses the absolute price difference and compares it to the cumulative absolute differences of preceding candles.
Moving Averages:
The indicator calculates two Simple Moving Averages (SMAs) – Close SMA and Far SMA – to help identify trends and crossovers in price movement.
Relative Strength Index (RSI):
RSI is used as an additional measure to gauge momentum. It analyzes the current price's magnitude of recent gains and losses and compares it to past data.
Time Constraint:
If enabled, the indicator operates within a specific time window defined by the user. This feature can help traders focus on specific market hours.
Customizable Alerts:
The indicator includes an alert system that can be enabled or disabled. You can also adjust the specific alert conditions to align with your trading strategy.
How to Use:
This indicator generates buy signals when specific conditions are met, including a bullish candlestick pattern, positive price difference, closing price above the SMAs, RSI above a threshold, preceding bearish candles, and optionally within a specified time window. Conversely, short signals are generated under conditions opposite to those of the buy signal.
Disclosure and Risk Warning:
Educational Tool: This indicator is meant for educational purposes and to aid traders in their technical analysis. It's not a trading strategy in itself.
Risk of Loss: Trading carries inherent risks, including the potential for substantial loss. Always manage risk and consider using proper risk management techniques.
Diversification: Do not rely solely on this indicator. A well-rounded trading approach includes fundamental analysis, risk management, and proper diversification.
Consultation: It's strongly advised to consult with a financial professional before making any trading decisions.
Conclusion:
The "Bullish Candle after Bearish Candles with Momentum Indicator" can be a valuable tool in your technical analysis toolkit. However, successful trading requires a deep understanding of market dynamics, risk management, and continual learning. Use this indicator in conjunction with other tools and strategies to enhance your trading decisions.
Remember that past performance is not indicative of future results. Always be cautious and informed when participating in the financial markets.

TARVIS Labs - Bitcoin Macro Bottom/Top SignalsSCRIPT DESCRIPTION
This is a script specifically written to help provide indicators from a macro view. This script is best run on the 1 day interval on Bitstamp's $BTCUSD chart. It helps indicate when to accumulate bitcoin, and when its in a bull run when there are local tops, strong top warnings, and a signal to exit a bull run. This is described further below.
If you don't have interest in trading on the way to the top I suggest turning off the following indicators in the settings of the indicator:
- Opportunity To Buy Back In Indicator
- Local Top Near Bull Run Top Indicator
ACCUMULATION ZONE INDICATOR - LIGHT GREEN
Description
When we look at the history of Bitcoin every bottom has crossed below the 100 week EMA. Once it does its accompanied by hash ribbon cross with miner capitulation. After that is the prime time to accumulate as theres a clearer signal the bottom is in. Specifically, a signal to look for is the 14 day MACD/signal cross and the 14 day MACD continuing to stay above the signal until the price returns above the 100 week EMA. This is prime accumulation territory.
Strategy for Usage
A good strategy to use when accumulating the bottom is dollar-cost averaging over a 30 day period. The accumulation zone can last longer than 30 days but 30 days is a good range of time to DCA.
STRONG BUY IN ACCUMULATION ZONE INDICATOR - DARK GREEN
Description
We can add to the bottoming signal by looking for post-downtrend reversals inside the bottoming signal. We do this by using a 9/19 daily cross.
Strategy for Usage
These post-downtrend reversals can potentially provide better targeted days for accumulation than the broader bottoming signal and can be used to add more on that day than on an average day for the dollar cost average strategy. Say for example, use 1/3 of funds on these days rather than 1/30th.
OPPORTUNITY TO BUY BACK IN INDICATOR - BLUE
Description
When the 1d 18 EMA > 1d 63 EMA and the 12/52 1d crosses. These together provide good buy opportunities to buy bitcoin.
Strategy for Usage
If you happen to find yourself out of the market from your own TA or a trade, this signal can provide a buy opportunity to reenter the market if you're out of it.
BULL RUN LOCAL TOP INDICATOR - ORANGE
Description
We will similarly use the 100 week EMA to determine trend reversal into a bull run. When we see the 100 week EMA uptrending, we can begin to look for local tops using the 9/19 daily MACD/signal bearish cross along with the 12 EMA having a negative slope, which could be the beginning signal for a local top.
Strategy for Usage
This is a rather light indicator, but can be used in tandem with your own technical analysis to determine if you want to reenter after you exit from its signal.
LOCAL TOP NEAR BULL RUN TOP INDICATOR - RED
Description
When the 100 week EMA is in an uptrend we can look for significant loss of momentum in order to determine if a local top is in near a bull run top. Similar to the Bull Run Local Top Indicator, this strategy uses a MACD/signal cross but instead uses the 30/65 day EMAs.
Strategy for Usage
Ideally the right strategy to use here is to exit the market when this indicator starts. When the indicator ends if the "End of Bull Run Indicator" is not showing on the chart you can buy back into the market.
TOP IS LIKELY IN INDICATOR
Description
When the 100 week EMA is in a very strong uptrend and the 9/19 weekly MACD/signal bearish cross occurs, and the 63 EMA begins to downtrend.
Strategy for Usage
This signal typically accompanies the "Local Top Near Bull Run Top Indicator" therefore if you're following the strategy you would likely already be out of the market, but if you're not and this signal fires its a strong signal the top is in and we're likely going to start seeing a strong retrace. This is typically right before we see the "End of Bull Run Indicator". There is only one occurrence where it wasn't followed by a large drop & the "End of Bull Run Indicator" and that was in the 2017 bull run where there were many strong retracements post local top. The likelihood we see that again is low, but if it were to happen you can buy back into the market when the "Top is Likely In Indicator" and the "Local Top Near Bull Run Top Indicator" are not firing.
TOP IS LIKELY IN INDICATOR
Description
When the 100 week EMA is in a strong uptrend and the 9/19 weekly MACD/signal bearish cross occurs, and the 63 EMA begins to downtrend.
Strategy for Usage
This signal typically accompanies the "Local Top Near Bull Run Top Indicator" therefore if you're following the strategy you would likely already be out of the market, but if you're not and this signal fires its a strong signal the top is in and we're likely going to start seeing a strong retrace. This is typically right before we see the "End of Bull Run Indicator". There is only one occurrence where it wasn't followed by a large drop & the "End of Bull Run Indicator" and that was in the 2017 bull run where there were many strong retracements post local top. The likelihood we see that again is low, but if it were to happen you can buy back into the market when the "Top is Likely In Indicator" and the "Local Top Near Bull Run Top Indicator" are not firing.
END OF BULL RUN INDICATOR
Description
When the 100 week EMA is in an uptrend and the 1d 18 EMA crosses the 1d 63 EMA.
Strategy for Usage
When the 100 week EMA is a strong uptrend and the 18/63 cross occurs the top is very likely in. It has occurred in every bull run top leading to the bear market.

Short Selling EMA Cross (By Coinrule)BINANCE:AVAXUSDT
This short selling script works best in periods of downtrends and general bearish market conditions, with the ultimate goal to sell as the the price decreases further and buy back before a rebound.
This script can work well on coins you are planning to hodl for long-term and works especially well whilst using an automated bot that can execute your trades for you. It allows you to hedge your investment by allocating a % of your coins to trade with, whilst not risking your entire holding. This mitigates unrealised losses from hodling as it provides additional cash from the profits made. You can then choose to to hodl this cash, or use it to reinvest when the market reaches attractive buying levels.
Entry
The exponential moving average ( EMA ) 20 and EMA 50 have been used for the variables determining the entry to the short. EMAs can operate better than simple moving averages due to the additional weighting placed on the most recent data points, whereas simple moving averages weight all the data the same. This means that price is tracked more closely and the most recent volatile moves can be captured and exploited more efficiently using EMAs.
Our backtesting data revealed that the most profitable timeframe was the 30-minute timeframe, this also enabled a good frequency of trades and high profitability.
A fast (shorter term) exponential moving average , in this strategy the EMA 20, crossing under a slow (longer term) moving average, in this example the EMA 50, signals the price of an asset has started to trend to the downside, as the most recent data signals price is declining compared to earlier data. The entry acts on this principle and executes when the EMA 20 crosses under the EMA 50.
Enter Short: EMA 20 crosses under EMA 50.
Exit
This script utilises a take profit and stop loss for the exit. The take profit is set at -8% and the stop loss is set at +16% from the entry price. This would normally be a poor trade due to the risk:reward equalling 0.5. However, when looking at the backtesting data, the high profitability of the strategy (93.33%) leads to increased confidence and showcases the high probability of success according to historical data.
The take profit (-8%) and the stop loss (+16%) of the strategy are widely placed to ensure the move is captured without being stopped out due to relief rallies. The stop loss also plays a role of mitigating losses and minimising risk of being stuck in a short position once there has been a fundamental trend reversal and the market has become bullish .
Exit Short: -8% price decrease from entry price.
OR
Exit Short: +16% price increase from entry price.
Tip: Research what coins have consistent and large token unlocks / highly inflationary tokenomics, and target these during bear markets to short as they will most likely have substantial selling pressure that outweighs demand - leading to declining prices.
The strategy assumes each order is using 30% of the available coins to make the results more realistic and to simulate you only ran this strategy on 30% of your holdings. A trading fee of 0.1% is also taken into account and is aligned to the base fee applied on Binance.
The backtesting data was recorded from December 1st 2021, just as the market was beginning its downtrend. We therefore recommend analysing the market conditions prior to utilising this strategy as it operates best on weak coins during downtrends and bearish conditions.

Traders Dynamic Index(RSI) w/ Bull&Bear Control ZonesMomentum (RSI) is one of the most commonly used indicators for trading, but the vast majority of traders who use it, simply apply it as an oscillator to measure overbought and oversold conditions. However, momentum is much more complex than that and using a basic RSI fails to highlight these complexities.
What this highlights are some of the areas/zones that many people may not even know about or are unaware what the RSI can actually reveal about a particular trend.
What this indicator is showing:
Fast moving RSI (Green) - 1 period
Slow moving RSI (Red) - 9 period
Bollinger Bands
Relative Strength: 1 - 100
Bearish Control Zone: 30(Below) - 45
Bullish Control Zone: 60 - 70 (Above)
How this identifies trends:
Bear Market(Bearish Control Zone):
-Support: 20(Below) - 30
-Resistance: 55 - 65
-Momentum will test resistance but will fail to hold support at 50
Bull Market(Bullish Control Zone):
-Support: 45 - 50
-Resistance: 80 - 90(Above)
-Momentum will test support but will not continue past the 45 support
How this identifies reversals:
If a market is bullish, but loses support at 45 and tests 30, it has begun reversal. If a market is bearish, but breaks 60 and tests 70, it has begun reversal.
-A bull market reversal is confirmed if it finds resistance at 60 after testing bearish support
-A bear market reversal is confirmed if it finds support at 50 after testing bullish resistance
Slow & Fast RSI w/ Boll Bands:
-The Slow and Fast RSI crossovers will act as Intermediate trends within the Macro trend - Fast crosses slow, bullish. Slow cross fast, bearish.
-Use in confluence with the Macro trend.
-While under Bearish Control, the Slow RSI will act as resistance for the Fast RSI.
-While under Bullish Control, the Slow RSI will act as support for the Fast RSI.
-The two will have an impulsive crossover when the Macro trend reverses.
-The Bollinger Bands will act as a volatility gauge for potential approaching tests of Support & Resistances. (Expansions & Contractions)
This is an analog of TDIGM (GoldMinds)
-Added Bullish/Bearish Control Zones.
-Changed Fast RSI to Green and Slow RSI to Red.

Candlestick Patterns by Dipak V2I am really excited to publish my work, I know its at the beginning but there is a lot to come in the future. I am writing a script to identify the candlestick patterns. In this version, I have added Hammer and Hanging Man Pattern in the first version, I know its less but its a beginning, I will keep adding the new information in my script in upcoming versions.
This script is for only learning purpose and not for treading realtime. In this script, it only identifies the pattern and does not check for its confirmation or does not provide any stop-loss, Also it does not check the prior trend before the pattern. These things really matter in the live trade. But in future, I am planning to add these things.
If you like my work, please like or comment your ideas I will try to include those in upcoming versions.
Hanging Man:
Hanging man is a bearish reversal candlestick pattern that signals about the uptrend or advancing phase are over and bulls have lost their control. Color of the candle is not important.
Identity:
1) Comes after a significant up rally or uptrend or advancing phase.
2) Small real body at the top.
3) Long lower shadow at least twice the real body.
4) Very small or no upper shadow.
Confirmation:
Immediate next candle’s close should be below the hanging man’s real body.
StopLoss:
There is a potential resistance level above the top of the hanging man. Stoploss should be above the resistance area or at the high of the hanging man.
Hammer:
Hammer is a bullish reversal candlestick pattern that signals about the downtrend or declining phase are over and bears have lost their control. Color of the candle is not important.
Identity:
1) Comes after significant down rally or downtrend or declining phase.
2) Small real body at the top.
3) Long lower shadow at least twice the real body.
4) Very small or no upper shadow.
Confirmation:
Immediate next candle’s close should be above the hammer’s low.
StopLoss:
There is a potential support level below the low of the hammer. Stoploss should be below the support area or at the low of the hammer.
Note: The candle is the same for Hanging Man and Hammer , Difference is where they appear in the uptrend or in the downtrend that makes the real difference.

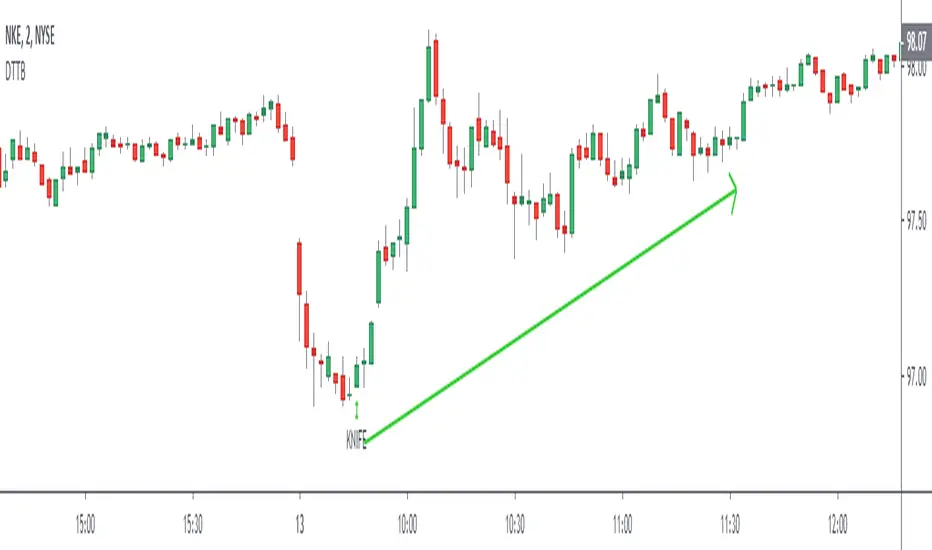
Death To The BearAre you a bear ? RUN!! RUN!! Your life is short here!
Dear friends, I bring you this indicator that you will like, no complexity, just buy signals.
We will try to find possible turning areas, and you will have 6 weapons to use.
Look at the simple configuration:
- BOMB
- KNIFE
- DYNAMITE
- DAGGER
- GUN
- CHEMICAL
- Minimum Level
let's start...
BOMB = high probability of turning
strong bearish trend bombs? it doesn't matter .. does it reach you a 3: 1 ratio? You can make a quick play.
KNIFE = a little more confirmation and excellent weapon to average positions
DYNAMITE = excellent weapon to massively dynamite low areas and also solitary dynamites
DAGGER = excellent weapon to average price
GUN = good shots for patient people who want to average price and look for a more extensive movement
CHEMICAL = I really like this to average the price while I have a nice drink
Minimum Level = you can modify this variable, negative values look for more depth in the market but you will have less signals, positive values look for less depth in the market but you will have more signals, by default = 0
Very simple, without complications!!
aaaa .... but can I activate several weapons at once? of course BOOOOOOMMMM .... poor bears !!!
Anything else? Yes of course....
- All alerts ready to use
LISTEN TO ME ... ADD THE INDICATOR, TAKE YOUR TIME, TEST DIFFERENT CONFIGURATIONS, TEST DIFFERENT TIME FRAMES, TEST DIFFERENT ACTIVE, SEARCH AND FIND, PATIENCE ...... OK READY?
WE WILL MAKE MONEY AND KILL OUR DEAR BEARS!
APPLY A GOOD RISK MANAGEMENT.
NOTE: GOOD INSTRUMENT DATA WITH REAL VOLUME IS REQUIRED
thumbs up!!!!
Engulfing Reversal PatternThe Engulfing Reversal Pattern indicator seeks out both bullish and bearish reversal patterns. This indicator offers the user numerous options to modify the indicator to their needs.
Key features:
Ability to adjust the size of the Engulfing candle in comparison to the prior candle
Ability to adjust the number of breakout candles
Indicator adapts to the Time Frame it is being used in
You can choose between identifying only Bearish patterns, only Bullish patterns or both.
Indicator Arrow size can be adjusted in size.

SCOTTGO - MOMO RVOL Trend Painter V2 (Elite Pro)SCOTTGO - MOMO RVOL Trend Painter V2 (Elite Pro)
This professional-grade trend-following indicator identifies high-probability "Elite" entry points by combining Relative Volume (RVOL) with strict trend alignment and momentum filters. It is designed to filter out market noise and highlight only the most significant institutional moves.
Core Features
Elite Signal Logic: Triggers only when high RVOL (default >2.0x) aligns with a confirmed trend (Price vs. VWAP & 9EMA) and positive momentum (RSI & MACD).
Dynamic Bar Coloring: Instantly paints bars Green (Bullish) or Red (Bearish) when all "Elite" criteria are met.
Smart Labeling: Labels are corner-anchored to the left of the signal bar. This prevents visual clutter and ensures labels never obstruct new price action.
Detailed Tooltips: Hover over any "Elite" flag to see a comprehensive breakdown of the specific metrics (RVOL value, Trend status, RSI, and MACD) that triggered the signal.
Key Components
RVOL Threshold: Adjustable sensitivity to volume spikes.
Trend Filter: Optional requirement for price to stay above/below VWAP and the 9EMA.
Momentum Filters: Integrated RSI and MACD confirmation to avoid "exhaustion" trades.
Visual Customization: Full control over label spacing, colors, and opacity.
How to use: Look for the ⭐ ELITE flags as confirmation for trend continuation or high-volume breakouts. Use the triangles for precise candle entry points.
Disclaimer: Technical analysis tools are for informational purposes only. Trading involves significant financial risk.

SMT Divergence [Kodexius]SMT Divergence is a correlation-based divergence detector built around the Smart Money Technique concept: when two normally correlated instruments should be making similar swing progress, but one prints a new extreme while the other fails to confirm it. This “disagreement” can be a valuable contextual signal around liquidity runs, distribution phases, and potential reversal or continuation points.
The script compares the chart symbol (primary) with a user-selected comparison symbol (for example BTC vs ETH, ES vs NQ, EUR/USD vs GBP/USD) and automatically scans both instruments for confirmed swing highs and swing lows using pivot logic. Once swings are established, it checks for classic SMT conditions:
Primary makes a new swing extreme while the comparison symbol forms a non-confirming swing .
To support a wider range of markets, the indicator includes an Inverse Correlation option for pairs that typically move opposite to each other (for example DXY vs EUR/USD). With this enabled, the divergence rules are logically flipped so that the script still detects “non-confirmation” in a way that is consistent with the pair’s relationship.
The indicator is designed to be readable and actionable. It can draw divergence labels directly on the main chart, connect the relevant swing points with lines, show a compact information table with the last signal and settings, and optionally render the comparison symbol as a mini candle chart in the indicator pane for quick visual validation.
🔹 Features
🔸 Two-Symbol SMT Analysis (Primary vs Compare)
Select any comparison symbol to evaluate correlation structure and divergence. The script fetches the comparison OHLC data using the current chart timeframe to keep both series aligned for analysis.
🔸 Inverse Correlation Mode
For inversely correlated pairs, enable “Inverse Correlation” so the script interprets confirmation appropriately (for example, a higher low on the comparison instrument might be expected to correspond to a lower low on the primary, depending on the relationship). This helps avoid false conclusions when the pair naturally moves opposite.
🔸 Pivot-Based Swing with Adjustable Sensitivity
Swings are detected using confirmed pivots (left bars and right bars). This provides cleaner structural swing points compared with raw candle-to-candle comparisons, and it lets you control sensitivity for different market conditions and timeframes. The script also limits stored swing history to keep performance stable.
🔸 Flexible Detection Mode: Time Matched or Independent Swings
You can choose how swings are paired across instruments:
Time Matched searches for a comparison swing that occurred at the same pivot time as the primary swing.
Independent Swings compares each symbol’s own last two swings without requiring an exact time match.
🔸 Range Control and Noise Filtering
To reduce weak or irrelevant signals:
“Max Bars Between Swings” ensures the two swings being compared are close enough in structure to be meaningful.
“Min Price Diff (%)” can require a minimum percentage change between the primary’s last two swing prices to confirm the move is significant.
🔸 Clear Visual Output with Tooltips
When a divergence is detected, the script can print a label (“SMT”) with bullish or bearish styling and a tooltip that includes the symbol pair and the primary swing price for quick context.
🔸 Divergence Lines for Context
Optional lines connect the relevant swing points, making it easier to see the exact structure that triggered the signal. One line can be drawn on the main chart and another in the indicator pane for the comparison series.
🔸 Info Table (At a Glance)
A compact table can display the active symbols, correlation mode, total divergences stored, and the most recent signal type.
🔸 Alerts Included
Built-in alert conditions are provided for bullish SMT, bearish SMT, and any SMT event so you can automate notifications without editing the code.
🔸 Optional Comparison Candle Panel
If enabled, the indicator can plot the comparison symbol as candles in the indicator pane. This is useful for confirming whether the divergence is happening around major levels, consolidations, or impulsive legs on the secondary instrument.
🔹 Calculations
This section summarizes the core logic used by the script.
1. Data Synchronization (Comparison Symbol)
The comparison instrument is requested on the chart’s current timeframe so swing calculations are performed consistently:
=
request.security(compareSymbolInput, timeframe.period, )
This ensures pivots and swing times are derived from the same bar cadence as the primary chart.
2. Swing Detection via Confirmed Pivots
Swings are detected using pivot logic with user-defined left and right bars:
primaryPivotHigh = ta.pivothigh(high, pivotLeftBars, pivotRightBars)
primaryPivotLow = ta.pivotlow(low, pivotLeftBars, pivotRightBars)
Because pivots are confirmed only after the “right bars” have closed, the script stores each swing using an offset so the swing’s bar index and time reflect where the pivot actually occurred, not where it was confirmed.
3. Swing Storage and Retrieval
Both symbols maintain arrays of SwingPoint objects. Each new swing is pushed into the array, and older swings are dropped once the array exceeds the configured maximum. This makes the divergence engine predictable and prevents uncontrolled memory growth.
The script then retrieves the last and previous swing highs and lows (per symbol) to evaluate structure.
4. Matching Logic (Time Matched vs Independent)
When “Time Matched” is selected, the script searches the comparison swing array for a pivot that occurred at the exact same timestamp as the primary swing. When “Independent Swings” is selected, it simply uses the comparison symbol’s last two swings of the same type.
5. Bullish SMT Condition (LL vs HL)
A bullish SMT event is defined as:
Primary forms a lower low (last low < previous low)
Comparison forms a higher low (last low > previous low)
If inverse correlation is enabled, the comparison condition flips to maintain logical confirmation rules
The two primary swings must be within the configured bar distance window
Optional minimum percentage difference must be satisfied
A simple anti duplication rule prevents repeated triggers on the same structure
These checks are implemented directly in the bullish detection block.
6. Bearish SMT Condition (HH vs LH)
A bearish SMT event is defined as:
Primary forms a higher high (last high > previous high)
Comparison forms a lower high (last high < previous high)
Inverse correlation flips the comparison rule
Range checks, minimum difference filtering, and duplicate protection apply similarly
These checks are implemented in the bearish detection block.
7. Percentage Difference Filter
The optional “Min Price Diff (%)” filter measures the relative distance between the last two primary swing prices. This prevents very small structural changes from being treated as valid SMT signals.
priceDiffPerc = math.abs(lastSwing.price - prevSwing.price) / prevSwing.price * 100.0
The divergence condition is only allowed to trigger if this value exceeds the user defined threshold.
priceOk = priceDiffPerc >= minPriceDiff
This filter is especially useful on higher timeframes or during low volatility conditions, where micro structure noise can otherwise produce misleading signals.
8. Visualization and Output
When a divergence is confirmed, the script:
Stores the event in a divergence array (limited by “Max Divergences to Display”)
Draws a directional SMT label with a tooltip (optional)
Draws connecting lines using time based coordinates for clean alignment (optional)
It also updates an information table on the last bar only, and exposes alertconditions for automation workflows.

RSI Regime & Reversals (Leading) — Bull/Bear Trend Finder📈 RSI Regime & Reversals (Leading) — Bull/Bear Trend Finder
This advanced RSI-based tool helps identify bullish and bearish market trends before they happen — combining classic RSI analysis with Cardwell-style reversals and range shift detection to act as a leading indicator rather than a lagging one.
🧠 Core Concept
The script detects when RSI behavior “shifts ranges,” a signature of trend changes:
• Bull Regime — RSI pullbacks hold above ~40 (momentum stays strong)
• Bear Regime — RSI rallies stall below ~60 (momentum weakens)
It then looks for leading clues inside those regimes:
• ✅ Positive Reversal: Price makes a higher low while RSI makes a lower low — a bullish continuation or early trend reversal signal.
• ❌ Negative Reversal: Price makes a lower high while RSI makes a higher high — an early warning of weakness.
• 🔁 Classic Divergences: Confirms reversals when RSI and price diverge at pivot points.
🎯 Signals
• Green “▲ Bull lead” — bullish reversal or divergence detected.
• Red “▼ Bear lead” — bearish reversal or divergence detected.
• Optional background shading:
• 🟩 Teal = Bullish regime
• 🟥 Red = Bearish regime
⚙️ Customization
• Regime sensitivity — Adjust RSI floor/ceiling for your asset’s volatility.
• Pivot sensitivity — Tune pivot lookback (L/R bars) for faster or slower signals.
• RSI smoothing — Filters noise without losing responsiveness.
• Alerts included — Trigger TradingView alerts for bullish or bearish leading signals.
🕵️♂️ Why it’s different
Unlike standard RSI divergences (which confirm after the move), this indicator uses positive/negative reversals to identify potential trend shifts early — a technique favored by Andrew Cardwell’s RSI analysis.
📊 Works great for:
• Swing trading and trend detection
• Spotting momentum regime shifts
• Stocks, crypto, FX, indices

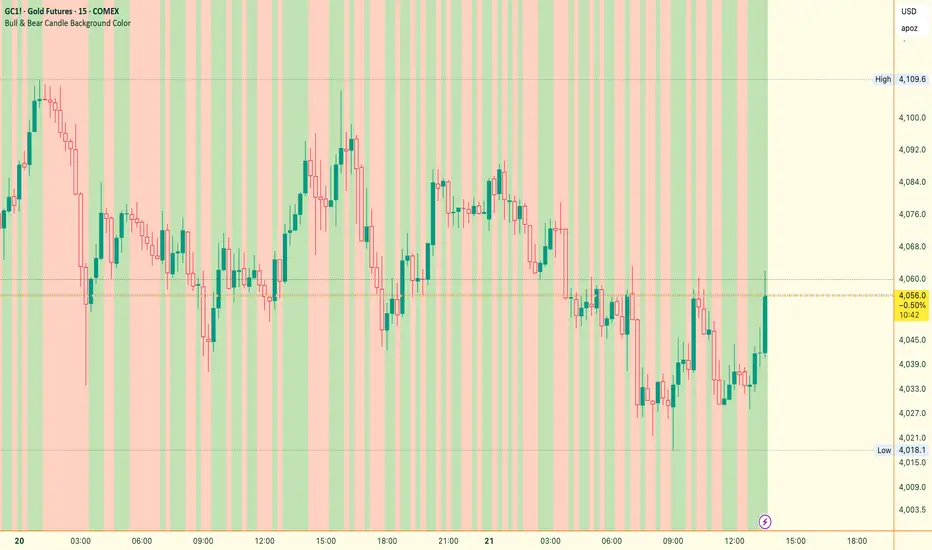
Bull & Bear Candle By Background ColorThe essential chart overlay for high-speed momentum confirmation.
This professional-grade Pine Script v5 indicator provides instant, unfiltered visual feedback on the market's immediate bias by coloring the chart background based on the short-term relationship between Close and Open. It’s designed to streamline decision-making and enhance trade conviction.
Why Traders Use This Tool
In dynamic markets, reading momentum rapidly is critical. This indicator removes visual clutter and cognitive lag.
Zero-Lag Momentum Filter: Instantly identifies if control belongs to buyers (Close > Open) or sellers (Close < Open). A sustained background color acts as a directional bias filter for all your setups.
Trade Confirmation & Conviction: Use the background color as a high-level confluence factor. Only execute Long trades when the background is Bullish and Short trades when it is Bearish. This drastically reduces counter-trend entries.
Risk Management Signal: The appearance of the Neutral/Doji Color flags market equilibrium and consolidation, often preceding a critical structural shift. This is your immediate signal to tighten stops or prepare for a potential reversal setup.
Dual Confirmation: The script offers a highly requested feature: Bar Coloring layered atop the background to provide a second, granular layer of visual context, making momentum shifts impossible to miss.
⚙️ Key Features & Settings Usage
All settings are optimized for clarity, using high transparency to prevent the indicator from obscuring underlying price action or other analytical tools.
🎨 Background Color Settings (Primary)
These controls allow you to define the market state you are reading:
1. Background: Bullish Color: Confirms short-term buying pressure (Close > Open). Set a distinct color for confirmed upward momentum.
2. Background: Bearish Color: Confirms short-term selling pressure (Close < Open). Set a high-contrast color for immediate recognition of downward pressure.
3. Background: Neutral/Doji Color: Signals market indecision (Close ≈ Open). Use as a caution flag, highlighting pivot points and ranging periods.
✨ Added Feature: Bar Coloring
4. FEATURE: Enable Bar Coloring: When enabled, the individual candles are colored with a lighter hue matching the background. This provides dual visual confirmation, maximizing impact on lower timeframes where momentum flips quickly.
🧭 How to Achieve Confluence
Entry Filter: Wait for the background color to flip to your desired direction, then seek your primary entry signal (e.g., breakout, pullback, or MACD cross).
Trade Hold: As long as the background color remains consistent, the short-term momentum is confirmed, justifying the continuation of your trade.
Exit Signal: A flip to the Neutral/Doji Color should be treated as a warning shot, signaling a mandatory review of your position and stops.
Disclaimer: This indicator is a powerful visual and confirmation tool and does not generate buy/sell signals on its own. It is designed to be used in conjunction with your established trading strategy and comprehensive risk management principles
The Bear & Bull TieWhat it does:
Bear & Bull Tie is a moving average crossover indicator that identifies trend reversals and generates entry/exit signals based on the relationship between price and three simple moving averages (SMA 21, SMA 55, SMA 89). The indicator combines these three MAs into an Average Moving Average (AMA) to confirm directional bias, then uses ATR (Average True Range) volatility measurement for dynamic position sizing and stop-loss placement.
How it works:
The indicator operates on a simple but effective principle: it enters a bullish trend when price closes above all three moving averages simultaneously, and enters a bearish trend when price closes below all three MAs simultaneously. This "three MA alignment" approach filters out noise and confirms genuine trend changes. The indicator then plots:
Entry levels at the highest MA during uptrends or lowest MA during downtrends
Stop-loss zones calculated using 2x ATR distance from entry prices
Trend confirmation fill between price and the Average Moving Average, color-coded blue for bullish and red for bearish
The ATR-based stop-loss sizing adapts to market volatility, making it suitable for different market conditions and timeframes.
How to use it:
Monitor the filled zones to visually confirm your trend bias
Watch for alerts when new long or short setups form; entry prices and ATR-based stops are displayed on the chart
Trade the zones between your entry level and stop-loss zone, adjusting position size based on your risk tolerance
Exit when colors reverse to indicate trend termination
The indicator works best on higher timeframes (1H and above) where trend clarity is stronger and false signals are reduced.
Alerts: FOR AUTOMATION / NOTIFICATION's (create an alert for B/B tie (2, 4) that uses Any Alert / Function Call )
Long Positions:
entries ---> "Bull Tie on NVDA | Entry : 100.5 | ATR Stop : 99.5"
exits ------> "Bull Tie on NVDA | Exit : 110.1"
Short Positions:
entries ---> "Bear Tie on NVDA | Entry : 120.05 | ATR Stop : 85.05"
exits -----> "Bear Tie on NVDA | Exit : 100"
Credits:
This script incorporates concepts and code portions from @LOKEN94 with his explicit permission. Special thanks for the foundational logic that inspired this development.
Disclaimer:
This indicator is for educational and analytical purposes. It is not financial advice. Past performance does not guarantee future results. Always manage risk properly and use stops. Test thoroughly on historical data before live trading.

BTC Bull/Bear marketThis indicator plots the 350-period Simple Moving Average (SMA) calculated on the Daily ("D") timeframe.
he color of the SMA line is determined by the closing price of the 2-Week ("2W") timeframe.
1. It fetches the 350-day SMA value (`sma350_daily`).
2. It checks where the *last closed* 2-Week candle finished relative to this SMA line.
3. If the 2W candle closed *above* the 350 SMA, the line is colored GREEN.
4. If the 2W candle closed *below* the 350 SMA, the line is colored RED.
This helps to visualize the long-term trend (350 SMA) confirmed by a higher (2W) timeframe bias, using non-repainting logic (`close `) for the color signal.

Bull Bear Indicator# Bull Bear Indicator - TradingView Script Description
## Overview
The Bull Bear Indicator is a powerful visual tool that instantly identifies market sentiment by coloring all candlesticks based on their position relative to a moving average. This indicator helps traders quickly identify bullish and bearish market conditions at a glance.
## Key Features
### 🎨 Visual Bull/Bear Identification
- **Green Candles**: Price is at or above the moving average (Bullish condition)
- **Red Candles**: Price is below the moving average (Bearish condition)
- Complete candle coloring including body, wicks, and borders for maximum clarity
### 📊 Flexible Moving Average Options
- **MA Type**: Choose between Simple Moving Average (MA) or Exponential Moving Average (EMA)
- **Timeframe**: Select Weekly or Daily timeframe for the moving average calculation
- **Customizable Period**: Adjust the MA/EMA period (default: 50)
### 📈 Smooth Moving Average Line
- Displays a smooth blue moving average line on the chart
- Automatically adapts to your selected timeframe and MA type
- Provides clear visual reference for trend identification
## How It Works
The indicator calculates a moving average (MA or EMA) based on your selected timeframe (Weekly or Daily). It then compares the current price to this moving average:
- **Bull Market**: When price ≥ Moving Average → Candles turn **GREEN**
- **Bear Market**: When price < Moving Average → Candles turn **RED**
## Configuration Options
1. **MA Type**: Choose "MA" for Simple Moving Average or "EMA" for Exponential Moving Average
2. **Timeframe**: Select "Weekly" for weekly-based MA or "Daily" for daily-based MA
3. **MA Period**: Set the number of periods for the moving average calculation (default: 50)
## Use Cases
- **Trend Identification**: Quickly identify overall market trend direction
- **Entry/Exit Signals**: Use color changes as potential entry or exit signals
- **Multi-Timeframe Analysis**: Combine with different chart timeframes for comprehensive analysis
- **Visual Clarity**: Reduce chart clutter while maintaining essential trend information
## Best Practices
- Use Weekly MA for longer-term trend identification
- Use Daily MA for shorter-term trend analysis
- Combine with other technical indicators for confirmation
- Adjust the MA period based on your trading style and timeframe
## Technical Details
- Built with Pine Script v6
- Overlay indicator (displays on main chart)
- Optimized for performance
- Compatible with all TradingView chart types
---
**Note**: This indicator is for educational and informational purposes only. Always conduct your own analysis and risk management before making trading decisions.

RSI + Elder Bull-Bear pressure RSI + Bull/Bear (Elder-Ray enhanced RSI)
What it is
An extended RSI that overlays Elder-Ray Bull/Bear Power on the same, zero-centered scale. You get classic RSI regime cues plus a live read of buy/sell pressure, with optional smoothing, bands, and right-edge value labels.
Key features
RSI with bands – default bands 30 / 50 / 70 (editable).
Bull/Bear Power (Elder) – ATR-normalized; optional EMA/SMA/RMA/HMA smoothing.
One-pane overlay – RSI and Bull/Bear share a common midline (RSI-50 ↔ panel 0).
Right-edge labels – always visible at the chart’s right margin with adjustable offsets.
How to read it
Cyan line = RSI (normalized)
Above the mid band = bullish regime; below = bearish regime.
Green = Bull Power, Red = Bear Power
Columns/lines above 0 show buy pressure; below 0 show sell pressure.
Smoothing reduces noise; zero-line remains your key reference.
Trade logic (simple playbook)
Entry
BUY (primary):
RSI crosses up through 50 (regime turns bullish), and
Bull (green) crosses up through 0 (buy pressure confirms).
SELL (primary):
RSI crosses down through 50, and
Bear (red) crosses down through 0 (sell pressure confirms).
Alternative momentum entries
Aggressive BUY: Bull (green) pushes above RSI-80 band (strong upside impulse).
Aggressive SELL: Bear (red) pushes below RSI-30 band (strong downside impulse).
Exits / trade management
In a long: consider exiting or tightening stops if Bear (red) dips below the 0 line (rising sell pressure) or RSI loses 50.
In a short: consider exiting or tightening if Bull (green) rises above 0 or RSI reclaims 50.
Tip: “0” on the panel is your pressure zero-line (maps to RSI-50). Most whipsaws happen near this line; smoothing (e.g., EMA 21) helps.
Defaults (on first load)
RSI bands: 30 / 50 / 70 with subtle fills.
Labels: tiny, pushed far right (large offsets).
Bull/Bear smoothing: EMA(21), smoothed line plot mode.
RSI plotted normalized so it overlaps the pressure lines cleanly.
Tighten or loosen the Bull/Bear thresholds (e.g., Bull ≥ +0.5 ATR, Bear ≤ −0.5 ATR) to demand stronger confirmation.
Settings that matter
Smoothing length/type – balances responsiveness vs. noise.
Power/RSI Gain – visual scaling only (doesn’t change logic).
Band placement – keep raw 30/50/80 or switch to “distance from 50” if you prefer symmetric spacing.
Label offsets – move values clear of the last bar/scale clutter.
Good practices
Combine with structure/ATR stops (e.g., 1–1.5× ATR, swing high/low).
In trends, hold while RSI stays above/below 50 and the opposite pressure line doesn’t dominate.
In ranges, favor signals occurring near the mid band and take profits at the opposite band.
Disclaimer: This is a research/visual tool, not financial advice at any kind. Test your rules on multiple markets/timeframes and size positions responsibly.

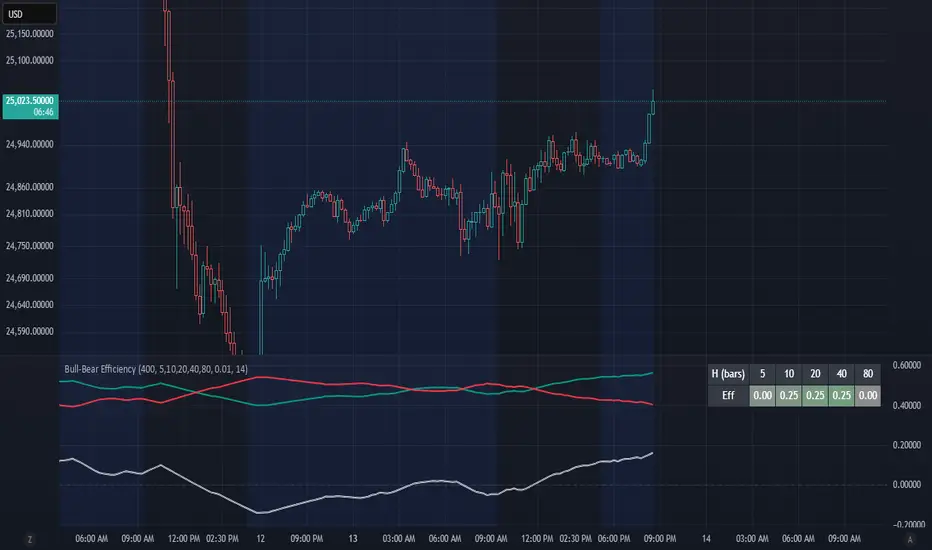
Bull-Bear EfficiencyBull-Bear Efficiency
This indicator measures the directional efficiency of price movement across many historical entry points to estimate overall market bias. It is designed as a trend gauge rather than a timing signal.
Concept
For each historical bar (tau) and a chosen lookahead horizon (h), the script evaluates how efficiently price has traveled from that starting point to the endpoint. Efficiency is defined as the net price change divided by the total absolute movement that occurred along the path.
Formula:
E(tau,h) = ( Price - Price ) / ( Sum from i = tau+1 to tau+h of | Price - Price | )
This measures how "straight" the path was from the entry to the current bar:
If price moved steadily upward, the numerator and denominator are nearly equal, and E approaches +1 (efficient bullish trend).
If price moved steadily downward, E approaches -1 (efficient bearish trend).
If price chopped back and forth, the denominator grows faster than the numerator, and E approaches 0 (inefficient movement).
The algorithm computes this efficiency for many past starting points and multiple horizons, optionally normalizing by ATR to account for volatility. The efficiencies are then weighted by recency to emphasize more recent behavior.
From this, the script derives:
Bull = weighted average of positive efficiencies
Bear = weighted average of negative efficiencies (absolute value)
Net = Bull - Bear (net directional efficiency)
Interpretation
Bull, Bear, and Net quantify how coherently the market has been trending.
Bull near 1.0, Bear near 0.0, Net > 0 -> clean upward trends; long positions have been more efficient.
Bear near 1.0, Bull near 0.0, Net < 0 -> clean downward trends; short positions have been more efficient.
Bull and Bear both small or similar -> low-efficiency, range-bound environment.
Net therefore acts as a "trend coherence index" that measures whether price action is directionally organized or noisy.
Practical Use
Trend filter:
Apply trend-following systems only when Net is strongly positive or negative.
Avoid them when Net is near zero.
Regime change detection:
Crossings through zero often correspond to transitions between trending and ranging regimes.
Momentum loss detection:
If price makes new highs but Net or Bull weakens, it suggests trend exhaustion.
Settings Overview
Lookback: Number of historical bars considered as entry points (tau values).
Horizons: List of forward projection lengths (in bars) for measuring efficiency.
Recency Decay (lambda): Exponential weighting that emphasizes recent data.
Normalize by ATR: Adjusts "effort" to account for volatility changes.
Display Options: Toggle Bull, Bear, Net, or Signed Average (S). Customize line colors.
Notes
This indicator does not produce entry or exit signals.
It is a statistical tool that measures how efficiently price has trended over time.
High Net values indicate smooth, coherent trends.
Low or neutral Net values indicate noisy, directionless conditions.
TRAPPER TRENDLINES — RSIBuilds dynamic RSI trendlines by connecting the two most recent confirmed RSI swing points (highs→highs for resistance, lows→lows for support). Includes optional channel shading for the 30–70 zone, an RSI moving average, clean break alerts, and simple bullish/bearish divergence alerts versus price.
How it works
RSI pivots: A point on RSI is a swing high/low only if it is the most extreme value compared with a set number of bars on the left and the right (the Pivot Lookback).
RSI trendlines:
Resistance connects the last two confirmed RSI swing highs.
Support connects the last two confirmed RSI swing lows.
Lines can be Full Extend (update into the future) or Pivot Only.
Channel block: Optional fill of the 30–70 range for fast visual context.
Alerts:
Breaks of RSI support/resistance trendlines.
Basic bullish/bearish RSI divergences versus price pivots.
Inputs
RSI
RSI Length: Default 14 (standard).
Pivot Lookback: Bars to the left/right required to confirm an RSI swing.
Overbought / Oversold: 70 / 30 by default.
Line Extension: Full Extend or Pivot Only.
Visuals
Show RSI Moving Average / Signal Length: Optional smoothing line on RSI.
RSI/Signal colors: Customize plot colors.
Show 30–70 Channel Block: Toggle the middle-zone fill.
Tint pane background when RSI in channel: Optional subtle background when RSI is between OB/OS.
Divergences & Alerts
Enable RSI TL Break Alerts: Alert conditions for RSI line breaks.
Enable Divergence Alerts: Bullish/Bearish divergence alerts versus price.
Pairing with price for confluence/divergence
For accurate confluence and clearer divergences, align this RSI tool with your price trendline tool (for example, TRAPPER TRENDLINES — PRICE):
Set RSI Pivot Lookback equal to the Pivot Left/Right size used on price.
Example: Price uses Pivot Left = 50 and Pivot Right = 50 → set RSI Pivot Lookback = 50.
Keep RSI Length = 14 and OB/OS = 70/30 unless you have a specific edge.
Interpretation:
Confluence: Price reacts at its trendline while RSI reacts at its own line in the same direction.
Divergence: Price makes a higher high while RSI makes a lower high (bearish), or price makes a lower low while RSI makes a higher low (bullish), using matched pivot windows.
Suggested settings
Higher timeframes (4H / 1D / 1W): Pivot Lookback = 50; optional RSI MA length 14; channel block ON.
Intraday (15m / 30m / 1H): Pivot Lookback = 30; optional RSI MA length 14.
Always mirror your price pivot size to this RSI Pivot Lookback for consistent swings.
Reading the signals
RSI trendline touch/hold: Momentum reacting at structure; look for confluence with price levels.
RSI Trendline Break Up / Down: Momentum shift; consider price structure and retests.
Bullish/Bearish Divergence: Confirm only when pivots are matched and the new swing is confirmed.
Notes & limitations
Pivots require future bars to confirm by design; trendlines update as new swings confirm.
Divergence logic compares RSI pivots to price pivots with the same lookback; mismatched windows can produce false positives.
No strategy entries/exits or performance claims are provided. This is an analytical tool.
Alerts (titles/messages)
RSI: Trendline Break Up — “RSI broke falling resistance line.”
RSI: Trendline Break Down — “RSI broke rising support line.”
RSI: Bullish Divergence — “Bullish RSI divergence confirmed.”
RSI: Bearish Divergence — “Bearish RSI divergence confirmed.”
Quick start
Add the indicator to a separate pane.
Set Pivot Lookback to match your price tool’s pivot size (e.g., 50).
Optionally toggle the RSI MA and Channel Block for clarity.
Enable alerts if you want notifications on RSI line breaks and divergences.
Use with TRAPPER TRENDLINES — PRICE or any price-based trendline tool for confluence/divergence analysis.
Compliance
This script is for educational purposes only and does not constitute financial advice. Trading involves risk. Past performance does not guarantee future results. No performance claims are made.

Greer Gap# Greer Gap Indicator (No mitigation: i.e. removing false signals)
## Summary
The **Greer Gap Indicator** identifies **Fair Value Gaps (FVGs)** and introduces specialized **Greer Bull Gaps (Blue)** and **Greer Bear Gaps (Orange)** to highlight high-probability trading opportunities. Unlike traditional FVG indicators, it avoids hindsight bias by not removing historical gaps based on future price action, ensuring transparency in signal accuracy. Built upon LuxAlgo’s FVG logic, it adds unique filtering: only the first Greer Gap after an opposite gap is plotted if its level (min for Bull, max for Bear) is not higher/lower than the previous Greer Gap of the same type, while all valid gaps are recorded for comparison. Traders can use these gaps as support/resistance or entry signals, customizable via timeframe, look back, and display options.
## Description
This indicator detects and displays **Fair Value Gaps (FVGs)** on the chart, with a focus on specialized **Greer Gaps**:
- **Bullish Gaps (Green)**: Areas where the low of the current candle is above the high of a previous candle (look back period), indicating potential upward momentum.
- **Bearish Gaps (Red)**: Areas where the high of the current candle is below the low of a previous candle, indicating potential downward momentum.
- **Greer Bull Gaps (Blue)**: A bullish gap that is above the latest bearish gap's max. Only the first such gap after a bearish gap is plotted if it meets criteria (not higher than the previous Greer Bull Gap's min), but all valid ones are recorded for comparison.
- **Greer Bear Gaps (Orange)**: A bearish gap that is below the latest bullish gap's min. Only the first such gap after a bullish gap is plotted if it meets criteria (not lower than the previous Greer Bear Gap's max), but all valid ones are recorded.
## How It Works
The script uses a dynamic look back period to detect FVGs. It maintains a record of all detected gaps and applies additional logic for Greer Gaps:
- **Greer Bull Gaps**: Checks if the new bullish gap's min is above the latest bearish gap's max. Plots only if it's the first since the last bearish gap and its min is <= previous Greer Bull min (or first one).
- **Greer Bear Gaps**: Checks if the new bearish gap's max is below the latest bullish gap's min. Plots only if it's the first since the last bullish gap and its max is >= previous Greer Bear max (or first one).
- **Resets**: A new bearish gap resets the Greer Bull Gap flag, and a new bullish gap resets the Greer Bear Gap flag.
## How to Use
- **Timeframe**: Set a higher timeframe (e.g., 'D' for daily) to detect gaps from that timeframe on the current chart.
- **Look back Period**: Adjust to change gap detection sensitivity (default: 34). Use 2 if you want to compare to LuxAlgo
- **Extend**: Controls how far right the gap boxes extend.
- **Show Options**: Toggle visibility of all bullish/bearish gaps or Greer Gaps.
- **Colors**: Customize colors for each gap type.
- **Application**: Use Greer Gaps as potential support/resistance levels or entry signals, but combine with other analysis for confirmation.
## Originality and Credits
This script is inspired by and builds upon the **"Fair Value Gap "** indicator by LuxAlgo (available on TradingView: ()).
**Credits**: Thanks to LuxAlgo for the core FVG detection logic.
**Significant Changes**:
- Added **Greer Bull and Bear Gap** logic for filtered, directional gaps with reset mechanisms.
- Introduced recording of all valid Greer Gaps without plotting all, to compare levels without hindsight bias.
- **No mitigation/removal of gaps**: Unlike LuxAlgo's approach, which mitigates (removes or alters) gaps based on future price action (e.g., when filled), this can create a hindsight bias where incorrect signals disappear over time. If a signal is used for a trade and later removed due to new data, it doesn't reflect real-time performance accurately. The Greer Gap avoids this by using gap comparisons to validate signals without altering historical boxes, ensuring transparency in when signals were right or wrong.

WA-%Chg with BackgroundDescription
The WA-%Chg with Background indicator measures the percentage change in a selected price source over a user-defined period. It allows traders to visually and quickly assess bullish and bearish momentum through dynamic color coding and background shading.
Percentage Change Calculation – Uses ta.roc to determine the rate of change over the chosen length.
Customizable Alerts – Set upper (HiAlert) and lower (LoAlert) thresholds to get notified when momentum crosses bullish or bearish trigger levels.
Dynamic Line Coloring – Blue when above the bullish threshold, red when below the bearish threshold, and gray when in neutral territory.
Background Highlighting – Light blue shading for bullish zones, light red shading for bearish zones.
User Customization – Modify calculation length, colors, and alert thresholds to suit your trading style.
This tool is useful for identifying breakout conditions, momentum shifts, and potential reversals at a glance. Traders can combine it with other indicators for confirmation.
Disclaimer
This indicator is provided for educational purposes only and should not be considered financial advice. Past performance of any indicator or strategy is not indicative of future results. Trading in financial markets involves significant risk, including the risk of losing capital. Always perform your own analysis and consult with a qualified financial advisor before making any investment decisions. The author assumes no liability for any losses incurred from the use of this tool.

✨Smart Option MACD: Bullish, Bearish, Neutral Logic by AKM ✨The **Smart Option MACD: Bullish, Bearish, Neutral Logic by AKM** is an advanced indicator designed for TradingView, tailored for option traders on indices like NIFTY. It automates options trend scanning by applying MACD analysis to both Call (CE) and Put (PE) options near the ATM (At-The-Money) strike, providing actionable market states—Bullish, Bearish, or Neutral—using distinct logic for both strikes and overall market context.
***
### Core Features
- **Option Selection Logic:** The script dynamically calculates ATM, CE, and PE strike prices based on the underlying index spot price and customizable user inputs for expiry, strike distance, and OTM/ITM shift.
- **MACD on Option Prices:** For both CE and PE symbols, the indicator computes the MACD (Moving Average Convergence Divergence) and Signal lines. It uses standard MACD settings: 12-period EMA (fast), 26-period EMA (slow), and 9-period Signal.
- **Strike Status Classification:**
- AZL 🔼: Indicates MACD > 0 for that option, signifying positive momentum.
- BZL 🔽: Indicates MACD 0 & crossover up), PE is bearish (MACD<0 & crossover down).
- **Bearish:** PE is bullish & crossover up, CE is bearish & crossover down.
- **Neutral:** All other scenarios—including mixed or undefined signals.
***
### Table Output
A real-time table is displayed on the chart (top-right) with key option and market details:
- Spot price
- ATM Strike
- CE/PE strike status (momentum + crossover logic)
- Option prices
- Overall market state, color-coded for clarity
***
### How to Use This Indicator
- **Entry Signal:** Use the Bullish/Bearish status for directional trades or option strategies. Bullish calls for buying or selling upward momentum options; Bearish favors downside trades. Neutral advises caution or range-bound trades.
- **Customizability:** Expiry, strike width, OTM/ITM offset, and chart resolution are user-controlled, allowing adaptation to different market contexts.
- **Best Practice:** Use alongside price action, support/resistance zones and other indicators to confirm options momentum, as MACD is powerful yet not infallible.
***
### Who Is It For?
- **Option traders** who want to automate trend/momentum detection for CE/PE strikes instead of manual chart switching.
- **Index traders** (NIFTY, BANKNIFTY...) seeking systematic edge in intraday/positional strategies tied to option momentum.
- **Technical analysts** interested in visual, rule-based signals combining options data and classic MACD logic.
***
The Smart Option MACD indicator streamlines multi-strike, multi-option momentum analysis and presents clear actionable logic directly on your chart for enhanced decision-making. Use it as a core part of your TradingView toolkit for options-focused market views.
