Bull Bear Indicator# Bull Bear Indicator - TradingView Script Description
## Overview
The Bull Bear Indicator is a powerful visual tool that instantly identifies market sentiment by coloring all candlesticks based on their position relative to a moving average. This indicator helps traders quickly identify bullish and bearish market conditions at a glance.
## Key Features
### 🎨 Visual Bull/Bear Identification
- **Green Candles**: Price is at or above the moving average (Bullish condition)
- **Red Candles**: Price is below the moving average (Bearish condition)
- Complete candle coloring including body, wicks, and borders for maximum clarity
### 📊 Flexible Moving Average Options
- **MA Type**: Choose between Simple Moving Average (MA) or Exponential Moving Average (EMA)
- **Timeframe**: Select Weekly or Daily timeframe for the moving average calculation
- **Customizable Period**: Adjust the MA/EMA period (default: 50)
### 📈 Smooth Moving Average Line
- Displays a smooth blue moving average line on the chart
- Automatically adapts to your selected timeframe and MA type
- Provides clear visual reference for trend identification
## How It Works
The indicator calculates a moving average (MA or EMA) based on your selected timeframe (Weekly or Daily). It then compares the current price to this moving average:
- **Bull Market**: When price ≥ Moving Average → Candles turn **GREEN**
- **Bear Market**: When price < Moving Average → Candles turn **RED**
## Configuration Options
1. **MA Type**: Choose "MA" for Simple Moving Average or "EMA" for Exponential Moving Average
2. **Timeframe**: Select "Weekly" for weekly-based MA or "Daily" for daily-based MA
3. **MA Period**: Set the number of periods for the moving average calculation (default: 50)
## Use Cases
- **Trend Identification**: Quickly identify overall market trend direction
- **Entry/Exit Signals**: Use color changes as potential entry or exit signals
- **Multi-Timeframe Analysis**: Combine with different chart timeframes for comprehensive analysis
- **Visual Clarity**: Reduce chart clutter while maintaining essential trend information
## Best Practices
- Use Weekly MA for longer-term trend identification
- Use Daily MA for shorter-term trend analysis
- Combine with other technical indicators for confirmation
- Adjust the MA period based on your trading style and timeframe
## Technical Details
- Built with Pine Script v6
- Overlay indicator (displays on main chart)
- Optimized for performance
- Compatible with all TradingView chart types
---
**Note**: This indicator is for educational and informational purposes only. Always conduct your own analysis and risk management before making trading decisions.
Cerca negli script per "bear"

RSI + Elder Bull-Bear pressure RSI + Bull/Bear (Elder-Ray enhanced RSI)
What it is
An extended RSI that overlays Elder-Ray Bull/Bear Power on the same, zero-centered scale. You get classic RSI regime cues plus a live read of buy/sell pressure, with optional smoothing, bands, and right-edge value labels.
Key features
RSI with bands – default bands 30 / 50 / 70 (editable).
Bull/Bear Power (Elder) – ATR-normalized; optional EMA/SMA/RMA/HMA smoothing.
One-pane overlay – RSI and Bull/Bear share a common midline (RSI-50 ↔ panel 0).
Right-edge labels – always visible at the chart’s right margin with adjustable offsets.
How to read it
Cyan line = RSI (normalized)
Above the mid band = bullish regime; below = bearish regime.
Green = Bull Power, Red = Bear Power
Columns/lines above 0 show buy pressure; below 0 show sell pressure.
Smoothing reduces noise; zero-line remains your key reference.
Trade logic (simple playbook)
Entry
BUY (primary):
RSI crosses up through 50 (regime turns bullish), and
Bull (green) crosses up through 0 (buy pressure confirms).
SELL (primary):
RSI crosses down through 50, and
Bear (red) crosses down through 0 (sell pressure confirms).
Alternative momentum entries
Aggressive BUY: Bull (green) pushes above RSI-80 band (strong upside impulse).
Aggressive SELL: Bear (red) pushes below RSI-30 band (strong downside impulse).
Exits / trade management
In a long: consider exiting or tightening stops if Bear (red) dips below the 0 line (rising sell pressure) or RSI loses 50.
In a short: consider exiting or tightening if Bull (green) rises above 0 or RSI reclaims 50.
Tip: “0” on the panel is your pressure zero-line (maps to RSI-50). Most whipsaws happen near this line; smoothing (e.g., EMA 21) helps.
Defaults (on first load)
RSI bands: 30 / 50 / 70 with subtle fills.
Labels: tiny, pushed far right (large offsets).
Bull/Bear smoothing: EMA(21), smoothed line plot mode.
RSI plotted normalized so it overlaps the pressure lines cleanly.
Tighten or loosen the Bull/Bear thresholds (e.g., Bull ≥ +0.5 ATR, Bear ≤ −0.5 ATR) to demand stronger confirmation.
Settings that matter
Smoothing length/type – balances responsiveness vs. noise.
Power/RSI Gain – visual scaling only (doesn’t change logic).
Band placement – keep raw 30/50/80 or switch to “distance from 50” if you prefer symmetric spacing.
Label offsets – move values clear of the last bar/scale clutter.
Good practices
Combine with structure/ATR stops (e.g., 1–1.5× ATR, swing high/low).
In trends, hold while RSI stays above/below 50 and the opposite pressure line doesn’t dominate.
In ranges, favor signals occurring near the mid band and take profits at the opposite band.
Disclaimer: This is a research/visual tool, not financial advice at any kind. Test your rules on multiple markets/timeframes and size positions responsibly.

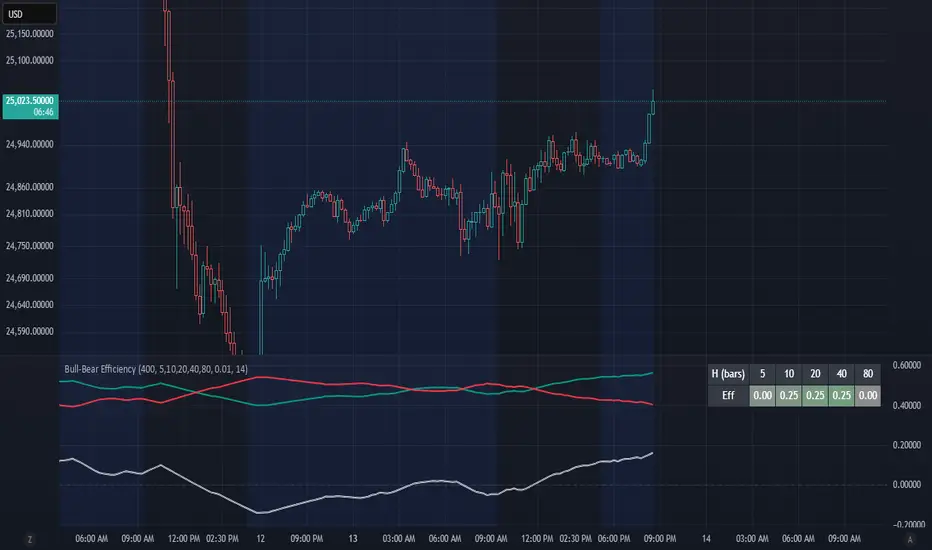
Bull-Bear EfficiencyBull-Bear Efficiency
This indicator measures the directional efficiency of price movement across many historical entry points to estimate overall market bias. It is designed as a trend gauge rather than a timing signal.
Concept
For each historical bar (tau) and a chosen lookahead horizon (h), the script evaluates how efficiently price has traveled from that starting point to the endpoint. Efficiency is defined as the net price change divided by the total absolute movement that occurred along the path.
Formula:
E(tau,h) = ( Price - Price ) / ( Sum from i = tau+1 to tau+h of | Price - Price | )
This measures how "straight" the path was from the entry to the current bar:
If price moved steadily upward, the numerator and denominator are nearly equal, and E approaches +1 (efficient bullish trend).
If price moved steadily downward, E approaches -1 (efficient bearish trend).
If price chopped back and forth, the denominator grows faster than the numerator, and E approaches 0 (inefficient movement).
The algorithm computes this efficiency for many past starting points and multiple horizons, optionally normalizing by ATR to account for volatility. The efficiencies are then weighted by recency to emphasize more recent behavior.
From this, the script derives:
Bull = weighted average of positive efficiencies
Bear = weighted average of negative efficiencies (absolute value)
Net = Bull - Bear (net directional efficiency)
Interpretation
Bull, Bear, and Net quantify how coherently the market has been trending.
Bull near 1.0, Bear near 0.0, Net > 0 -> clean upward trends; long positions have been more efficient.
Bear near 1.0, Bull near 0.0, Net < 0 -> clean downward trends; short positions have been more efficient.
Bull and Bear both small or similar -> low-efficiency, range-bound environment.
Net therefore acts as a "trend coherence index" that measures whether price action is directionally organized or noisy.
Practical Use
Trend filter:
Apply trend-following systems only when Net is strongly positive or negative.
Avoid them when Net is near zero.
Regime change detection:
Crossings through zero often correspond to transitions between trending and ranging regimes.
Momentum loss detection:
If price makes new highs but Net or Bull weakens, it suggests trend exhaustion.
Settings Overview
Lookback: Number of historical bars considered as entry points (tau values).
Horizons: List of forward projection lengths (in bars) for measuring efficiency.
Recency Decay (lambda): Exponential weighting that emphasizes recent data.
Normalize by ATR: Adjusts "effort" to account for volatility changes.
Display Options: Toggle Bull, Bear, Net, or Signed Average (S). Customize line colors.
Notes
This indicator does not produce entry or exit signals.
It is a statistical tool that measures how efficiently price has trended over time.
High Net values indicate smooth, coherent trends.
Low or neutral Net values indicate noisy, directionless conditions.
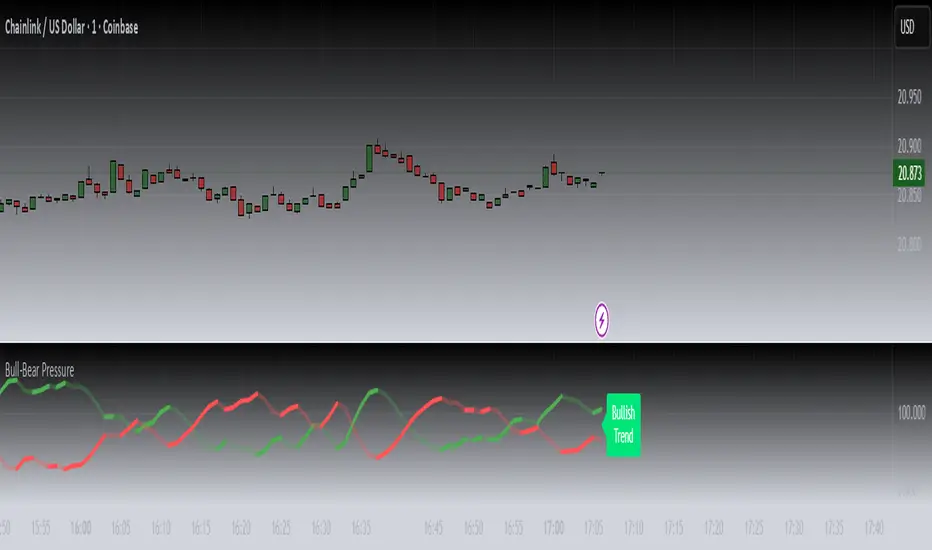
Bull-Bear PressureBULL-BEAR PRESSURE
Uniqueness
Bull-Bear Pressure measures the live tug-of-war between bullish and bearish momentum by transforming internal engine data into a visual gauge of market pressure.
How It Works
The indicator processes dual data feeds — one representing bullish pressure and the other bearish pressure. These values update in real time showing how pressure dynamics are currently distributed and highlighting areas where momentum dynamics may be adjusting.
Usefulness
By monitoring pressure dynamics, traders gain context on whether moves are supported by strong participation or fading momentum. It adds depth to directional bias especially when viewing multiple timeframe charts side by side.
How to Use It
Overlay Bull-Bear Pressure on your chart and compare shifts in bullish vs bearish strength. Use it underneath multi-timeframe or forecast-style indicators for added context.
Disclaimer
This indicator produces visual and informational outputs only. It does not generate trade signals, entry/exit rules, or backtestable strategies. The tool is intended purely as an educational resource to help users interpret market behavior. It does not constitute financial advice, and past performance does not guarantee future results. Trading involves risk, and you may lose some or all of your investment.
Release Notes:
v1.0 (Initial Release)
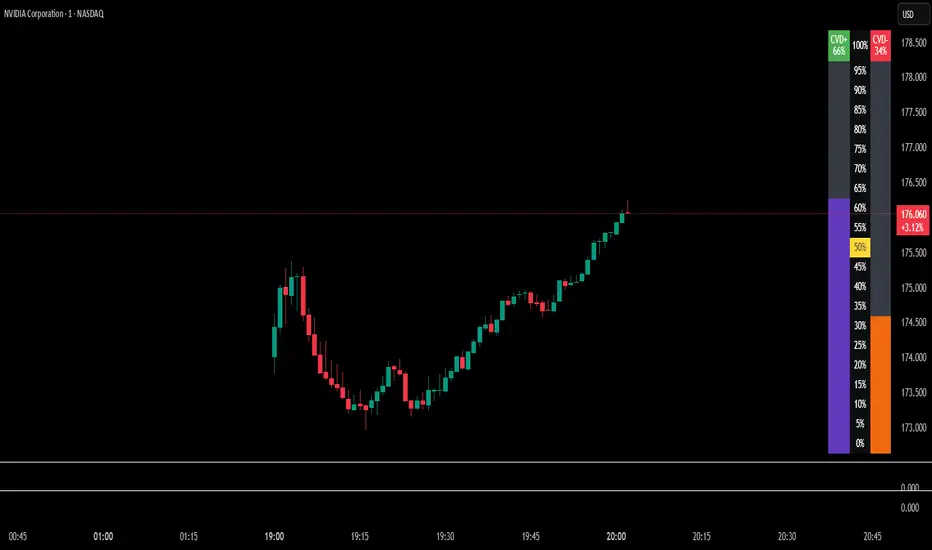
Bull/Bear Thermometer - GSK-VIZAG-AP-INDIABull/Bear Thermometer - GSK-VIZAG-AP-INDIA
Overview
The Bull/Bear Thermometer is a visual volume-based indicator designed to gauge the cumulative buying (bullish) and selling (bearish) pressure over customization time intervals on any chart. It uses Cumulative Volume Delta (CVD) to track buying and selling dominance and visually represents this data as vertical bar meters with percentage scales.
Key Features
Multi-Time frame Accumulation: Allows users to select accumulation intervals - Daily, Weekly, or Monthly - adapting to their trading style and time frame.
Cumulative Volume Delta (CVD) Computation: Calculates the net buying and selling volume by comparing volume on bullish and bearish bars to measure market strength.
Visual Thermometer Display: Presents buying (CVD+) and selling (CVD-) dominance in colorful vertical bars on an easy-to-read table overlay on the price chart.
Percentage Scale with Highlights: Includes a percentage scale from 0% to 100%, highlighting the important 50% benchmark with a yellow line for quick reference.
Clear Color Coding: Uses green and red color schemes to represent bullish and bearish pressure, with distinctive numeric labels.
Customization Reset Points: Weekly reset day and Monthly reset date options ensure the accumulation aligns with user preference or trading strategy cycles.
Inputs and Usage
Select Time frame: Choose how the buying/selling volume is accumulated — Daily, Weekly (reset day configurable), or Monthly (reset date configurable).
Volume-Based Signals: Monitor changes in buying and selling pressure levels as the market tides shift.
Table Display: A table positioned at the bottom right corner overlays the price chart showing percentage bars for both buying and selling dominance.
Ideal for: Day traders, swing traders, and volume-focused market analysts who want a quick visual summary of market sentiment.
How It Works
The indicator tracks volume on each bar, assigning positive or negative values depending on whether the bar closes higher or lower than the previous.
It accumulates these values over the selected time frame to calculate the cumulative buying (green) and selling (red) volumes.
The data is then converted to percentages and mapped as vertical colored bars in the table.
The midpoint (50%) is highlighted with a yellow line, helping traders quickly assess bullish/bearish balance.
Why Use This Indicator?
Simplicity: Easy to interpret visual thermometer of market sentiment.
Customization: Flexible period settings align with different trading styles.
Volume Insight: Goes beyond price action, factoring volume momentum for deeper market understanding.
Non-intrusive Overlay: Displayed neatly on chart without clutter or distraction.
Recommended Pairings
Use alongside price action or trend indicators.
Suitable for equities, futures, forex, and crypto instruments where volume data is reliable.
TRAPPER TRENDLINES — RSIBuilds dynamic RSI trendlines by connecting the two most recent confirmed RSI swing points (highs→highs for resistance, lows→lows for support). Includes optional channel shading for the 30–70 zone, an RSI moving average, clean break alerts, and simple bullish/bearish divergence alerts versus price.
How it works
RSI pivots: A point on RSI is a swing high/low only if it is the most extreme value compared with a set number of bars on the left and the right (the Pivot Lookback).
RSI trendlines:
Resistance connects the last two confirmed RSI swing highs.
Support connects the last two confirmed RSI swing lows.
Lines can be Full Extend (update into the future) or Pivot Only.
Channel block: Optional fill of the 30–70 range for fast visual context.
Alerts:
Breaks of RSI support/resistance trendlines.
Basic bullish/bearish RSI divergences versus price pivots.
Inputs
RSI
RSI Length: Default 14 (standard).
Pivot Lookback: Bars to the left/right required to confirm an RSI swing.
Overbought / Oversold: 70 / 30 by default.
Line Extension: Full Extend or Pivot Only.
Visuals
Show RSI Moving Average / Signal Length: Optional smoothing line on RSI.
RSI/Signal colors: Customize plot colors.
Show 30–70 Channel Block: Toggle the middle-zone fill.
Tint pane background when RSI in channel: Optional subtle background when RSI is between OB/OS.
Divergences & Alerts
Enable RSI TL Break Alerts: Alert conditions for RSI line breaks.
Enable Divergence Alerts: Bullish/Bearish divergence alerts versus price.
Pairing with price for confluence/divergence
For accurate confluence and clearer divergences, align this RSI tool with your price trendline tool (for example, TRAPPER TRENDLINES — PRICE):
Set RSI Pivot Lookback equal to the Pivot Left/Right size used on price.
Example: Price uses Pivot Left = 50 and Pivot Right = 50 → set RSI Pivot Lookback = 50.
Keep RSI Length = 14 and OB/OS = 70/30 unless you have a specific edge.
Interpretation:
Confluence: Price reacts at its trendline while RSI reacts at its own line in the same direction.
Divergence: Price makes a higher high while RSI makes a lower high (bearish), or price makes a lower low while RSI makes a higher low (bullish), using matched pivot windows.
Suggested settings
Higher timeframes (4H / 1D / 1W): Pivot Lookback = 50; optional RSI MA length 14; channel block ON.
Intraday (15m / 30m / 1H): Pivot Lookback = 30; optional RSI MA length 14.
Always mirror your price pivot size to this RSI Pivot Lookback for consistent swings.
Reading the signals
RSI trendline touch/hold: Momentum reacting at structure; look for confluence with price levels.
RSI Trendline Break Up / Down: Momentum shift; consider price structure and retests.
Bullish/Bearish Divergence: Confirm only when pivots are matched and the new swing is confirmed.
Notes & limitations
Pivots require future bars to confirm by design; trendlines update as new swings confirm.
Divergence logic compares RSI pivots to price pivots with the same lookback; mismatched windows can produce false positives.
No strategy entries/exits or performance claims are provided. This is an analytical tool.
Alerts (titles/messages)
RSI: Trendline Break Up — “RSI broke falling resistance line.”
RSI: Trendline Break Down — “RSI broke rising support line.”
RSI: Bullish Divergence — “Bullish RSI divergence confirmed.”
RSI: Bearish Divergence — “Bearish RSI divergence confirmed.”
Quick start
Add the indicator to a separate pane.
Set Pivot Lookback to match your price tool’s pivot size (e.g., 50).
Optionally toggle the RSI MA and Channel Block for clarity.
Enable alerts if you want notifications on RSI line breaks and divergences.
Use with TRAPPER TRENDLINES — PRICE or any price-based trendline tool for confluence/divergence analysis.
Compliance
This script is for educational purposes only and does not constitute financial advice. Trading involves risk. Past performance does not guarantee future results. No performance claims are made.

Greer Gap# Greer Gap Indicator (No mitigation: i.e. removing false signals)
## Summary
The **Greer Gap Indicator** identifies **Fair Value Gaps (FVGs)** and introduces specialized **Greer Bull Gaps (Blue)** and **Greer Bear Gaps (Orange)** to highlight high-probability trading opportunities. Unlike traditional FVG indicators, it avoids hindsight bias by not removing historical gaps based on future price action, ensuring transparency in signal accuracy. Built upon LuxAlgo’s FVG logic, it adds unique filtering: only the first Greer Gap after an opposite gap is plotted if its level (min for Bull, max for Bear) is not higher/lower than the previous Greer Gap of the same type, while all valid gaps are recorded for comparison. Traders can use these gaps as support/resistance or entry signals, customizable via timeframe, look back, and display options.
## Description
This indicator detects and displays **Fair Value Gaps (FVGs)** on the chart, with a focus on specialized **Greer Gaps**:
- **Bullish Gaps (Green)**: Areas where the low of the current candle is above the high of a previous candle (look back period), indicating potential upward momentum.
- **Bearish Gaps (Red)**: Areas where the high of the current candle is below the low of a previous candle, indicating potential downward momentum.
- **Greer Bull Gaps (Blue)**: A bullish gap that is above the latest bearish gap's max. Only the first such gap after a bearish gap is plotted if it meets criteria (not higher than the previous Greer Bull Gap's min), but all valid ones are recorded for comparison.
- **Greer Bear Gaps (Orange)**: A bearish gap that is below the latest bullish gap's min. Only the first such gap after a bullish gap is plotted if it meets criteria (not lower than the previous Greer Bear Gap's max), but all valid ones are recorded.
## How It Works
The script uses a dynamic look back period to detect FVGs. It maintains a record of all detected gaps and applies additional logic for Greer Gaps:
- **Greer Bull Gaps**: Checks if the new bullish gap's min is above the latest bearish gap's max. Plots only if it's the first since the last bearish gap and its min is <= previous Greer Bull min (or first one).
- **Greer Bear Gaps**: Checks if the new bearish gap's max is below the latest bullish gap's min. Plots only if it's the first since the last bullish gap and its max is >= previous Greer Bear max (or first one).
- **Resets**: A new bearish gap resets the Greer Bull Gap flag, and a new bullish gap resets the Greer Bear Gap flag.
## How to Use
- **Timeframe**: Set a higher timeframe (e.g., 'D' for daily) to detect gaps from that timeframe on the current chart.
- **Look back Period**: Adjust to change gap detection sensitivity (default: 34). Use 2 if you want to compare to LuxAlgo
- **Extend**: Controls how far right the gap boxes extend.
- **Show Options**: Toggle visibility of all bullish/bearish gaps or Greer Gaps.
- **Colors**: Customize colors for each gap type.
- **Application**: Use Greer Gaps as potential support/resistance levels or entry signals, but combine with other analysis for confirmation.
## Originality and Credits
This script is inspired by and builds upon the **"Fair Value Gap "** indicator by LuxAlgo (available on TradingView: ()).
**Credits**: Thanks to LuxAlgo for the core FVG detection logic.
**Significant Changes**:
- Added **Greer Bull and Bear Gap** logic for filtered, directional gaps with reset mechanisms.
- Introduced recording of all valid Greer Gaps without plotting all, to compare levels without hindsight bias.
- **No mitigation/removal of gaps**: Unlike LuxAlgo's approach, which mitigates (removes or alters) gaps based on future price action (e.g., when filled), this can create a hindsight bias where incorrect signals disappear over time. If a signal is used for a trade and later removed due to new data, it doesn't reflect real-time performance accurately. The Greer Gap avoids this by using gap comparisons to validate signals without altering historical boxes, ensuring transparency in when signals were right or wrong.

Trendline + Bull/Bear Flag + EMA 9/21 Buy-Sell Signalseasy scalping and buy sell signals on 9-21 ema cross and trendline breakout

WA-%Chg with BackgroundDescription
The WA-%Chg with Background indicator measures the percentage change in a selected price source over a user-defined period. It allows traders to visually and quickly assess bullish and bearish momentum through dynamic color coding and background shading.
Percentage Change Calculation – Uses ta.roc to determine the rate of change over the chosen length.
Customizable Alerts – Set upper (HiAlert) and lower (LoAlert) thresholds to get notified when momentum crosses bullish or bearish trigger levels.
Dynamic Line Coloring – Blue when above the bullish threshold, red when below the bearish threshold, and gray when in neutral territory.
Background Highlighting – Light blue shading for bullish zones, light red shading for bearish zones.
User Customization – Modify calculation length, colors, and alert thresholds to suit your trading style.
This tool is useful for identifying breakout conditions, momentum shifts, and potential reversals at a glance. Traders can combine it with other indicators for confirmation.
Disclaimer
This indicator is provided for educational purposes only and should not be considered financial advice. Past performance of any indicator or strategy is not indicative of future results. Trading in financial markets involves significant risk, including the risk of losing capital. Always perform your own analysis and consult with a qualified financial advisor before making any investment decisions. The author assumes no liability for any losses incurred from the use of this tool.

✨Smart Option MACD: Bullish, Bearish, Neutral Logic by AKM ✨The **Smart Option MACD: Bullish, Bearish, Neutral Logic by AKM** is an advanced indicator designed for TradingView, tailored for option traders on indices like NIFTY. It automates options trend scanning by applying MACD analysis to both Call (CE) and Put (PE) options near the ATM (At-The-Money) strike, providing actionable market states—Bullish, Bearish, or Neutral—using distinct logic for both strikes and overall market context.
***
### Core Features
- **Option Selection Logic:** The script dynamically calculates ATM, CE, and PE strike prices based on the underlying index spot price and customizable user inputs for expiry, strike distance, and OTM/ITM shift.
- **MACD on Option Prices:** For both CE and PE symbols, the indicator computes the MACD (Moving Average Convergence Divergence) and Signal lines. It uses standard MACD settings: 12-period EMA (fast), 26-period EMA (slow), and 9-period Signal.
- **Strike Status Classification:**
- AZL 🔼: Indicates MACD > 0 for that option, signifying positive momentum.
- BZL 🔽: Indicates MACD 0 & crossover up), PE is bearish (MACD<0 & crossover down).
- **Bearish:** PE is bullish & crossover up, CE is bearish & crossover down.
- **Neutral:** All other scenarios—including mixed or undefined signals.
***
### Table Output
A real-time table is displayed on the chart (top-right) with key option and market details:
- Spot price
- ATM Strike
- CE/PE strike status (momentum + crossover logic)
- Option prices
- Overall market state, color-coded for clarity
***
### How to Use This Indicator
- **Entry Signal:** Use the Bullish/Bearish status for directional trades or option strategies. Bullish calls for buying or selling upward momentum options; Bearish favors downside trades. Neutral advises caution or range-bound trades.
- **Customizability:** Expiry, strike width, OTM/ITM offset, and chart resolution are user-controlled, allowing adaptation to different market contexts.
- **Best Practice:** Use alongside price action, support/resistance zones and other indicators to confirm options momentum, as MACD is powerful yet not infallible.
***
### Who Is It For?
- **Option traders** who want to automate trend/momentum detection for CE/PE strikes instead of manual chart switching.
- **Index traders** (NIFTY, BANKNIFTY...) seeking systematic edge in intraday/positional strategies tied to option momentum.
- **Technical analysts** interested in visual, rule-based signals combining options data and classic MACD logic.
***
The Smart Option MACD indicator streamlines multi-strike, multi-option momentum analysis and presents clear actionable logic directly on your chart for enhanced decision-making. Use it as a core part of your TradingView toolkit for options-focused market views.

FVG-Bully BearsFVG-Bully Bears Indicator
The FVG-Bully Bears indicator is a powerful tool designed to identify Fair Value Gaps (FVGs) on your TradingView charts. FVGs are price gaps that occur when the market moves sharply, leaving areas where little to no trading activity took place. These gaps often act as key support or resistance zones, making them valuable for traders looking to spot potential reversal or continuation points.
This indicator highlights Bullish FVGs (potential support zones) and Bearish FVGs (potential resistance zones) with customizable boxes and labels, helping you visualize these critical price levels with ease.
Features
Bullish and Bearish FVGs: Detects gaps where price has left untested areas, marking bullish (green) and bearish (red) FVGs.
Customizable Display: Choose to show or hide bullish/bearish FVGs, adjust colors, and control box visibility.
FVG Labels: Optional labels on each FVG box to clearly identify bullish or bearish gaps, with adjustable text size.
Delete Filled FVGs: Automatically removes FVGs once price revisits and fills the gap, keeping your chart clean.
Box Extension: Extend FVG boxes into the future (up to 100 bars) to track unfilled gaps over time.
Performance Optimization: Limits the number of displayed FVG boxes (default: 50) to ensure smooth chart performance.
How It Works
Bullish FVG: Identified when the high of a candle two bars ago is lower than the low of the current candle, indicating a sharp upward move.
Bearish FVG: Identified when the low of a candle two bars ago is higher than the high of the current candle, indicating a sharp downward move.
FVGs are drawn as colored boxes (green for bullish, red for bearish) and can include labels for easy identification.
If enabled, filled FVGs (where price revisits the gap) are deleted to reduce chart clutter.
Settings
FVG Settings
Show Bullish FVGs: Enable/disable bullish FVG boxes (default: enabled).
Show Bearish FVGs: Enable/disable bearish FVG boxes (default: enabled).
Bullish FVG Color: Customize the color and transparency of bullish FVG boxes (default: light green).
Bearish FVG Color: Customize the color and transparency of bearish FVG boxes (default: light red).
Max FVG Boxes: Set the maximum number of FVG boxes displayed (default: 50, range: 1–500).
Extend FVG Boxes (Bars): Extend FVG boxes into the future by a specified number of bars (default: 8, range: 0–100).
Show FVG Labels: Enable/disable text labels on FVG boxes (default: enabled).
Label Size: Choose the size of FVG labels (options: Tiny, Small, Normal, Large, Huge; default: Small).
Delete Filled FVGs: Automatically remove FVGs when price fills the gap (default: enabled).
How to Use
Add the FVG-Bully Bears indicator to your TradingView chart.
Customize the settings to match your trading style (e.g., adjust colors, toggle labels, or change box extensions).
Watch for green (bullish) and red (bearish) FVG boxes:
Bullish FVGs: Potential support zones where price may bounce or consolidate.
Bearish FVGs: Potential resistance zones where price may reverse or stall.
Use FVGs in combination with other indicators (e.g., support/resistance, trendlines) for better trade decisions.
If “Delete Filled FVGs” is enabled, filled gaps will disappear, keeping your chart focused on active FVGs.
Ideal For
Swing Traders: Identify key price zones for entries or exits.
Day Traders: Spot intraday support/resistance levels created by rapid price moves.
Price Action Traders: Use FVGs to confirm market structure and potential reversal points.
Notes
For best performance, keep “Max FVG Boxes” at a reasonable value (e.g., 50) to avoid chart lag.
FVGs are most effective on lower timeframes (e.g., 5m, 15m, 1H) but can be used on any timeframe.
Combine with other tools like volume or trend indicators for a complete trading strategy.
Enjoy trading with FVG-Bully Bears and take advantage of Fair Valu

GCM Bull Bear RiderGCM Bull Bear Rider (GCM BBR)
Your Ultimate Trend-Riding Companion
GCM Bull Bear Rider is a comprehensive, all-in-one trend analysis tool designed to eliminate guesswork and provide a crystal-clear view of market direction. By leveraging a highly responsive Jurik Moving Average (JMA), this indicator not only identifies bullish and bearish trends with precision but also tracks their performance in real-time, helping you ride the waves of momentum from start to finish.
Whether you are a scalper, day trader, or swing trader, the GCM BBR adapts to your style, offering a clean, intuitive, and powerful visual guide to the market's pulse.
Key Features
JMA-Powered Trend Lines (UTPL & DTPL): The core of the indicator. A green "Up Trend Period Line" (UTPL) appears when the JMA's slope turns positive (buyers are in control), and a red "Down Trend Period Line" (DTPL) appears when the slope turns negative (sellers are in control). The JMA is used for its low lag and superior smoothing, giving you timely and reliable trend signals.
Live Profit Tracking Labels: This is the standout feature. As soon as a trend period begins, a label appears showing the real-time profit (P:) from the trend's starting price. This label moves with the trend, giving you instant feedback on its performance and helping you make informed trade management decisions.
Historical Performance Analysis: The profit labels remain on the chart for completed trends, allowing you to instantly review past performance. See at a glance which trends were profitable and which were not, aiding in strategy refinement and backtesting.
Automatic Chart Decluttering: To keep your chart clean and focused on significant moves, the indicator automatically removes the historical profit label for any trend that fails to achieve a minimum profit threshold (default is 0.5 points).
Dual-Ribbon Momentum System:
JMA / Short EMA Ribbon: Visualizes short-term momentum. A green fill indicates immediate bullish strength, while a red fill shows bearish pressure.
Short EMA / Long EMA Ribbon: Acts as a long-term trend filter, providing broader market context for your decisions.
"GCM Hunt" Entry Signals: The indicator includes optional pullback entry signals (green and red triangles). These appear when the price pulls back to a key moving average and then recovers in the direction of the primary trend, offering high-probability entry opportunities.
How to Use
Identify the Trend: Look for the appearance of a solid green line (UTPL) for a bullish bias or a solid red line (DTPL) for a bearish bias. Use the wider EMA ribbon for macro trend confirmation.
Time Your Entry: For aggressive entries, you can enter as soon as a new trend line appears. For more conservative entries, wait for a "GCM Hunt" triangle signal, which confirms a successful pullback.
Ride the Trend & Manage Your Trade: The moving profit label (P:) is your guide. As long as the trend line continues and the profit is increasing, you can confidently stay in the trade. A flattening JMA or a decreasing profit value can signal that the trend is losing steam.
Focus Your Strategy: Use the Display Mode setting to switch between "Buyers Only," "Sellers Only," or both. This allows you to completely hide opposing signals and focus solely on long or short opportunities.
Core Settings
Display Mode: The master switch. Choose to see visuals for "Buyers & Sellers," "Buyers Only," or "Sellers Only."
JMA Settings (Length, Phase): Fine-tune the responsiveness of the core JMA engine.
EMA Settings (Long, Short): Adjust the lengths of the moving averages that define the ribbons and "Hunt" signals.
Label Offset (ATR Multiplier): Customize the gap between the trend lines and the profit labels to avoid overlap with candles.
Filters (EMA, RSI, ATR, Strong Candle): Enable or disable various confirmation filters to strengthen the "Hunt" entry signals according to your risk tolerance.
Add the GCM Bull Bear Rider to your chart today and transform the way you see and trade the trend!
ENJOY

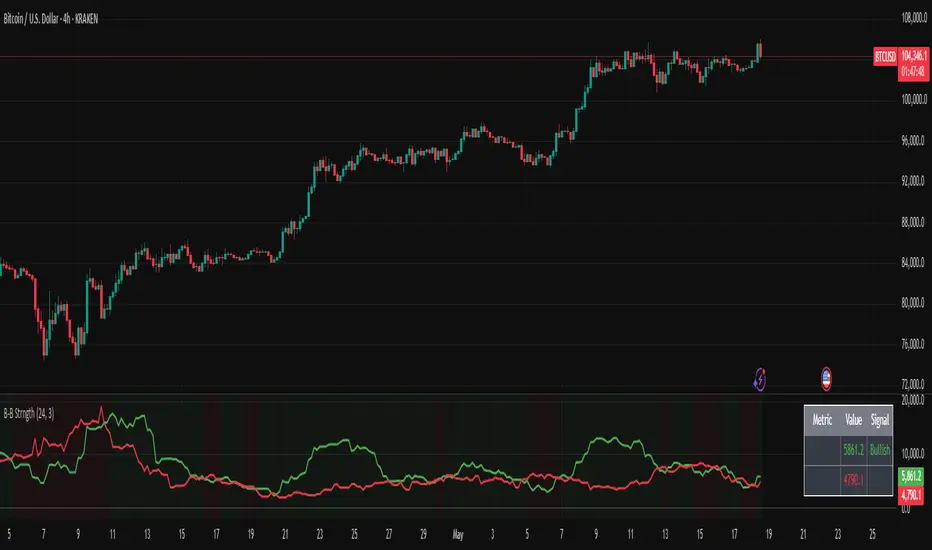
Bullish/Bearish Body StrengthThis indicator analyzes candlestick body sizes to measure bullish versus bearish strength over a specified period. Here's what it does:
Features:
- Measures and totals the body sizes of bullish and bearish candles over your chosen lookback period
- Shows the total bullish and bearish body measurements as separate plots
- Calculates and displays a bull/bear ratio (bullish total divided by bearish total)
- Shows the difference between bullish and bearish totals
- Colors the background based on bullish (green) or bearish (red) dominance
- Includes an information table with current values and signals
Customization Options:
- Lookback Period: Set how many bars to analyze (default: 14)
- Normalize by ATR: Option to normalize body sizes by the Average True Range for more consistent measurement across different volatility periods
- Smoothing Period: Apply smoothing to the ratio and difference values
- Display Options: Toggle for showing the bull/bear ratio and bull-bear difference
How to Use:
1. Add the indicator to your chart in TradingView
2. Adjust the lookback period to fit your trading timeframe
3. Watch for:
- When bullish bodies significantly outweigh bearish ones (green dominance)
- When bearish bodies significantly outweigh bullish ones (red dominance)
- Ratio values above 2 (strong bullish signal) or below 0.5 (strong bearish signal)
The indicator provides both visual cues and numerical data to help identify periods of bullish or bearish momentum based on actual price movement rather than just candle count.
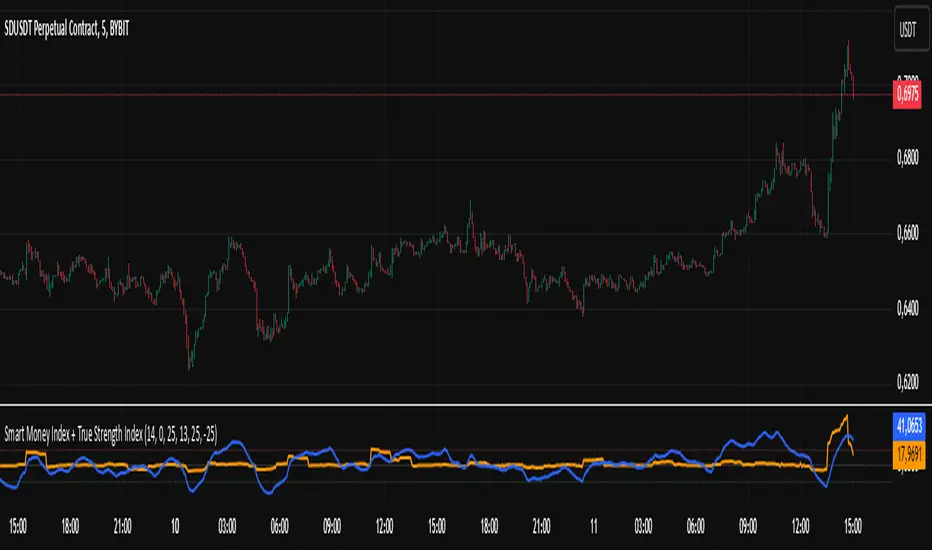
Smart Money Index + True Strength IndexThe Smart Money Index + True Strength Index indicator is a combination of two popular technical analysis indicators: the Smart Money Index (SMI) and the True Strength Index (TSI). This combined indicator helps traders identify potential entry points for long and short positions based on signals from both indexes.
Main Components:
Smart Money Index (SMI):
The SMI measures the difference between the closing and opening price of a candle multiplied by the trading volume over a certain period of time. This allows you to assess the activity of large players ("smart money") in the market. If the SMI value is above a certain threshold (smiThreshold), it may indicate a bullish trend, and if lower, it may indicate a bearish trend.
True Strength Index (TSI):
The TSI is an oscillator that measures the strength of a trend by comparing the price change of the current bar with the previous bar. It uses two exponential moving averages (EMAS) to smooth the data. TSI values can fluctuate around zero, with values above the overbought level indicating a possible downward correction, and values below the oversold level signaling a possible upward correction.
Parameters:
SMI Length: Defines the number of candles used to calculate the average SMI value. The default value is 14.
SMI Threshold: A threshold value that is used to determine a buy or sell signal. The default value is 0.
Length of the first TSI smoothing (tsiLength1): The length of the first EMA for calculating TSI. The default value is 25.
Second TSI smoothing length (tsiLength2): The length of the second EMA for additional smoothing of TSI values. The default value is 13.
TSI Overbought level: The level at which the market is considered to be overbought. The default value is 25.
Oversold level TSI: The level at which it is considered that the market is in an oversold state. The default value is -25.
Logic of operation:
SMI calculation:
First, the difference between the closing and opening price of each candle (close - open) is calculated.
This difference is then multiplied by the trading volume.
The resulting product is averaged using a simple moving average (SMA) over a specified period (smiLength).
Calculation of TSI:
The price change relative to the previous bar is calculated (close - close ).
The first EMA with the length tsiLength1 is applied.
Next, a second EMA with a length of tsiLength2 is applied to obtain the final TSI value.
The absolute value of price changes is calculated in the same way, and two emas are also applied.
The final TSI index is calculated as the ratio of these two values multiplied by 100.
Graphical representation:
The SMI and TSI lines are plotted on the graph along with their respective thresholds.
For SMI, the line is drawn in orange, and the threshold level is dotted in gray.
For the TSI, the line is plotted in blue, the overbought and oversold levels are indicated by red and green dotted lines, respectively.
Conditions for buy/sell signals:
A buy (long) signal is generated when:
SMI is greater than the threshold (smi > smiThreshold)
TSI crosses the oversold level from bottom to top (ta.crossover(tsi, oversold)).
A sell (short) signal is generated when:
SMI is less than the threshold (smi < smiThreshold)
TSI crosses the overbought level from top to bottom (ta.crossunder(tsi, overbought)).
Signal display:
When the conditions for a long or short are met, labels labeled "LONG" or "SHORT" appear on the chart.
The label for the long is located under the candle and is colored green, and for the short it is above the candle and is colored red.
Notification generation:
The indicator also supports notifications via the TradingView platform. Notifications are sent when conditions arise for a long or short position.
This combined indicator provides the trader with the opportunity to use both SMI and TSI signals simultaneously, which can improve the accuracy of trading decisions.
Johnny's Volatility-Driven Trend Identifier w/ Reversal SignalsJohnny's Volatility-Driven Trend Identifier w/ Reversal Signals is designed to identify high-probability trend shifts and reversals by incorporating volatility, momentum, and impulse-based filtering. It is specifically built for traders who want to capture strong trend movements while minimizing false signals caused by low volatility noise.
By leveraging Rate of Change (ROC), Relative Strength Index (RSI), and Average True Range (ATR)-based volatility detection, the indicator dynamically adapts to market conditions. It highlights breakout trends, reversals, and early signs of momentum shifts using strategically placed labels and color-coded trend visualization.
Inspiration taken from Top G indicator .
What This Indicator Does
The Volatility-Driven Trend Identifier works by:
Measuring Market Extremes & Momentum:
Uses ROC normalization with standard deviation to identify impulse moves in price action.
Implements RSI filtering to determine overbought/oversold conditions that validate trend strength.
Utilizes ATR-based volatility tracking to ensure signals only appear when meaningful market movements are occurring.
Identifying Key Trend Events:
Power Peak (🔥): Marks a confirmed strong downtrend, ideal for shorting opportunities.
Surge (🚀): Indicates a confirmed strong uptrend, signaling a potential long entry.
Soft Surge (↗): Highlights a mild bullish reentry or early uptrend formation.
Soft Peak (↘): Shows a mild bearish reentry or early downtrend formation.
Providing Adaptive Filtering for Reliable Signals:
Filters out weak trends with a volatility check, ensuring signals appear only in strong market conditions.
Implements multi-level confirmation by combining trend strength metrics, preventing false breakouts.
Uses gradient-based visualization to color-code market sentiment for quick interpretation.
What This Indicator Signals
Breakouts & Impulse Moves: 🚀🔥
The Surge (🚀) and Power Peak (🔥) labels indicate confirmed momentum breakouts, where the trend has been validated by a combination of ROC impulse, RSI confirmation, and ATR volatility filtering.
These signals suggest that the market is entering a strong trend, and traders can align their entries accordingly.
Early Trend Formation & Reentries: ↗ ↘
The Soft Surge (↗) and Soft Peak (↘) labels indicate areas where a trend might be forming, but is not yet fully confirmed.
These signals help traders anticipate potential entries before the trend gains full strength.
Volatility-Adaptive Trend Filtering: 📊
Since the indicator only activates in volatile conditions, it avoids the pitfalls of low-range choppy markets where false signals frequently occur.
ATR-driven adaptive windowing allows the indicator to dynamically adjust its sensitivity based on real-time volatility conditions.
How to Use This Indicator
1. Identifying High-Probability Entries
Bullish Entries (Long Trades)
Look for 🚀 Surge signals in an uptrend.
Confirm with RSI (should be above 50 for momentum).
Ensure volatility is increasing to validate the breakout.
Use ↗ Soft Surge signals for early entries before the trend fully confirms.
Bearish Entries (Short Trades)
Look for 🔥 Power Peak signals in a downtrend.
RSI should be below 50, indicating downward momentum.
Volatility should be rising, ensuring market momentum is strong.
Use ↘ Soft Peak signals for early entries before a full bearish confirmation.
2. Avoiding False Signals
Ignore signals when the market is ranging (low ATR).
Check RSI and ROC alignment to ensure trend confirmation.
Use additional confluences (e.g., price action, support/resistance levels, moving averages) for enhanced accuracy.
3. Trend Confirmation & Filtering
The stronger the trend, the higher the likelihood that Surge (🚀) and Power Peak (🔥) signals will continue in their direction.
Soft Surge (↗) and Soft Peak (↘) act as early warning signals before major breakouts occur.
What Makes This a Machine Learning-Inspired Moving Average?
While this indicator is not a direct implementation of machine learning (as Pine Script lacks AI/ML capabilities), it mimics machine learning principles by adapting dynamically to market conditions using the following techniques:
Adaptive Trend Selection:
It does not rely on fixed moving averages but instead adapts dynamically based on volatility expansion and momentum detection.
ATR-based filtering adjusts the indicator’s sensitivity to real-time conditions.
Multi-Factor Confirmation (Feature Engineering Equivalent in ML):
Combines ROC, RSI, and ATR in a structured way, similar to how ML models use multiple inputs to filter and classify data.
Implements conditional trend recognition, ensuring that only valid signals pass through the filter.
Noise Reduction with Data Smoothing:
The algorithm avoids false signals by incorporating trend intensity thresholds, much like how ML models remove outliers to refine predictions.
Adaptive filtering ensures that low-volatility environments do not produce misleading signals.
Why Use This Indicator?
✔ Reduces False Signals: Multi-factor validation ensures only high-confidence signals are triggered.
✔ Works in All Market Conditions: Volatility-adaptive nature allows the indicator to perform well in both trending and ranging markets.
✔ Great for Swing & Intraday Trading: It helps spot momentum shifts early and allows traders to catch major market moves before they fully develop.
✔ Visually Intuitive: Color-coded trends and clear signal markers make it easy to interpret.

Bull Bear Candles with Volume ProfileUser Guide for Bull Bear Candles Indicator with Keltner Channels
Author: NellyN
Introduction
This indicator helps identify potential bullish and bearish trends in the market by analyzing buying and selling volume over two configurable timeframes. It calculates the percentage of buying and selling volume and displays the current market condition based on two moving averages for 2 periods.
Key Features
• Volume Analysis : Calculates Buy and Sell Volume for two configurable timeframes (e.g., 5 min, 15 min, 15 min. and 1 hour, etc.) and displays them as percentages.
• Moving Averages : Uses one Moving Average (MA) for two different time periods to identify trends (uptrend when shorter-term MA is above longer-term MA). You can also choose other Moving Average types like SMA, EMA, WMA, RMA, VWMA, or HMA.
• Colored Candles : Candles are colored green for bullish conditions, red for bearish conditions, and gray for neutral conditions.
• Market Condition Labels : Displays labels in table-view indicating the current market condition based on Buy and Sell Volume (Very Bullish, Very Bearish, Bullish/Bearish Retracement, Chop).
• Alerts: Generates alerts for potential buy and sell signals based on indicator conditions (Note: Enable alerts in the indicator settings).
• Visual Signals: Provides visual signals through colored candles and market condition labels in addition to alerts.
Input Parameters
• Source: Close price (default) or Heikin Ashi
• Timeframe: Select the timeframe for price and volume data used in the indicator (e.g., Daily, Hourly).
• Colored Candles On: Enable (True) or disable (False) coloring candles based on market conditions.
• Enable Alerts: Enable (True) or disable (False) alerts for buy/sell signals.
• Length of MA: Sets the length for the MAs used in trend identification (minimum 1).
• Lookback Period Vol. 1 & 2: Define the timeframes used to calculate buying and selling volume and the MA calculation (e.g., 5 min, 15 min).
Understanding the Outputs
• Cloud Fill: The area between two MAs is filled with a color that reflects the trend (green for uptrend, red for downtrend).
• Table: Shows Buy Volume, Sell Volume, Buy Percentage, Sell Percentage, and the current Market Condition Labels. (If you decide to see them uncomment them from the code simply removing the // in front of the code)
• Colored Candles and Market Condition Labels: Look for green candles and bullish labels for potential buying opportunities, and vice versa for red candles and bearish labels.
Bullish green label appears when short-term MA is above long-term MA AND Buy Volume percentage is greater than 50%.
Red cross for exiting long entry appears when we have bearish volume OR bearish crossover of the MA for the 2 periods.
Bearish red label appears when short-term MA is below long-term MA AND Buy Volume percentage is less than 50%.
Green cross for exiting short entry appears when we have bullish volume OR bullish crossover of the MA for the 2 periods.
• Bullish/Bearish Retracement: The moving averages indicate a potential trend reversal, while the Buy Volume percentage suggests a continuation of the prior trend. The candle color may be green, red, or gray depending on the current price position relative to the moving averages.
• Chop (Gray Candle): The moving averages are flat and the Buy Volume percentage is not significantly above or below 50%.
• Buy/Sell Alerts: The indicator generates alerts based on specific conditions, but these should be used in conjunction with other trading strategies and careful risk management.
Important Notes
• This indicator is for informational purposes only and should not be considered financial advice. Back-test the indicator with historical data to understand its performance before using it for live trading.
• Combine this indicator with other technical analysis tools.

3 Confirmation BearThe "3 Confirmation Bear" indicator is designed to help traders identify strong bearish market conditions with three key confirmations:
Price Below EMA15:
The price trading below the 15-period Exponential Moving Average (EMA) signals bearish momentum.
RSI Below a Threshold:
The Relative Strength Index (RSI) is below a user-defined threshold (default: 50), confirming a lack of bullish strength and momentum favoring the downside.
Downtrend Confirmation:
The indicator ensures the market is in a downtrend by checking for lower highs and lower lows over a specified lookback period.
Key Features:
Bearish Signals: Displays a red downward-pointing label above the price bar when all three conditions are met, making bearish setups easy to identify.
Customizable Inputs: Traders can adjust the EMA length, RSI threshold, and downtrend lookback period to suit their specific strategies.
Versatile Application: Ideal for short entries, trend validation, or avoiding long trades during bearish conditions.
How to Use:
Use the "3 Confirmation Bear" indicator to:
Confirm Short Trades: Enter bearish trades when the signal aligns with your strategy.
Validate Trends: Ensure a clear downtrend is present before committing to a position.
Filter Trades: Avoid long positions during bearish momentum.
This indicator simplifies decision-making by focusing on high-probability bearish setups. Perfect for day traders, swing traders, and those seeking clear confirmation before entering a trade.

Rikki's DikFat Bull/Bear OscillatorRikki's DikFat Bull/Bear Oscillator - Trend Identification & Candle Colorization
Rikki's DikFat Bull/Bear Oscillator is a powerful visual tool designed to help traders easily identify bullish and bearish trends on the chart. By analyzing market momentum using specific elements of the Commodity Channel Index (CCI) , this indicator highlights key trend reversals and continuations with color-coded candles, allowing you to quickly spot areas of opportunity.
How It Works
At the heart of this indicator is the Commodity Channel Index (CCI) , a popular momentum-based oscillator. The CCI measures the deviation of price from its average over a specified period (default is 30 bars). This helps identify whether the market is overbought, oversold, or trending.
Here's how the indicator interprets the CCI:
Bullish Trend (Green Candles) : When the market is showing signs of continued upward momentum, the candles turn green. This happens when the current CCI is less than 200 and moves from a value greater than 100 with velocity, signaling that the upward trend is still strong, and the market is likely to continue rising. Green candles indicate bullish price action , suggesting it might be a good time to look for buying opportunities or hold your current long position.
Bearish Trend (Red Candles) : Conversely, when the CCI shows signs of downward momentum (both the current and previous CCI readings are negative), the candles turn red. This signals that the market is likely in a bearish trend , with downward price action expected to continue. Red candles are a visual cue to consider selling opportunities or to stay out of the market if you're risk-averse.
How to Use It
Bullish Market : When you see green candles, the market is in a bullish phase. This suggests that prices are moving upward, and you may want to focus on buying signals . Green candles are your visual confirmation of a strong upward trend.
Bearish Market : When red candles appear, the market is in a bearish phase. This indicates that prices are moving downward, and you may want to consider selling or staying out of long positions. Red candles signal that downward pressure is likely to continue.
Why It Works
This indicator uses momentum to identify shifts in trend. By tracking the movement of the CCI , the oscillator detects whether the market is trending strongly or simply moving in a sideways range. The color changes in the candles help you quickly visualize where the market momentum is headed, giving you an edge in determining potential buy or sell opportunities.
Clear Visual Signals : The green and red candles make it easy to follow market trends, even for beginners.
Identifying Trend Continuations : The oscillator helps spot ongoing trends, whether bullish or bearish, so you can align your trades with the prevailing market direction.
Quick Decision-Making : By using color-coded candles, you can instantly know whether to consider entering a long (buy) or short (sell) position without needing to dive into complex indicators.
NOTES This indicator draws and colors it's own candles bodies, wicks and borders. In order to have the completed visualization of red and green trends, you may need to adjust your TradingView chart settings to turn off or otherwise modify chart candles.
Conclusion
With Rikki's DikFat Bull/Bear Oscillator , you have an intuitive and easy-to-read tool that helps identify bullish and bearish trends based on proven momentum indicators. Whether you’re a novice or an experienced trader, this oscillator allows you to stay in tune with the market’s direction and make more informed, confident trading decisions.
Make sure to use this indicator in conjunction with your own trading strategy and risk management plan to maximize your trading potential and limit your risks.

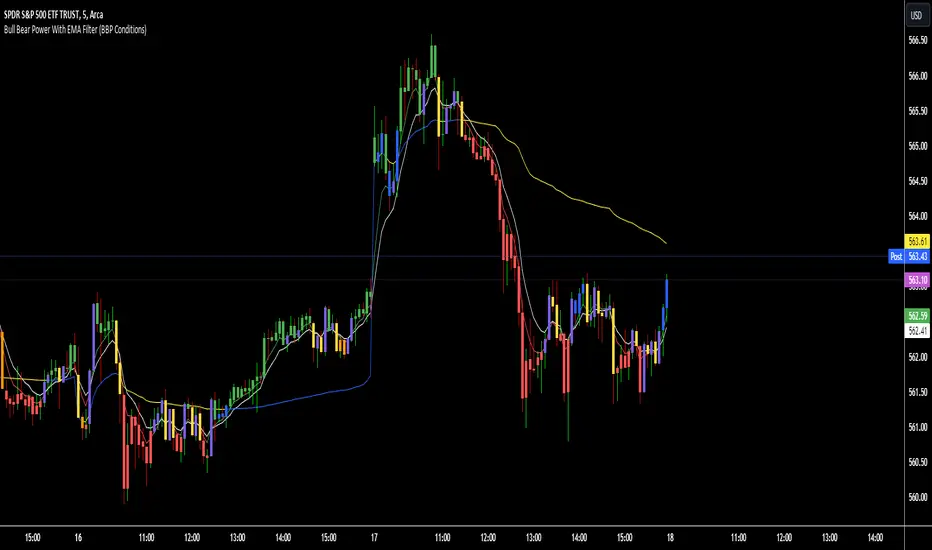
Bull Bear Power With EMA FilterDescription of Indicator:
This Pine Script indicator colors price bars based on the open price in relation to custom moving averages (EMA/SMA), Bull/Bear Power (BBPower), and an optional VWAP filter. The bar colors help identify bullish and bearish conditions with added visual cues for price positioning relative to VWAP.
Key Features:
Customizable Moving Averages (EMA/SMA):
The user can select between EMA or SMA for both short-term and long-term moving averages.
Default moving averages are set to 5 (short-term) and 9 (long-term) but can be adjusted by the user.
Bullish Condition (Blue or Purple Bars):
A bar is colored blue if the following conditions are met:
The open price is above both the short-term and long-term moving averages.
The short-term moving average (MA 1) is above the long-term moving average (MA 2).
BBPower (open price minus the 13-period EMA) is positive, indicating bullish strength.
If the VWAP filter is enabled and the price opens below VWAP, the bullish bars will turn purple.
Bearish Condition (Yellow or Orange Bars):
A bar is colored yellow if the following conditions are met:
The open price is below both the short-term and long-term moving averages.
The short-term moving average (MA 1) is below the long-term moving average (MA 2).
BBPower is negative or zero, indicating bearish market conditions.
If the VWAP filter is enabled and the price opens above VWAP, the bearish bars will turn orange.
VWAP Filter (Optional):
An optional filter allows the user to add VWAP (Volume-Weighted Average Price) to the bar coloring logic.
When the VWAP filter is enabled, it provides additional information about price positioning relative to VWAP, turning bullish bars purple and bearish bars orange depending on whether the price opens above or below VWAP.
Usage:
Bullish Trend: Look for blue or purple bars to identify potential bullish momentum.
Bearish Trend: Look for yellow or orange bars to spot bearish conditions in the market.
The indicator allows users to customize the length and type of moving averages (EMA or SMA), as well as decide whether to apply the VWAP filter.
This indicator provides traders with clear visual signals to quickly assess the strength of bullish or bearish conditions based on the price's position relative to custom moving averages, BBPower, and VWAP, helping with trend identification and potential trade setups.
Bulls And Bears [CHE]This Pine Script™ indicator, Bulls And Bears , aims to provide traders with potential entry points by analyzing market conditions. Here's how it works:
Calculation of Maximum and Minimum Values: The script calculates the highest and lowest values based on the high, open, close, and low prices of the asset.
Relative Strength Index (RSI) Condition: It evaluates whether the RSI value (with a period of 14) is above 50, indicating bullish momentum.
Bullish and Bearish Conditions: Based on the calculated maximum and minimum values, along with the RSI condition, it determines bullish and bearish conditions. If the current maximum value is higher than the previous maximum and the RSI condition is met, it suggests a bullish condition. Conversely, if the current maximum value is lower than the previous maximum and the RSI condition is not met, it suggests a bearish condition.
Super Smoother Function: This function is used to calculate a smoother moving average, reducing noise in the data.
Input Parameters: Traders can adjust the "Length Difference" and "Length threshold" parameters to customize the indicator according to their trading preferences.
Calculation of Super Smooth Moving Averages: The script calculates super smooth moving averages for both bullish and bearish conditions.
Plotting: It plots the super smooth moving averages on the chart, indicating potential entry points for bullish (green) and bearish (red) conditions.
Filling Areas: It fills the areas between the moving averages and the threshold line based on the conditions. Green filling represents bullish conditions, while red filling represents bearish conditions.
By using this indicator, traders can potentially identify favorable entry points based on market conditions, helping them make informed trading decisions.

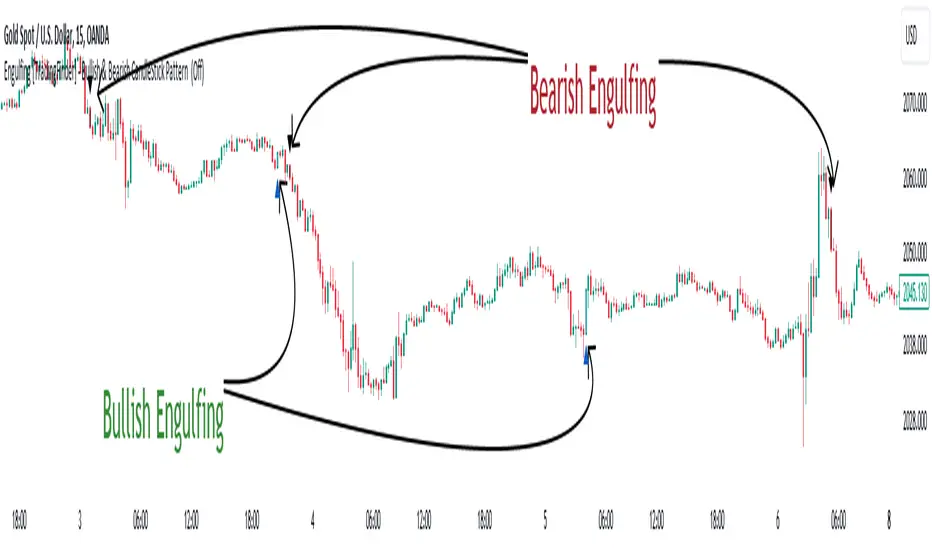
Engulfing [TradingFinder] Bullish & Bearish CandleStick Pattern🔵 Introduction
The candlestick engulfing pattern is important pattern in technical analysis that can be observed in candlestick charts. This pattern occurs when a complete candle engulfs or "engulfs" the body of a previous candle, meaning that the body of the new candle completely covers the body of the previous candle.
The candlestick engulfing pattern has two types: the bullish engulfing pattern and the bearish engulfing pattern.
• Bullish Engulfing Pattern: This pattern occurs when a market candle opens with a larger and higher body than the previous market candle and completely covers the body of the previous candle. This pattern may indicate the presence of strong buying pressure and a potential change in price direction upwards.
• Bearish Engulfing Pattern: This pattern occurs when a market candle opens with a larger and lower body than the previous market candle and completely covers the body of the previous candle. This pattern may indicate the presence of strong selling pressure and a potential change in price direction downwards.
The candlestick engulfing pattern is usually used as a valid signal for a change in price direction in the market and can enhance a combination of crossover investments and technical analysis. However, it should always be evaluated alongside other indicators and market factors, and counter decisions should be made accordingly.
🔵 Recognition Method
Correct, the candlestick engulfing pattern is one of the important patterns in technical analysis that is typically used as a strong signal for a valid change in price direction in the market. This pattern occurs when a candle (usually in the market) opens with a larger and higher (for bullish engulfing pattern) or lower (for bearish engulfing pattern) body than a previous market candle and completely covers the body of the previous candle.
Example of Bullish Engulfing Pattern:
• First Candle: A bearish (downward) candle with a small red body.
• Second Candle: A bullish (upward) candle with a larger body that completely covers the body of the previous candle.
This pattern may indicate a change in price direction from downward to upward.
Example of Bearish Engulfing Pattern:
• First Candle: A bullish (upward) candle with a small green body.
• Second Candle: A bearish (downward) candle with a larger body that completely covers the body of the previous candle.
This pattern may indicate a change in price direction from upward to downward.
The most important point is that the candlestick engulfing pattern should be carefully considered and always evaluated alongside other market indicators and overall conditions. For example, the engulfing pattern near important support or resistance levels, during significant market command changes, or accompanied by other technical signals can have greater signaling power.
🟣 "Bullish Engulfing" Candle
• The first candle is bullish and the second candle is bearish.
• At the end of a downtrend.
• The closing of the first candle is above the opening of the second candle.
• The high of the first candle is higher than the high of the second candle.
Optimal Condition:
• The closing of the first candle is higher than the high of the second candle.
• More than 80% of the first candle is bullish.
🟣 "Bearish Engulfing" Candle
• The first candle is bearish and the second candle is bullish.
• At the end of an uptrend.
• The closing of the first candle is below the opening of the second candle.
• The low of the first candle is lower than the low of the second candle.
Optimal Condition:
• The closing of the first candle is below the opening of the second candle.
• More than 80% of the first candle is bearish.
🔵 Settings
The "Engulf Filter" option allows the "Optimal Condition" to be executed and will show fewer candlesticks.
🔵 Status
Off: Default mode, showing more identifications.
• Green color indicates optimal "Bullish Engulfing" candles.
• Red color indicates optimal "Bearish Engulfing" candles.
On: By changing the default to "On," the number of identifications decreases and the optimal condition is applied.
• Blue color indicates "Bullish Engulfing" candles.
• Black color indicates "Bearish Engulfing" candles.
🟣 Important Note
"Engulfing" candles are very useful signals in the direction of the overall trend, but we do not expect a suitable movement from "Engulfing" candles against the trend.
Bulls VS Bears Momentum IndicatorBulls VS Bears Momentum Indicator
Description:
The Bulls VS Bears Momentum Indicator is a unique TradingView script designed to help traders identify potential momentum shifts in the market. This proprietary indicator uses a fixed Average True Range and a multiplier of to calculate dynamic stop levels that signal bullish or bearish momentum.
Here’s how it operates:
1. Average True Range-Based Stops: The script establishes long and short stop levels based on the half-way point of the high and low (hl2) of the current bar, adjusted by the Average True Range value. The long stop is set below hl2, while the short stop is set above. These levels adapt to market volatility, using the Average True Range to scale the distance from hl2, ensuring that the stops react sensitively to changes in price movement.
2. Directional Assessment: A directional value (dir) is determined by the relationship of the closing price to the previous stop levels. If the price closes above the previous short stop level, a bullish turn is indicated, setting the direction to 1. Conversely, if the price closes below the previous long stop level, a bearish turn is indicated, setting the direction to -1.
3. Momentum Shifts: The script flags bullish momentum when the direction changes from -1 to 1, suggesting a shift in market sentiment from bearish to bullish. Similarly, bearish momentum is flagged when the direction changes from 1 to -1, indicating a potential shift from bullish to bearish sentiment.
4. Visual Cues and Alerts: For ease of use, the indicator plots shapes on the chart: an upward triangle below the bar for bullish momentum and a downward triangle above the bar for bearish momentum. These are color-coded green for bullish and red for bearish signals. Additionally, alert conditions are set for both bullish and bearish momentum to notify traders of potential shifts.
This indicator is intended for traders who want to capture significant shifts in momentum, potentially allowing for timely adjustments to their positions. The concept of using Average True Range-adjusted hl2 as a basis for stop levels introduces an original approach to momentum detection, diverging from traditional moving average or oscillator-based methods.
Remember that no indicator can predict market movements with absolute certainty. As with any trading tool, it's important to use the Bulls VS Bears Momentum Indicator in conjunction with a robust trading strategy and risk management protocols.
Usage Guidelines:
Ideal for mid to long-term trade setups.
Best used in trending markets to detect potential reversals.
Can be combined with other forms of analysis to confirm signals.
This script is a product of extensive market research and personal trading experience, and I am proud to offer it to the TradingView community. For any further queries or clarification on how to integrate this tool into your trading strategy, feel free to reach out.
Disclaimer:
The "Bulls VS Bears Momentum Indicator" is provided for informational purposes only and does not constitute trading advice. As a trader, you assume full responsibility for your trading decisions and the risks associated with financial markets. Past performance is not indicative of future results. Use this tool at your own risk.

No Wick Bull/Bear Candlesticks with Arrow premiumNo Wick Bull/Bear Candlesticks with Arrow premium
This script is for a custom trading indicator called "No Wick Bull/Bear Candlesticks with Arrow premium" developed by ClearTradingMind. It is designed for use with trading platforms that support scripting, such as TradingView. This indicator combines several technical analysis tools to help traders identify potential buy and sell signals in a financial market.
Key Components of the Indicator:
Moving Average (MA): The script allows users to select from various types of moving averages (SMA, EMA, HMA, etc.), which smooth out price data to identify trends. Users can set the length and type of the moving average.
Upper and Lower Bands: These bands are set at a specified deviation percentage above and below the chosen moving average. They help in identifying overbought and oversold conditions.
No Wick Bull/Bear Candlestick Identification:
Bullish Condition: A bullish candlestick is identified when the closing price is higher than the opening price, the low equals the open, and the close is above the moving average.
Bearish Condition: A bearish candlestick is identified when the closing price is lower than the opening price, the high equals the open, and the close is below the moving average.
No Wick: These conditions also imply that the candlesticks have no wicks, suggesting strong buying or selling pressure.
Arrows for Trading Signals:
No lower wick bull bar
No upper wick bear bar
When a bullish condition is met, a green upward-pointing triangle is plotted below the candlestick, indicating a potential buy signal.
When a bearish condition is met, a red downward-pointing triangle is plotted above the candlestick, indicating a potential sell signal.
EMA 20: An additional Exponential Moving Average with a length of 20 periods is plotted for further trend analysis.
Background Color Changes: The script changes the background color to blue if the EMA 20 is above the upper band, and to red if it is below the lower band, providing visual cues about the market trend.
How It Works:
Traders can input their preferences for the moving average type and length, source of the MA (like closing prices), and the deviation percentage for the bands.
The script then calculates the moving average, upper and lower bands, and checks for bullish or bearish candlestick conditions without wicks.
When such conditions are met, it plots arrows to suggest buy or sell signals.
The EMA 20 and background color changes offer additional trend information.
Usage:
This indicator is particularly useful in markets with clear trends. The no wick bull/bear candlesticks indicate strong buying or selling pressure, and the arrows provide clear visual signals for traders to consider entering or exiting positions. As with all trading indicators, it's recommended to use this tool in conjunction with other forms of analysis to confirm trading signals.
