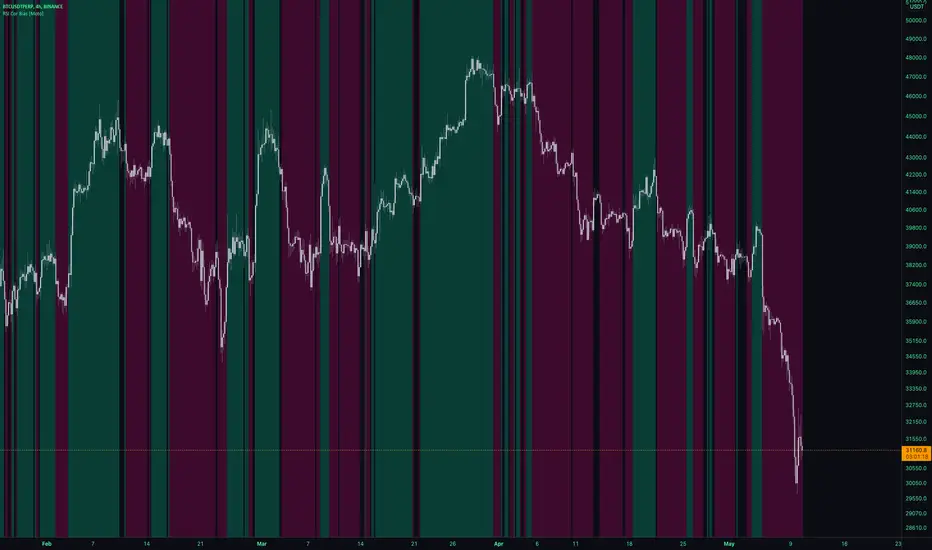
RSI Cor Bias [Moto]Hello traders,
This is a pretty simple script. It gives a background directional bias color respective to RSI levels from input thresholds in the settings. Users can choose the upper and lower thresholds and the symbol that the RSI is from.
For example, by default, the upper threshold is 52 and the lower 48. If Bitcoins RSi is above 52, the background color will be green, below 48 it's pink, between and no color will be applied.
Generally, buying should be occurring in pink to green transition or in green, and conversely selling should be occurring in green to pink transition or in pink.
Thanks,
Moto
Cerca negli script per "bias"
Market Bias (CEREBR)Hello Everyone. I hope you are all doing great. It's been a long time since I posted my first script here, and I got a lot of response from that.
So, I thought I should share this script also to everyone, and anyone that may find it useful. Personally, I use it to tell the general market conditions.
Here's how I works : The script tries to determine the overall direction of the market, using smoothed Heiken Ashi candles. The coloring system (using bright and dark colors) is an attempt to detect strong market and weak market conditions. There's also an oscillator within the script, but for now it isn't plotted. Credits to @jackvmk, I used part of his open-script code in this indicator.\
I have considered using the slope of the indicator plot as a filter for ranging market conditions. The plot goes relatively flat in 'flat' markets. However, I have not done anything about that yet. Maybe some other time.
I hope you find this useful. If you find a way to use this, please share it with the community in the comment section.
NOTE: THIS IS BY NO MEANS FINANCIAL ADVICE. You'll have to make your studies and come up with a way to apply this indicator to your trading style and strategy.
By the way, I would be going with the name 'CEREBR' for any subsequent scripts I release from now on.
Happy Trading, guys.

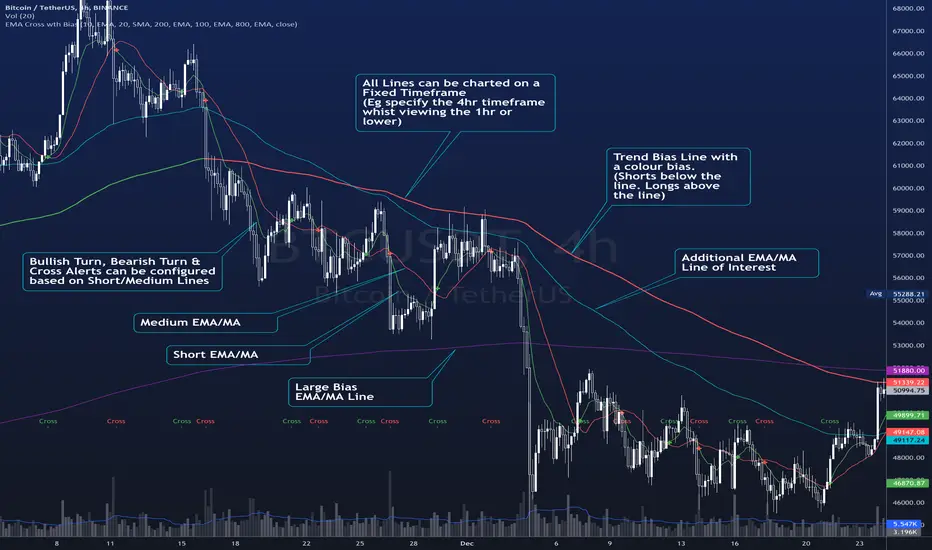
EMA Cross wth BiasThe Script plots 4 Moving averages.
1. Short Moving Average
2. Medium Moving Average
2. Trend Bias (Usually a much slower Moving Average) - Plots in Green when price action is above the line and Red for when price action is below the line.
3. Alerts are triggered when the short MA/ EMA turns. Can be used for Early Entry signals and Exits.
4. Alerts are triggered for Crosses of the Short and Medium MA
Each Moving average line can be confirmed to be a Simple MA or and EMA
Volume BiasHere’s an indicator that calculates the difference between the average distance we need to look back to find the up and down volume equal to the total volume of the last n bars. The further we need to look back to find the up or down volume, the more bearish or bullish its value is.
A not-yet published indicator from the PS-V5 blog!

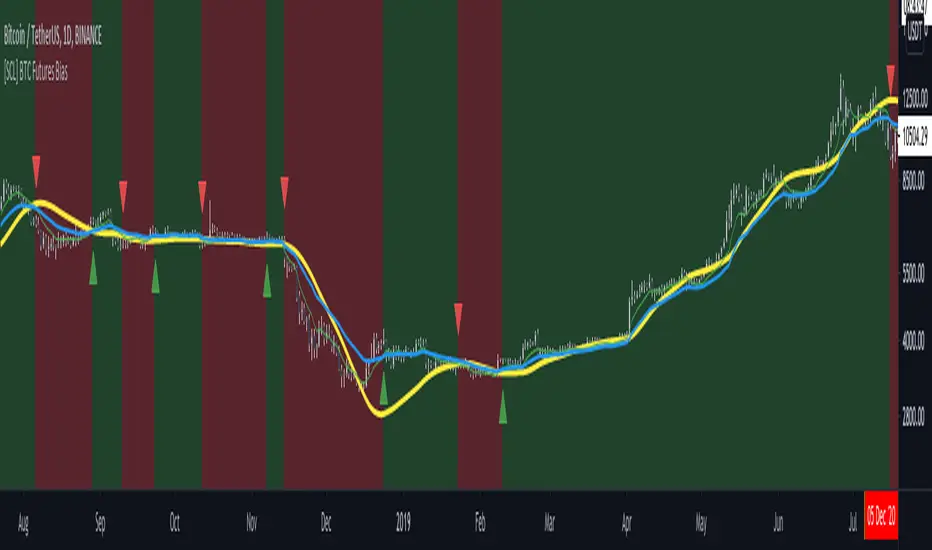
[SCL] BTC Futures Daily Bias (CME BTC1!)Derives a bias for BTC/USD on the daily timeframe and displays it on the chart in a configurable way. Takes price data from the CME BTC futures chart (exchange is configurable), regardless of what symbol you run it on.
Why? Because futures are said to give cleaner charts, but most traders are not trading CME futures. So you can use this indicator on whichever exchange you want to chart Bitcoin on.
Uses the 80D HMA and the 8D and 21D EMAs by default; all intervals are configurable.
Trends & RangesTrends & Ranges uses EMA ATR bands as a SuperTrend indicator.
How to use:
This indicator can be used to give you a direction bias, with the added function to create ranges which often lead to reversals or flat trading periods. Trade the break-out or wait for pull backs in the direction of the trend.
I'm not great at explaining stuff and will probably make things only more complicated, so I won't bother for now,
but if you have a question on how the script works I will gladly give it a try.
The option "Flexible Trends" will disable the min/max function (trailing or non trailing).
Flexible Trends enabled:
Flexible Trends disabled:
Settings are not optimized for any asset or time frame, you will have to do that for yourself. Feel free to share them in the comments.
Thanks for showing interest, enjoy and good luck! :)

Separated Moving Average [2] - evoThis is an updated version on one of my previous scripts. Small explanation in the description.
This new script gives you a direction bias based on closing above and below the lines, with an option to filter fake signals by waiting for one more candle close.
Also added more moving averages compared to the first script (built ins + donchian)
Hope you like it!
(If you're a coder with a slightly larger brain than me, please tell me in the comments if I fixed the repainting problem correctly, I'm not 100% sure..)

7EMA_5MA (G/D + Bias + 12/26 Signal)This script alow you to survey multiple crossing signals as Golden/Death cross (MA50/200), Institutional Bias (EMA9/18), or EMA 12/26 crossing. You can show/hide all EMAs/MAs and show/hide all signals. Default config displays EMA 50/100/200 and MA 20. Full script includes display of EMA 9/18/12/26/50/100/200 and MA 20/21/50/100/200.

RSI direction bias - JDThis simple indicator gives you a bias on the market that can be used as a filter, an entry indicator for pullbacks,...
Enjoy!
JD.
#NotTradingAdvice
#DYOR


2R overlay positive biasHere is a pretty clean 2R - risk reward assessment that is overlaid on the price action. Positive bias, kind of lazy on the release but you can edit to change look back period or drop into one of your indicator edits as another metric for trade risk. If this helps drop a comment or thumbs up.
-Squam

Weekly/Daily Cross & Bias ConfirmationThis indicator plots the weekly and daily open in addition to a current close price line.
It also signals when price closes above or below the daily and weekly opens.
Also, the bull/bear bias is painted on this indicator as well.
Black is the weekly open
Silver is the daily open
Weekly is default black arrows. Up is going above open, down is going below
Daily is default aqua arrows. Up is going above, down is going below
RSI + Volume + Bias linesJust added lines for bullish / bearish bias regions to the indicator from LazyBear


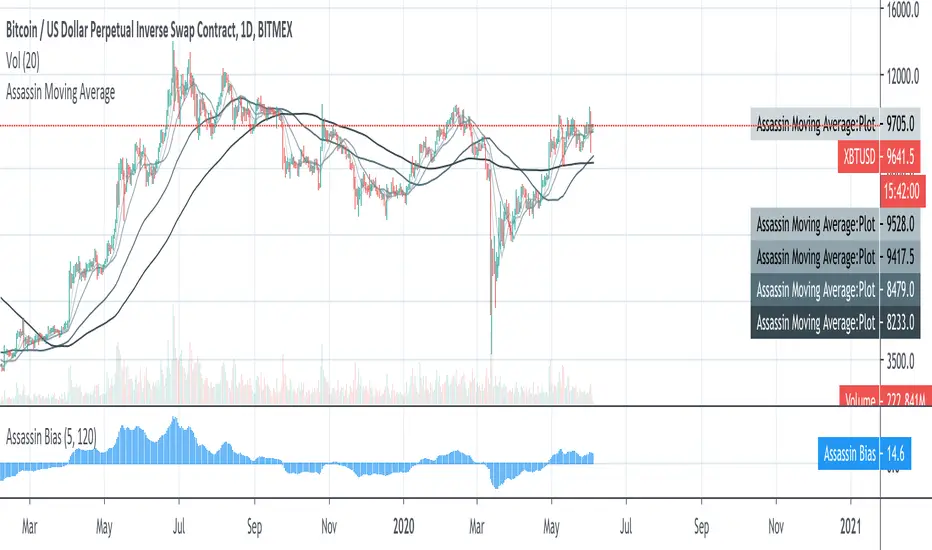
Inline Institutional BiasTrend identification indicator. Estimates (higher-timeframe) market state using the "Institutional Bias" MA relationship (9ema - 18ema, 1D timeframe). A "reference" MA (30sma - TRI's preferred MA for Trade Location) is then plotted, and colour-coded according to higher-timeframe market state.
NOTE: All MA lengths, types, and the timeframe to use are configurable, but default as above. All MAs are calculated using the "IB timeframe", even when zoomed in.

Bias Table-manualIt is just at tabular column to manually update Bullish/Bearish for multiple timeframes. Provided date option which is also manual, to denote when the analysis was done and table updated. This will be helpful for multiple stocks/securities analysis on regular basis

Bias Ratio-ETH-3H @CTTC5108Most of the code of this strategy should be my own original.
This Ethereum 3-hour time cycle strategy can be traced back to February 24, 2023. Although the profit and winning rate are not high, it is still relatively stable.
This strategy uses the deviation rate to enter the market. Invest 10% of the principal each time.
The limit start time adopts a rolling design (should be original).
Real-time retracement and maximum retracement are accurately calculated (should be original).
Adopt segmented stop profit (optional) design.
Open source for learning and other use.

AsianRange&Midnight 2.2### Midnight Setup: Trading Strategy
#### **Bias Definition (Trend Identification)**
- The Daily (D) bias is defined the previous day and validated on the line chart.
- On the Daily chart, identify the nearest V-shaped formation that has broken close to the current price. This formation determines the Daily bias direction.
#### **H4 Bias Analysis (Trend Confirmation)**
- Switch to an H4 chart to refine the analysis.
- Identify a similar V-shaped formation that has broken in the H4 timeframe.
- If the Daily and H4 biases are aligned, the setup is valid.
#### **Entry Strategy (Position Entries)**
- **Bearish Bias (D and H4 identical):**
- Short entry at the high level of the Midnight range.
- **Bullish Bias (D and H4 identical):**
- Long entry at the low level of the Midnight range.
#### **Bias Divergence (Context Adaptation)**
- If the H4 bias is opposite to the Daily bias, this indicates an H4 retracement of the Daily bias.
- Enter a counter-trend trade with reduced risk.
- No TP target beyond 50% of the extension validating the Daily break. It is also not recommended to enter against this divergence beyond 50%.
#### **Divergence Scenarios (Reactions to Divergences)**
- **Daily Bearish Bias, H4 Bullish Bias:**
- Long entry at the Midnight Low.
- **Daily Bullish Bias, H4 Bearish Bias:**
- Short entry at the Midnight High.
#### **Daily Bias Resumption (Trend Alignment)**
- As soon as the H4 bias resumes the Daily bias direction, follow this trend and adjust the position accordingly.
#### **Instructions for Divergent Bias (Managing Divergence)**
- When holding a position with a divergent bias, it is crucial to manage it carefully.
- Exit counter-trend trades as soon as the H4 bias realigns with the Daily bias.
- Limit the duration of counter-trend trades per session and adjust the H4 bias for the next session if needed.
#### **SL/TP Management (Profit Taking and Protection Optimization)**
- **Take Profit (TP):**
- Entry in M15 with a minimum RR of 3.
- TP at 5H NYE, or RR 5, or 15H NYE.
- **Stop Loss (SL):**
- Minimum 15 pips, placed just above the nearest swing to the entry point to protect capital.
- **Red Announcement Days:**
- Either abstain from trading or set a 40-pip SL to limit volatility impact.
- **At 6H/7H NYE:**
- Manage the trade based on its progress: exit, set to BE (Break Even), or keep the SL in place.
- Any SL adjustment outside these rules can only be made if supported by data or backtests.
#### **Risk Management (Capital Protection)**
- Maximum risk of **1% of capital per trade** (allowing for **10 consecutive losses** without significantly affecting capital).
- In case of a loss, **reduce risk by 50% on the next trade** until the loss is recovered.
#### **Efficiency Conditions (When This Setup Works Best)**
- This setup is particularly effective in **strong trends**, where the market has a clear direction.
- It is **less effective in ranging markets**, where prices move within a narrow range without a clear trend.
Setup Midnight : Stratégie de Trading

On-Chain Signals [LuxAlgo]The On-Chain Signals indicator uses fundamental blockchain metrics to provide traders with an objective technical view of their favorite cryptocurrencies.
It uses IntoTheBlock datasets integrated within TradingView to generate four key signals: Net Network Growth, In the Money, Concentration, and Large Transactions.
Together, these four signals provide traders with an overall directional bias of the market. All of the data can be visualized as a gauge, table, historical plot, or average.
🔶 USAGE
The main goal of this tool is to provide an overall directional bias based on four blockchain signals, each with three possible biases: bearish, neutral, or bullish. The thresholds for each signal bias can be adjusted on the settings panel.
These signals are based on IntoTheBlock's On-Chain Signals.
Net network growth: Change in the total number of addresses over the last seven periods; i.e., how many new addresses are being created.
In the Money: Change in the seven-period moving average of the total supply in the money. This shows how many addresses are profitable.
Concentration: Change in the aggregate addresses of whales and investors from the previous period. These are addresses holding at least 0.1% of the supply. This shows how many addresses are in the hands of a few.
Large Transactions: Changes in the number of transactions over $100,000. This metric tracks convergence or divergence from the 21- and 30-day EMAs and indicates the momentum of large transactions.
All of these signals together form the blockchain's overall directional bias.
Bearish: The number of bearish individual signals is greater than the number of bullish individual signals.
Neutral: The number of bearish individual signals is equal to the number of bullish individual signals.
Bullish: The number of bullish individual signals is greater than the number of bearish individual signals.
If the overall directional bias is bullish, we can expect the price of the observed cryptocurrency to increase. If the bias is bearish, we can expect the price to decrease. If the signal is neutral, the price may be more likely to stay the same.
Traders should be aware of two things. First, the signals provide optimal results when the chart is set to the daily timeframe. Second, the tool uses IntoTheBlock data, which is available on TradingView. Therefore, some cryptocurrencies may not be available.
🔹 Display Mode
Traders have three different display modes at their disposal. These modes can be easily selected from the settings panel. The gauge is set by default.
🔹 Gauge
The gauge will appear in the center of the visible space. Traders can adjust its size using the Scale parameter in the Settings panel. They can also give it a curved effect.
The number of bars displayed directly affects the gauge's resolution: More bars result in better resolution.
The chart above shows the effect that different scale configurations have on the gauge.
🔹 Historical Data
The chart above shows the historical data for each of the four signals.
Traders can use this mode to adjust the thresholds for each signal on the settings panel to fit the behavior of each cryptocurrency. They can also analyze how each metric impacts price behavior over time.
🔹 Average
This display mode provides an easy way to see the overall bias of past prices in order to analyze price behavior in relation to the underlying blockchain's directional bias.
The average is calculated by taking the values of the overall bias as -1 for bearish, 0 for neutral, and +1 for bullish, and then applying a triangular moving average over 20 periods by default. Simple and exponential moving averages are available, and traders can select the period length from the settings panel.
🔶 DETAILS
The four signals are based on IntoTheBlock's On-Chain Signals. We gather the data, manipulate it, and build the signals depending on each threshold.
Net network growth
float netNetworkGrowthData = customData('_TOTALADDRESSES')
float netNetworkGrowth = 100*(netNetworkGrowthData /netNetworkGrowthData - 1)
In the Money
float inTheMoneyData = customData('_INOUTMONEYIN')
float averageBalance = customData('_AVGBALANCE')
float inTheMoneyBalance = inTheMoneyData*averageBalance
float sma = ta.sma(inTheMoneyBalance,7)
float inTheMoney = ta.roc(sma,1)
Concentration
float whalesData = customData('_WHALESPERCENTAGE')
float inverstorsData = customData('_INVESTORSPERCENTAGE')
float bigHands = whalesData+inverstorsData
float concentration = ta.change(bigHands )*100
Large Transactions
float largeTransacionsData = customData('_LARGETXCOUNT')
float largeTX21 = ta.ema(largeTransacionsData,21)
float largeTX30 = ta.ema(largeTransacionsData,30)
float largeTransacions = ((largeTX21 - largeTX30)/largeTX30)*100
🔶 SETTINGS
Display mode: Select between gauge, historical data and average.
Average: Select a smoothing method and length period.
🔹 Thresholds
Net Network Growth : Bullish and bearish thresholds for this signal.
In The Money : Bullish and bearish thresholds for this signal.
Concentration : Bullish and bearish thresholds for this signal.
Transactions : Bullish and bearish thresholds for this signal.
🔹 Dashboard
Dashboard : Enable/disable dashboard display
Position : Select dashboard location
Size : Select dashboard size
🔹 Gauge
Scale : Select the size of the gauge
Curved : Enable/disable curved mode
Select Gauge colors for bearish, neutral and bullish bias
🔹 Style
Net Network Growth : Enable/disable historical plot and choose color
In The Money : Enable/disable historical plot and choose color
Concentration : Enable/disable historical plot and choose color
Large Transacions : Enable/disable historical plot and choose color
