60seconds Binary option StretegyReliable Indicator
U mean Up
D mean Down
How i use it:-
1- I add this indicator to my 5min chart
2-I create Alert manully
3-As soon as Alert come i trade for 1min.
Best if alert comes just in start of new candle in 1min or 5min
Guys let me know your results
:)
Enjoy.
Cerca negli script per "binary"

BO STRATEGY v4.0Multitimeframe channels based strategy for binary options. Non repainting signals. Entry on the next candle after a signal.

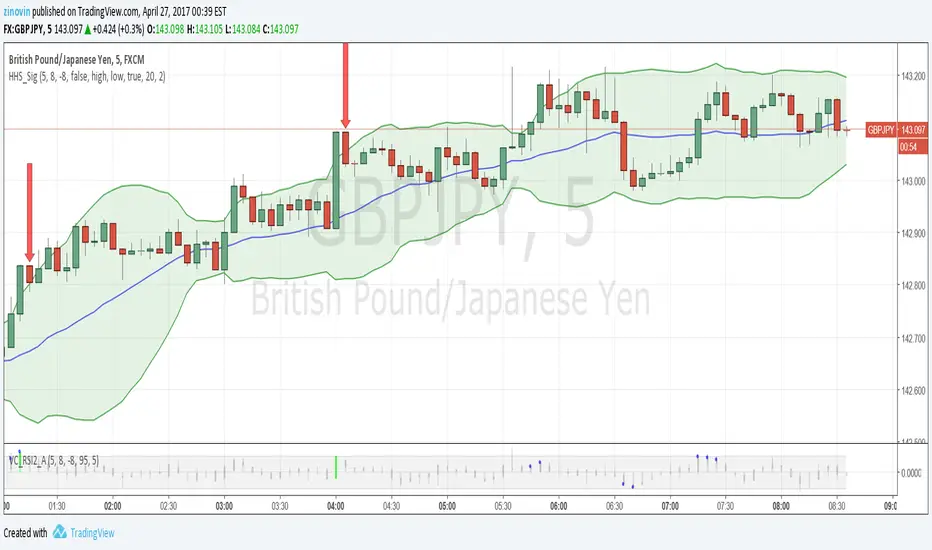
Hubba Hubba Style SignalsThe indicator shows signals for "Hubba Hubba Style" strategy (binary options). It is the best to use one with "Value Chart and RSI2 with Alert" indicator. I recommend to use TF5 and expiration time till 5 min.
Also HHS_Sig can show Bollinger Bands, Resistance and support lines based on William's fractals
VDUB BB %B REVERSAL_v4.2 revised by JustUncleLThis is an revised Open Public version of Vdub Bollinger Band %B reversal indicator. This version includes optional Divergence Finder with selectable channel width, optional Market Session time highlighting and optional Binary Option expiry markers.

Candlestick Trend Indicator v0.5 by JustUncleLRequested Update to this Indicator alert project. In this update I have added the option to be able select which Price Action candles you want included in the display and the generated alarm Alert. Other changes also included in this update:
Also added a Price Action candle for "Last Fractal S/R Break", this also a good continuation indication.
Added option to select a different moving average types for directional MA line.
Modified some default settings, using HullMA instead of Zero Lag EMA and standard MACD settings(12,26,9).
Description:
This is a trend following indicator and alert for Binary Options based on Candlestick patterns and trend line -
NOTE: original system was a forex trading system.
This code combines a number of indicators to create an overall trading strategy.
The indicator recognises and displays some useful candle named defined patterns that are used to support trend continuation:
Bearish + Bullish PinBars
Dark Cloud Cover
Piecing Line
Bullish + Bearish Harami
Bullish + Bearish Engulfing Candle
Bullish + Bearish Last Fractal S/R break
Also recognises main Price Action candles from ChrisMoody (CM), the four(4) price action patterns are colored coded bars:
Yellow = Inside Bar - breakout/continuance
Orange = Outside Bar - breakout/continuance
Aqua/Fuschia = Up/Down Shaved Bars - Buying/Selling pressure
Red/Green = Possible reversal PinBars - Reverse Down / reverse Up
The highlighted candles (maroon and darker green) represent the defined PA patterns that have been confirmed following the current trend direction that is indicated by the Hull MA(20) line (can select a different type of MA, or even disable) and confirmed by MACD direction (can be disabled). The confirmed Alerts are indication by green (buy) and red (sell) dots at the bottom of the chart. An alert is generated from this selection for the alert condition of the alarming system.
The fractal upper/lower break lines are also draw, if the (optional) last fractal break line is broken by a highlighted bar then this indicates a stronger trend conformation.
The MACD indicator MACD DEUTER 2 colour(12,26,9) you can visually see the MACD histogram colours with MACD direction - needs "MACD DEUTER 2 colour" indicator.
This multi-indicator set up is suitable for 1hr, 4hr and daily charts with 1-4 candle expiry.
References and Inspiration from:
Fractal Levels by RicardoSantos
Almost Zero Lag EMA
Candlestick Patterns With EMA by rmwaddelljr
CM_Price-Action-Bars by ChrisMoody
www.forexstrategiesresources.com
"Scalp Jockey - MTF MA Cross Visual Strategizer by JayRogers"

vdub Atlasvdub Atlas, Multiple strategy combined indicator
ichmoku,
inside bollinger bands,
Multiple ma's,
Strength indicator MA's
Hull ma,
vdub binaryPro,
Session background colours.
Switch out any indicator you don't want.

Evan Cabral's Quarter Theory by MrTuanDoanThis indicator is based on Evan Cabral's Market Timing Strategy.
In Binary Option or High Frequency Forex (HFX), it's very common to see the market make reversals at hours and half hours.
This indicator just simply draw vertical lines at each quarter of the hour.
You should change the color and opacity to fit your chart style.
With this indicator, you're going to know when to positions yourself with more accuracy on trade setups.
Note
It works best if you take your reversal trade at the top of the hour using your other (overbought/oversold) confirmation using RSI, Stoch RSI, DMI, etc.
It works better if you take your trade at resistance/support zones
You should pay attention to the direction the market is going before the hour (or half hour) and looking at how the direction changes going into the hour or after it.
Please backtest before taking real trades

L&S PROFIT SCALP Indicator for scalp trades for TF 1-15 minutes. 1-4 signals per day depending on the currency pair. Suitable for all crypto exchanges, Forex, binary options. Signals+ take profit Levels.

TradingView's Technical AnalysisAll indicators used on the Technical Analysis Summary from TradingView, composed with oscillators and moving averages. Sell and strong sell will represent more indicators showing sell signals. Buy and strong buy will represent more indicators showing buy signals. A white bar will show neutral signal (don't trade). This can be good for binary options or scalping on small time frames, but also very good on higher times for forex. The signal will appear on the candle before, so wait for the new candle to appear to see what direction the signal will indicate.

BOSS Bullish/Bearish Quantitative Qualitative Estimation (QQE)THE BEST FOREX, BINARY OPTIONS, AND CRYPTO INDICATORS FOR TRADINGVIEW.COM
This indicator is comprised by a smoothed Relative Strength Index and two trailing levels, based on volatility – Fast Trailing Level (Fast TL – the maroon line on the chart above) and Slow Trailing Level (Slow TL – the blue line on the chart above).
The two are determined by calculating the Average True Range (ATR) of the smoothed RSI during a specified number of periods, after which a further ATR smoothing is applied with the use of an additional n-periods Wilders smoothing function.
Ultimately, the RSI’s smoothed ATR is multiplied by the Fast and Slow ATR Multipliers in order to determine the final Fast and Slow Trailing Levels.
Trading the QQE buy and sell signals:
Buy Signal
Bullish crossover happens when Fast ATR TL crosses above Slow ATR TL. When this occurs a blue circle & blue candle will appear and a alert signal to buy is generated.
Sell Signal
Bearish crossover happens when Slow ATR TL crosses above Fast ATR TL. When this occurs a maroon circle & maroon candle will appear and a alert signal to sell is generated.
Bullish/Bearish Divergence Background
Green background indicates Bullish Divergence
Red background indicates Bearish Divergence
Overbought and Oversold Conditions
An overbought condition occurs, when the QQE is at or above its 0.10 level.
An oversold condition occurs, when the QQE is at or below its -.10 level.

BOSS Zero-Lag Dynamic MACDTHE BEST FOREX, BINARY OPTIONS, AND CRYPTO INDICATORS FOR TRADINGVIEW.COM
Our MACD is a Zero-Lag (well near zero-lag) We make this claim because MACD utilizes Moving Averages and as you know moving averages are lagging indicators.
For our MACD we utilize The McGinley Dynamic which looks like a moving average line yet it is a smoothing mechanism for prices that turns out to track far better than any moving average.
The McGinley Dynamic minimizes price separation, price whipsaws and hugs prices much more closely.
The McGinley Dynamic does this automatically as this is a factor of the formula.
Because of the calculation, the Dynamic Line speeds up in down markets as it follows prices yet moves more slowly in up markets.
As traders we want to be quick to sell in a down market, yet ride an up market as long as possible.
Source: Investopedia.com
Chart Image shows conventional MACD on Bottom and BOSS Zero-Lag Dynamic MACD on top
Available at: bosscripts.com

BOSS EMA Trend MeterTHE BEST FOREX, BINARY OPTIONS, AND CRYPTO INDICATORS FOR TRADINGVIEW.COM
Bullish Uptrend
To determine bullish uptrend there must beat least 2 green squares on all three trend meters. This is a great predictor that a uptrend is imminent.
Bearish Downtrend
To determine bearish downtrend there must beat least 2 red squares on all three trend meters. This is a great predictor that a downtrend is imminent.
For best results use with Boss Bull/Bear Stochastic RSI
If you get a buy signal on Boss Bull/Bear Stochastic RSI and trend meter has a minimum of 2 green squares then this is a great buy/long entry.
If you get a sell signal on Boss Bull/Bear Stochastic RSI and trend meter has a minimum of 2 red squares then this is a great sell/short entry
Available at bosscripts.com
Website bosscripts.com

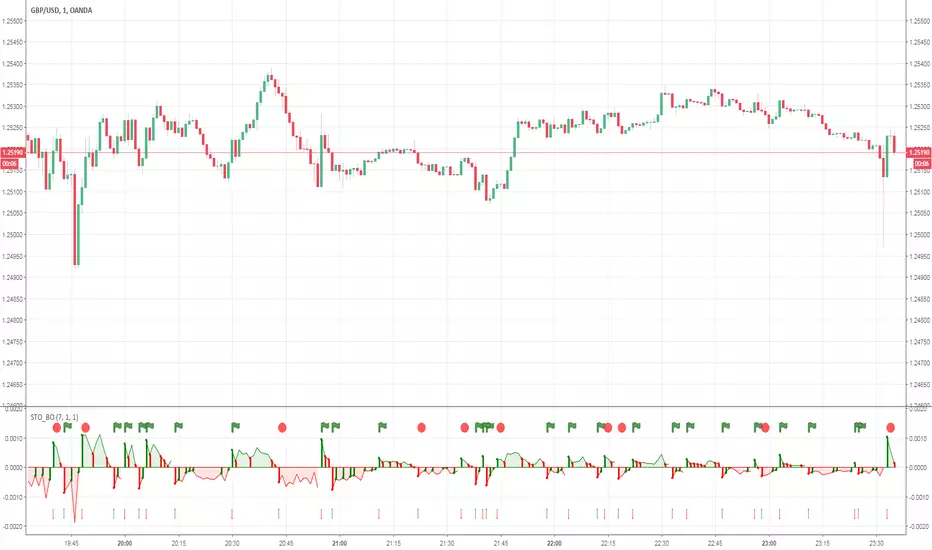
BOSS Smooth Stochastic Bull/Bear Oscillator With Alerts THE BEST FOREX, BINARY OPTIONS, AND CRYPTO INDICATORS FOR TRADINGVIEW.COM
Short Entry
During a price downtrend and you get a sell signal (red dot) enter short when the "K" line (green line) drops below 65 (mid upper band).
Long Entry
During an uptrend, buy when you get a long signal (green dot) and "D" line (red line) rises above 35 (mid lower band) .
Bull/Bear
Green background indicates bullish price action (uptrend)
Red background indicates bearish price action (downtrend)
Available At bosscripts.com
Website bosscripts.com

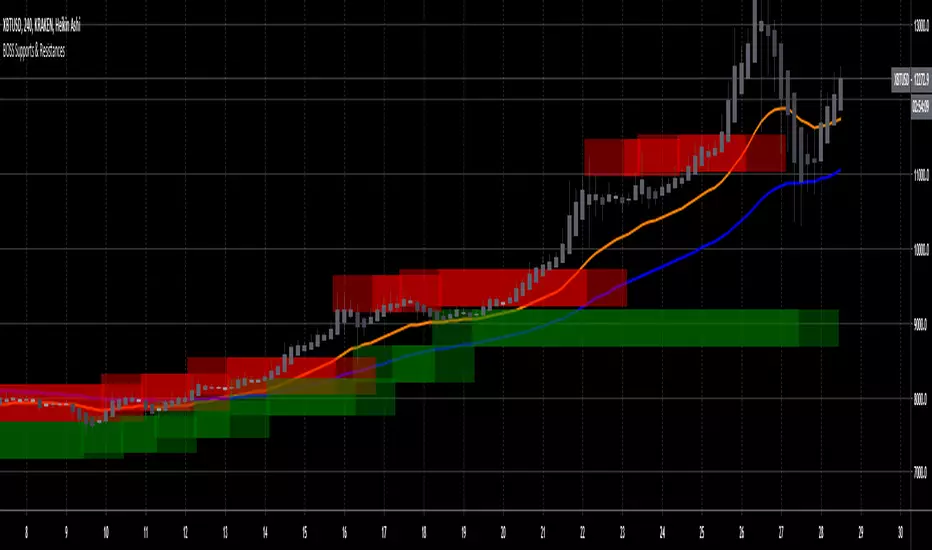
Boss Support and Resistance zonesTHE BEST FOREX, BINARY OPTIONS, AND CRYPTO INDICATORS FOR TRADINGVIEW.COM
Green = Support Zones
Red = Resistance Zones
The basic trading method for using support and resistance is to buy/long near support in uptrends, and to sell/short near resistance in downtrends.
Also included in this indicator are a Higher High, Lower High, Higher Low, and Lower Low indicator as well as Fast and Slow EMA'S
Available at bosscripts.com
Website bosscripts.com
BOSS Automatic TrendlinesTHE BEST FOREX, BINARY OPTIONS, AND CRYPTO INDICATORS FOR TRADINGVIEW.COM
Trendlines when drawn properly make an excellent tool for traders. Used improperly though, they become ineffective and even counterproductive, resulting in a belief that prices have made a reversal when they really haven't, or that a trend has strength when price action suggests it doesn't.
The Boss Auto Trendline Indicator draws the trendlines automatically, and now you can effectively use trendlines as part of your trading strategy.
Trendlines highlight a trend or range (sideways movement). A trendline connects swing lows, where the low is lower than the surrounding prices, and swing highs in price. When the price rises, the swing lows rise.
Red Lines & Dots.
Connecting these lows with a line results in an ascending trendline, showing you that the trend is up. A trendline can also be drawn along the swing highs. This shows the angle of ascent, and the strength of the price move, whether strongly higher or not.
Green Lines & Dots
When the price falls, the swing highs fall. Connecting these highs with a line results in a descending trendline, illustrating the downward trend. A trendline can also be drawn along the swing lows. This shows the angle of descent and the strength of the downward price movement.
Available at bosscripts.com
Website bosscripts.com

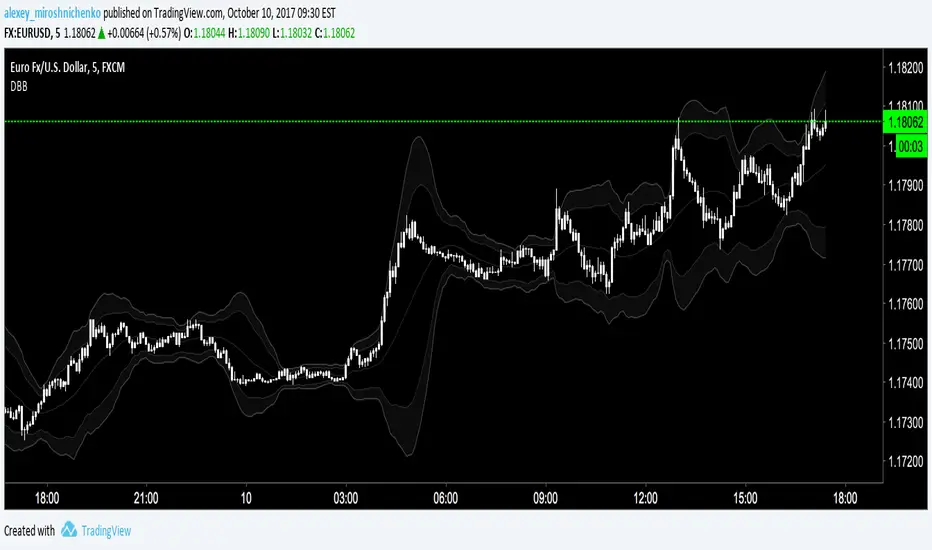
double bollinger bandssimple, yet effective tool to catch reversals for short-term binary options trading.
Philpose's Binary Turbo 1.2Hello there,
I'm thrilled to introduce my very first TradingView indicator - "Philpose's Binary Turbo 1.0." This indicator isn't just another tool; it's my unique take on binary options trading, powered by the Relative Strength Index (RSI).
Differences from Other Indicators:
This indicator is designed for traders who prefer short-term trading, as it uses a 1-minute timeframe.
It assumes that RSI crossovers of overbought and oversold levels can be used to generate binary options signals.
Users should backtest and evaluate the indicator's performance in different market conditions and consider risk management strategies.
Custom Logic: This indicator implements a custom trading logic based on RSI crossovers of overbought and oversold levels. Many indicators on TradingView use standard indicators, but this script incorporates unique logic.
Signal Tracking: It tracks and displays the last buy and sell signals on the chart. This visual representation can be helpful for traders to see when signals were generated.
Streak Tracking: The script keeps track of winning and losing streaks, which can provide traders with insights into their trading performance over time.
Table Summary: It creates a table summarizing various statistics related to the signals generated, such as total signals, wins, losses, and streaks. This tabular representation can be useful for traders to assess the indicator's performance.
How to Use:
To use this indicator effectively, follow these steps:
Add the Indicator: Copy and paste the script into TradingView's Pine Script editor. Then, apply the indicator to the chart.
Customize Parameters: Adjust the RSI parameters (period, overbought, and oversold levels) and the minimum bars between signals according to your trading strategy and preferences.
Interpret Signals: Buy signals are generated when the RSI crosses above the oversold level, and sell signals occur when it crosses below the overbought level.
Analyze Streaks: Keep an eye on the win and loss streaks to assess the indicator's performance and your trading strategy.
Review Table: The table at the top-right corner of the chart provides a summary of important statistics related to signals, wins, losses, and streaks.
Markets and Conditions:
The script can be used in various financial markets, including stocks, forex, commodities, and indices. However, it's important to note that binary options trading has a distinct risk profile and is available on certain platforms. Therefore, you should ensure that your chosen binary options platform supports TradingView indicators and that you understand the specific conditions of binary options trading.
Conditions for Use:
This indicator is designed for traders who prefer short-term trading, as it uses a 1-minute timeframe.
It assumes that RSI crossovers of overbought and oversold levels can be used to generate binary options signals.
Users should backtest and evaluate the indicator's performance in different market conditions and consider risk management strategies.
Please exercise caution when using any trading indicator or strategy, especially in binary options trading, as it involves a high level of risk, and you may lose your entire investment. It's advisable to thoroughly test any strategy on a demo account before trading with real funds and to seek the advice of a qualified financial advisor if you are unsure about your trading decisions.

BTC/USD 3-Min Binary Prediction [v7.2 EN]BTC/USD 3-Minute Binary Prediction Indicator v7.2 - Complete Guide
Overview
This is an advanced technical analysis indicator designed for Bitcoin/USD binary options trading with 3-minute expiration times. The system aims for an 83% win rate by combining multiple analysis layers and pattern recognition.
How It Works
Core Prediction Logic
- Timeframe: Predicts whether BTC price will be ±$25 higher (HIGH) or lower (LOW) after 3 minutes
- Entry Signals: Generates HIGH/LOW signals when confidence exceeds threshold (default 75%)
- Verification: Automatically tracks and displays win/loss statistics in real-time
5-Layer Filter System
The indicator uses a sophisticated scoring system (0-100 points):
1. Trend Filter (25 points) - Analyzes EMA alignments and price momentum
2. Leading Indicators (25 points) - RSI and MACD divergence analysis
3. Volume Confirmation (20 points) - Detects unusual volume patterns
4. Support/Resistance (15 points) - Identifies key price levels
5. Momentum Alignment (15 points) - Measures acceleration and deceleration
Pattern Recognition
Automatically detects and visualizes:
- Double Tops/Bottoms - Reversal patterns
- Triangles - Ascending, descending, symmetrical
- Channels - Trending price channels
- Candlestick Patterns - Engulfing, hammer, hanging man
Multi-Timeframe Analysis
- Uses 1-minute and 5-minute data for confirmation
- Aligns multiple timeframes for higher probability trades
- Monitors trend consistency across timeframes
Key Features
Display Panels
1. Statistics Panel (Top Right)
- Overall win rate percentage
- Hourly performance (wins/losses)
- Daily performance
- Current system status
2. Analysis Panel (Left Side)
- Market trend analysis
- RSI status (overbought/oversold)
- Volume conditions
- Filter scores for each component
- Final HIGH/LOW/WAIT decision
Visual Signals
- Green Triangle (↑) = HIGH prediction
- Red Triangle (↓) = LOW prediction
- Yellow Background = Entry opportunity
- Blue Background = Waiting for result
Configuration Options
Basic Settings
- Range Width: Target price movement (default $50 = ±$25)
- Min Confidence: Minimum confidence to enter (default 75%)
- Max Daily Trades: Risk management limit (default 5)
Filters (Can be toggled on/off)
- Trend Filter
- Volume Confirmation
- Support/Resistance Filter
- Momentum Alignment
Display Options
- Show/hide signals, statistics, analysis
- Minimal Mode for cleaner charts
- EMA line visibility
Important Risk Warnings
Binary Options Trading Risks:
1. High Risk Product - Binary options are extremely risky and banned in many countries
2. Not Investment Advice - This tool is for educational/analytical purposes only
3. No Guaranteed Returns - Past performance doesn't predict future results
4. Capital at Risk - You can lose your entire investment in seconds
Technical Limitations:
- Requires stable internet connection
- Performance varies with market conditions
- High volatility can reduce accuracy
- Not suitable for news events or low liquidity periods
Best Practices
1. Paper Trade First - Test thoroughly on demo accounts
2. Risk Management - Never risk more than 1-2% per trade
3. Market Conditions - Works best in normal volatility conditions
4. Avoid Major Events - Don't trade during major news releases
5. Monitor Performance - Track your actual results vs displayed statistics
Setup Instructions
1. Add to TradingView chart (BTC/USD preferred)
2. Use 30-second or 1-minute chart timeframe
3. Adjust settings based on your risk tolerance
4. Monitor F-Score (should be >65 for entries)
5. Wait for clear HIGH/LOW signals with high confidence
Alert Configuration
The indicator provides three alert types:
- HIGH Signal alerts
- LOW Signal alerts
- General entry opportunity alerts
Legal Disclaimer
Binary options trading may not be legal in your jurisdiction. Many countries including the USA, Canada, and EU nations have restrictions or outright bans on binary options. Always check local regulations and consult with financial advisors before trading.
Remember: This is a technical analysis tool, not a money-printing machine. Successful trading requires discipline, risk management, and continuous learning. The displayed statistics are historical and don't guarantee future performance.

EURUSD Binary Strategy Indicator ALERTS!Good afternoon traders!
The EURUSD Binary Strategy Indicator ALERT, is a continuation of the " EURUSD Binary Strategy 73% Win Ratio " strategy made by my self. This indicator allows you to add alerts in order for you not to miss a trade! Furthermore, for the purchase of the " EURUSD Binary Strategy 73% Win Ratio " strategy, this indicator is also included.
A FREE 5 DAY VERSION of the " EURUSD Binary Strategy 73% Win Ratio " Strategy is available! Go try it now!
Best regards!
Contact:
emilianomesauribe2000@live.com

Polymarket 15m BTC Probability [10x]This indicator is a specialized quantitative tool designed for trading 15-minute Bitcoin Binary Markets (e.g., Polymarket, Kalshi, or high-frequency binary options).
Unlike standard technical analysis which relies on past price patterns, this script utilizes Micro-Temporal Density Collapse Theory. It models the 15-minute candle not as a trend, but as a binary derivative subject to Brownian Bridge dynamics, calculating the mathematical probability of the outcome based on Time to Expiry and Volatility.
The Math: Micro-Temporal Density CollapseIn ultra-short duration binary markets, the token price is almost entirely a function of the Standardized Distance to Strike. This script implements a real-time Probability Engine using the Normal Cumulative Distribution Function (CDF) via the Abramowitz & Stegun approximation for the Error Function (erf).
How to Use
Timeframe: Set chart to 1 minute. Symbol: COINBASE:BTCUSD (or the specific index your market uses). Application: Use the Fair Value to spot mispricing (e.g., if the Script says 60% probability but the market is trading at 80 cents, the contract is overpriced). Use the Ghost Overlay to visualize the macro trend without leaving the 1m execution chart.
Settings Volatility Lookback: Length of the ATR/StDev calculation (Default: 15).
Visuals: Toggle the Ghost Candles and HUD on/off.

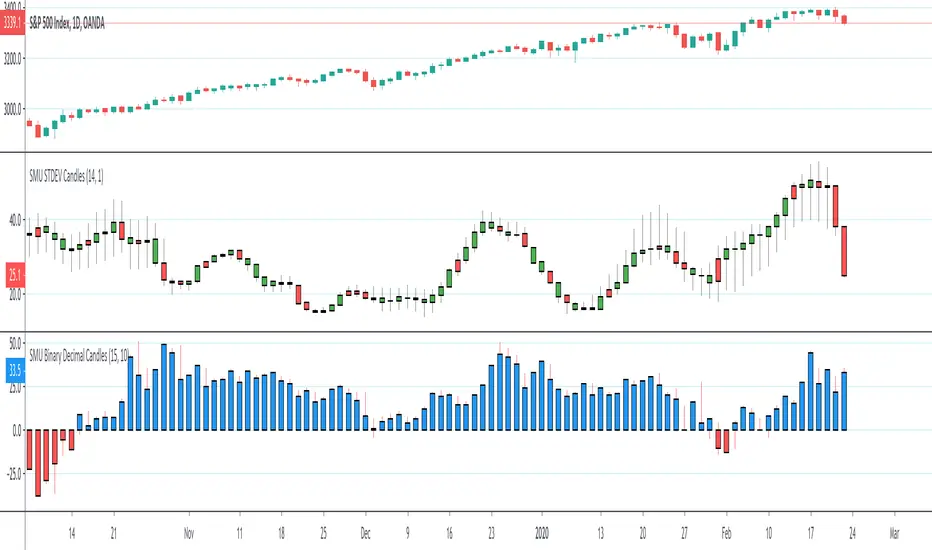
SMU Binary Decimal CandlesThis script creates a Decimal and Binary representation of the price using ROC. The idea is to simplify the price action into a distance from Zero to upside and downside.
You can see clearly trend develops in the ROC in the decimal view, kind of like MACD but based on raw price action change. I'm' a big fan of raw price action, so my scripts are super simple.
You can also use this script in a binary mode close higher = 1 and lower is -1. I use the binary mode to remove the psychological pressure of watching the stock going against me. I turn off the actual price and only focus on number of reds vs blue. On a Quantum physics level, when I short, I observe /wish for more reds like last night 1% sell-off
The main message form all my scripts is think outside the box, experiment with something crazy that doesn't make sense at first and make it to make sense. I always start with an idea that pops into my head, script with Pine script super simple and then watch it for hours to see what is trying to tell me. I have many work in progress that still doesn't make sense but looks really weird and wonderful. When I figure out what is trying to tell me I publish it
Relative Performance Binary FilterDescription:
This indicator monitors the relative performance of 30 selected crypto assets and generates a binary signal for each: 1 if the asset’s price has increased above a user-defined threshold over a specified lookback period, 0 otherwise. The script produces a JSON-formatted output suitable for webhooks, allowing you to send the signals to external applications like Google Sheets.
Key Features:
Configurable lookback period, price source, and performance threshold.
Supports confirmed or real-time bar data.
Monitors 30 crypto assets simultaneously.
Produces a one-line JSON output with batch grouping for easy webhook integration.
Includes an optional visual sum plot showing how many assets are above the threshold at any time.
Use Cases:
Automate performance tracking across multiple crypto assets.
Feed binary signals into external dashboards, trading bots, or Google Sheets.
Quickly identify which assets are outperforming a set threshold.
