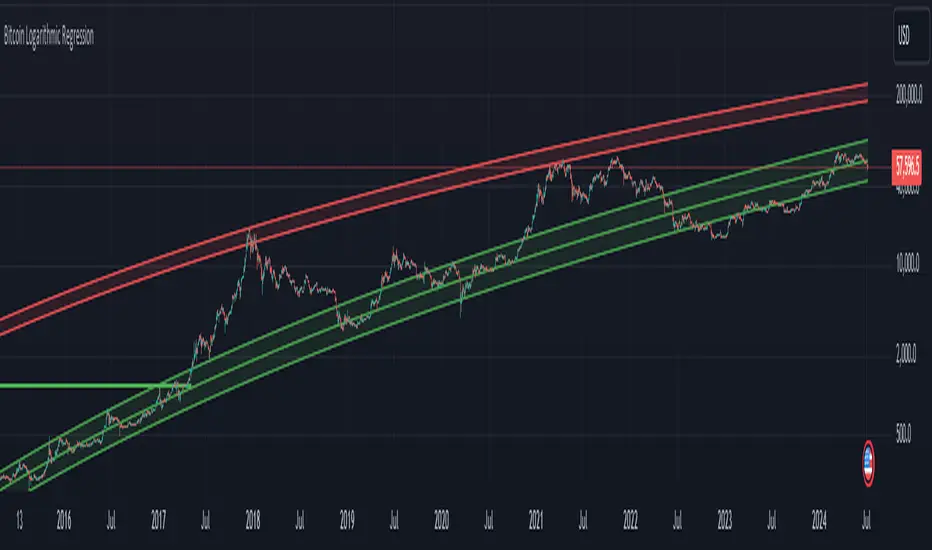
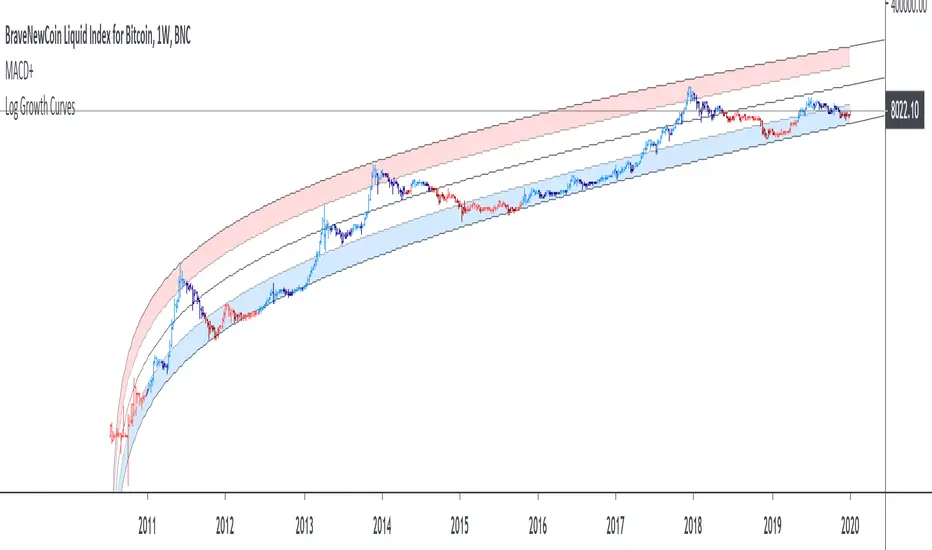
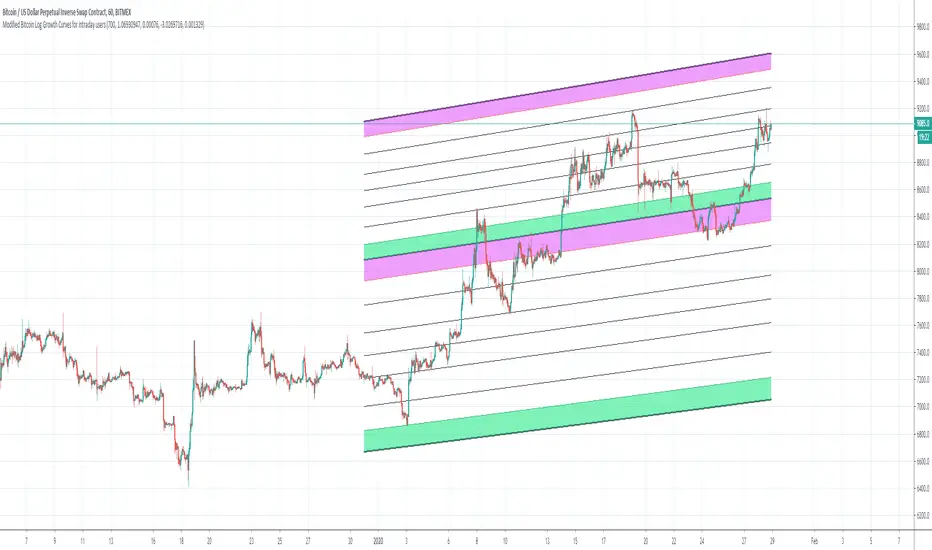
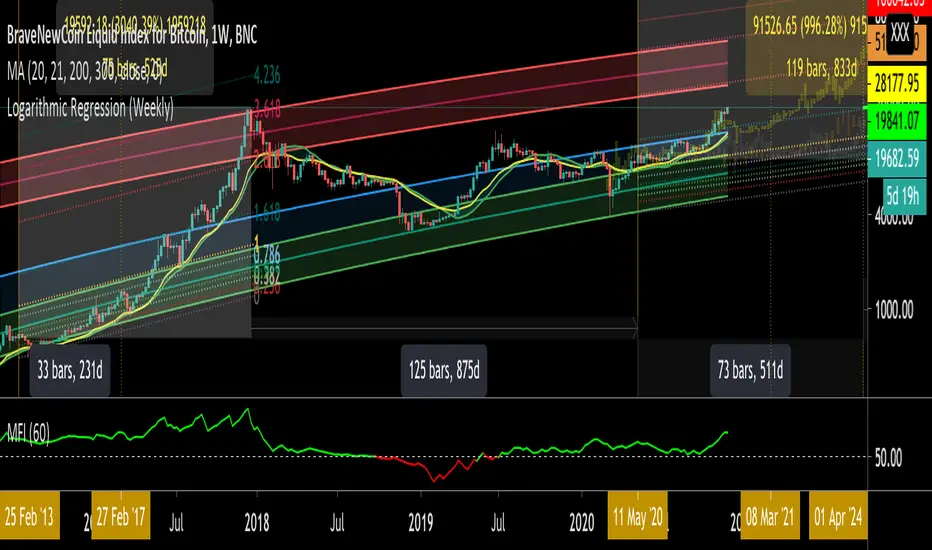
Bitcoin Logarithmic Curves OscillatorThis a companion indicator for the Bitcoin Logarithmic Growth Curves indicator.
This is an oscillator version of the above. When the indicator is at / near 1 then Bitcoin price is at / near the upper range of its long-term logarithmic growth trend. When at / near 0 then price is at / near the lower range of that trend.
This indicator only works with the BLX Brave New Coin Index (ticker:BLX) and only on 1 day, 3 day, or 1 week timeframes.
Cerca negli script per "bitcoin logarithmic"
Bitcoin Logarithmic Growth Curve 2024The Bitcoin logarithmic growth curve is a concept used to analyze Bitcoin's price movements over time. The idea is based on the observation that Bitcoin's price tends to grow exponentially, particularly during bull markets. It attempts to give a long-term perspective on the Bitcoin price movements.
The curve includes an upper and lower band. These bands often represent zones where Bitcoin's price is overextended (upper band) or undervalued (lower band) relative to its historical growth trajectory. When the price touches or exceeds the upper band, it may indicate a speculative bubble, while prices near the lower band may suggest a buying opportunity.
Unlike most Bitcoin growth curve indicators, this one includes a logarithmic growth curve optimized using the latest 2024 price data, making it, in our view, superior to previous models. Additionally, it features statistical confidence intervals derived from linear regression, compatible across all timeframes, and extrapolates the data far into the future. Finally, this model allows users the flexibility to manually adjust the function parameters to suit their preferences.
The Bitcoin logarithmic growth curve has the following function:
y = 10^(a * log10(x) - b)
In the context of this formula, the y value represents the Bitcoin price, while the x value corresponds to the time, specifically indicated by the weekly bar number on the chart.
How is it made (You can skip this section if you’re not a fan of math):
To optimize the fit of this function and determine the optimal values of a and b, the previous weekly cycle peak values were analyzed. The corresponding x and y values were recorded as follows:
113, 18.55
240, 1004.42
451, 19128.27
655, 65502.47
The same process was applied to the bear market low values:
103, 2.48
267, 211.03
471, 3192.87
676, 16255.15
Next, these values were converted to their linear form by applying the base-10 logarithm. This transformation allows the function to be expressed in a linear state: y = a * x − b. This step is essential for enabling linear regression on these values.
For the cycle peak (x,y) values:
2.053, 1.268
2.380, 3.002
2.654, 4.282
2.816, 4.816
And for the bear market low (x,y) values:
2.013, 0.394
2.427, 2.324
2.673, 3.504
2.830, 4.211
Next, linear regression was performed on both these datasets. (Numerous tools are available online for linear regression calculations, making manual computations unnecessary).
Linear regression is a method used to find a straight line that best represents the relationship between two variables. It looks at how changes in one variable affect another and tries to predict values based on that relationship.
The goal is to minimize the differences between the actual data points and the points predicted by the line. Essentially, it aims to optimize for the highest R-Square value.
Below are the results:
It is important to note that both the slope (a-value) and the y-intercept (b-value) have associated standard errors. These standard errors can be used to calculate confidence intervals by multiplying them by the t-values (two degrees of freedom) from the linear regression.
These t-values can be found in a t-distribution table. For the top cycle confidence intervals, we used t10% (0.133), t25% (0.323), and t33% (0.414). For the bottom cycle confidence intervals, the t-values used were t10% (0.133), t25% (0.323), t33% (0.414), t50% (0.765), and t67% (1.063).
The final bull cycle function is:
y = 10^(4.058 ± 0.133 * log10(x) – 6.44 ± 0.324)
The final bear cycle function is:
y = 10^(4.684 ± 0.025 * log10(x) – -9.034 ± 0.063)
The main Criticisms of growth curve models:
The Bitcoin logarithmic growth curve model faces several general criticisms that we’d like to highlight briefly. The most significant, in our view, is its heavy reliance on past price data, which may not accurately forecast future trends. For instance, previous growth curve models from 2020 on TradingView were overly optimistic in predicting the last cycle’s peak.
This is why we aimed to present our process for deriving the final functions in a transparent, step-by-step scientific manner, including statistical confidence intervals. It's important to note that the bull cycle function is less reliable than the bear cycle function, as the top band is significantly wider than the bottom band.
Even so, we still believe that the Bitcoin logarithmic growth curve presented in this script is overly optimistic since it goes parly against the concept of diminishing returns which we discussed in this post:
This is why we also propose alternative parameter settings that align more closely with the theory of diminishing returns.
Our recommendations:
Drawing on the concept of diminishing returns, we propose alternative settings for this model that we believe provide a more realistic forecast aligned with this theory. The adjusted parameters apply only to the top band: a-value: 3.637 ± 0.2343 and b-parameter: -5.369 ± 0.6264. However, please note that these values are highly subjective, and you should be aware of the model's limitations.
Conservative bull cycle model:
y = 10^(3.637 ± 0.2343 * log10(x) - 5.369 ± 0.6264)
Bitcoin Logarithmic Fractal Growth Model By ARUDDThis model, which I'm calling the Logarithmic Fractal Growth Mode (L.F.G) , uses Bitcoin's mathematical monetary policy to evaluate the future possible price valuation.
It takes into account fractal (and logarithmic) growth as well as how those who hold bitcoins might react to certain events such as changes in supply and demand. It also shows that it is mathematically logical that someday it must become stable.
The information gained from knowing this helps people make more informed decisions when buying bitcoin and thinking of its future possibilities.
The model can serve as some type of general guideline for determining how much bitcoins should be worth in the future if it follows a certain path from its current price.
Modeling Bitcoin's money supply mathematically, and knowing that there is a finite number of them, makes this whole process much more rational than just thinking about the possibilities in pure subjective terms.
Before going any further I want to say that no one can know with absolute certainty what will happen to bitcoins price in the future, but using mathematics gives us an idea of where things are headed.
The results presented here are based on very reasonable assumptions for how bitcoin might continue to grow (and then level out) once there are over 21 million bitcoins in existence.
The model shows that bitcoin's price can never go down to zero (thus creating the "death spiral" phenomenon), and as such, bitcoin has an extremely high probability of becoming stable as it approaches infinity.
Conversely, this model also shows that at some point there is a high probability that bitcoin will not continue to grow exponentially forever.
Credit goes to Quantadelic for the awesome original script.
ARUDD
Bitcoin Logarithmic Growth Curves & ZonesI found this awesome script from @quantadelic and edited it to be a bit more legible for regular use, including coloured zones and removing the intercept / slope values as variables, to leave space for the fib levels in the indicator display. I hope you all like it.
Universal logarithmic growth curves, with support and resistanceLogarithmic regression is used to model data where growth or decay accelerates rapidly at first and then slows over time. This model is for the long term series data (such as 10 years time span).
The user can consider entering the market when the price below 25% or 5% confidence and consider take profit when the price goes above 75% or 95% confidence line.
This script is:
- Designed to be usable in all tickers. (not only for bitcoin now!)
- Logarithmic regression and shows support-resistance level
- Shape of lines are all linear adjustable
- Height difference of levels and zones are customizable
- Support and resistance levels are highlighted
Input panel:
- Steps of drawing: Won't change it unless there are display problems.
- Resistance, support, other level color: self-explanatory.
- Stdev multipliers: A constant variable to adjust regression boundaries.
- Fib level N: Base on the relative position of top line and base line. If you don't want all fib levels, you might set all fib levels = 0.5.
- Linear lift up: vertically lift up the whole set of lines. By linear multiplication.
- Curvature constant: It is the base value of the exponential transform before converting it back to the chart and plotting it. A bigger base value will make a more upward curvy line.
FAQ:
Q: How to use it?
A: Click "Fx" in your chart then search this script to get it into your chart. Then right click the price axis, then select "Logarithmic" scale to show the curves probably.
Q: Why release this script?
A: - This script is intended to to fix the current issues of bitcoins growth curve script, and to provide a better version of the logarithmic curve, which is not only for bitcoin , but for all kinds of tickers.
- In the public library there is a hardcoded logarithmic growth curve by @quantadelic . But unfortunately that curve was hardcoded by his manual inputs, which makes the curve stop updating its value since 2019 the date he publish that code. Many users of that script love using it but they realize it was stop updating, many users out there based on @quantadelic version of "bitcoin logarithmic growth curves" and they tried their best to update the coordinates with their own hardcode input values. Eventually, a lot of redundant hardcoded "Bitcoin growth curve" scripts was born in the public library. Which is not a good thing.
Q: What about looking at the regression result with a log scale price axis?
A: You can use this script that I published in a year ago. This script display the result in a log scale price axis.
Bitcoin Logarithmic Regression BandsOverview
This indicator displays logarithmic regression bands for Bitcoin. Logarithmic regression is a statistical method used to model data where growth slows down over time. I initially created these bands in 2019 using a spreadsheet, and later coded them in TradingView in 2021. Over time, the bands proved effective at capturing Bitcoin's bull market peaks and bear market lows. In 2024, I decided to share this indicator because I believe these logarithmic regression bands offer the best fit for the Bitcoin chart.
How It Works
The logarithmic regression lines are fitted to the Bitcoin (BTCUSD) chart using two key factors: the 'a' factor (slope) and the 'b' factor (intercept). The two lines in the upper and lower bands share the same 'a' factor, but I adjust the 'b' factor by 0.2 to more accurately capture the bull market peaks and bear market lows. The formula for logaritmic regression is 10^((a * ln) - b).
How to Use the Logarithmic Regression Bands
1. Lower Band (Support Band):
The two lines in the lower band create a potential support area for Bitcoin’s price. Historically, Bitcoin’s price has always found its lows within this band during past market cycles. When the price is within the lower band, it suggests that Bitcoin is undervalued and could be set for a rebound.
2. Upper Band (Resistance Band):
The two lines in the upper band create a potential resistance area for Bitcoin’s price. Bitcoin has consistently reached its highs in this band during previous market cycles. If the price is within the upper band, it indicates that Bitcoin is overvalued, and a potential price correction may be imminent.
Use Cases
- Price Bottoming:
Bitcoin tends to bottom out at the lower band before entering a prolonged bull market or a period of sideways movement.
- Price Topping:
In reverse, Bitcoin tends to top out at the upper band before entering a bear market phase.
- Profitable Strategy:
Buying at the lower band and selling at the upper band can be a profitable trading strategy, as these bands often indicate key price levels for Bitcoin’s market cycles.
Bitcoin Logarithmic Regression
This indicator displays logarithmic regression channels for Bitcoin. A logarithmic regression is a function that increases or decreases rapidly at first, but then steadily slows as time moves. The original version of this indicator/model was created as an open source script by a user called Owain but is not available on TradingView anymore. So I decided to update the code to the latest version of pinescript and fine tune some of the parameters.
How to read and use the logarithmic regression:
There are 3 different regression lines or channels visible:
Green Channel: These lines represent different levels of support derived from the logarithmic regression model.
Purpose: The green channel is used to identify potential support levels where the price might find a bottom or bounce back upwards.
Interpretation:
If the price is approaching or touching the lower green lines, it might indicate a buying opportunity or an area where the price is considered undervalued.
------------------------------------------------
Red Channel: These lines represent different levels of resistance derived from the logarithmic regression model.
Purpose: The red channel is used to identify potential resistance levels where the price might encounter selling pressure or face difficulty moving higher.
Interpretation:
If the price is approaching or touching the upper red lines, it might indicate a selling opportunity or an area where the price is considered overvalued.
-------------------------------------------------
Purple Line This line represents to so-called "fair price" of Bitcoin according to the regression model.
Purpose: The purple line can be used to identify if the current price of Bitcoin is under- or overvalued.
Interpretation: A simple interpretation here would be that over time the price will have the tendency to always return to its "fair price", so starting to DCA more when price is under the line and less when it is over the line could be a suitable investment strategy.
----------------------------------------------------
Practical Application:
You can use this regression channel to build your own, long term, trading strategies. Notice how Bitcoin seems to always act in kind of the same 4 year cycle:
- Price likes to trade around the purple line at the time of the halvings
- After the halvings we see an extended sideways range for up to 300 days
- After the sideways range Bitcoin goes into a bull market frenzy (the area between the green and red channel)
- The price tops out at the upper red channel and then enters a prolonged bear market.
Buying around the purple line or lower line of the green channel and selling once the price reaches the red channel can be a suitable and very profitable strategy.
Bitcoin Logarithmic Growth CurvesThis plots logarithmic curves fitted to major Bitcoin bear market tops & bottoms. Top line is fitted to bull tops, bottom line is fitted to lower areas of the logarithmic price trend (which is not always the same as bear market bottoms). Middle line is the median of the top & bottom, and the faded solid lines are fibonacci levels in between.
Inspired by & based on a Medium post by Harold Christopher Burger, which shows how linear Bitcoin's long-term price growth is when plotted on a double-log chart (log scaling on the price AND time axis).
These curves will only make sense for tickers representing Bitcoin vs. USD (such as BITSTAMP:BTCUSD, BITMEX:XBTUSD, BLX index). Plotting on other assets will probably end up with lines that shoot off into space without any relationship to the underlying price action.
The upper, middle & lower curves can be projected into the future, which can be turned on or off in the indicator settings. The fibonacci levels can also be switched on/off. And the upper & lower curve intercepts & slopes can be tweaked.
I'm releasing this open-source, if you end up making something cool based off of this code, I don't need attribution but please hit me up on here or on twitter (same username) so I can check out what ya made. Thanks, hope y'all enjoy it.
Bitcoin Logarithmic Growth CurvesThis is a version of the Log Growth Curves previously published by Quantadelic. The update includes customizable fib levels and filled upper and lower bands. This script is only intended for the Bitcoin log chart to reflect the channel that can be found on a log/log Bitcoin chart. The projections out from current levels are theoretical path of BTC based on the current trajectory.
In theory, reaching into the bottom zone of this chart is a good zone for accumulation while the top zone is a good are for distribution.
Bitcoin Logarithmic Growth Curves for intraday usersI wish to thank @Quantadelic who created this great indicator and leaving it open for others to improve.
I have made changes to make it user-friendly for the intraday traders.
The changes made have been;
1. Compartmentalized each area of the major Fibonacci level;
2. Added minor Fibonacci levels;
3. Color-coded the support and resistance levels, for better viewing;
4. Zoned each area of the major Fibonacci level; and
5. Created a time-frame display period for quicker loading of the indicator.
I have removed a few things to allow the indicator to run quicker;
1. Future projections; and
2. The major higher levels of the Fibonacci, which may be useful when Bitcoin reaches 100k.
Enjoy
[2020 Updated]Bitcoin Logarithmic Growth CurvesCredit goes to the original writer of the script, Quantadelic, who generously allowed anyone to copy/edit. I adjusted the value of the bottom/top intercept and slope to better fit the March 2020 coronavirus dip.
Use Bitstamp BTCUSD for better reading.
Bitcoin Log Growth Curve OscillatorThis script presents the oscillator version of the Bitcoin Logarithmic Growth Curve 2024 indicator, offering a new perspective on Bitcoin’s long-term price trajectory.
By transforming the original logarithmic growth curve into an oscillator, this version provides a normalized view of price movements within a fixed range, making it easier to identify overbought and oversold conditions.
For a comprehensive explanation of the mathematical derivation, underlying concepts, and overall development of the Bitcoin Logarithmic Growth Curve, we encourage you to explore our primary script, Bitcoin Logarithmic Growth Curve 2024, available here . This foundational script details the regression-based approach used to model Bitcoin’s long-term price evolution.
Normalization Process
The core principle behind this oscillator lies in the normalization of Bitcoin’s price relative to the upper and lower regression boundaries. By applying Min-Max Normalization, we effectively scale the price into a bounded range, facilitating clearer trend analysis. The normalization follows the formula:
normalized price = (upper regresionline − lower regressionline) / (price − lower regressionline)
This transformation ensures that price movements are always mapped within a fixed range, preventing distortions caused by Bitcoin’s exponential long-term growth. Furthermore, this normalization technique has been applied to each of the confidence interval lines, allowing for a structured and systematic approach to analyzing Bitcoin’s historical and projected price behavior.
By representing the logarithmic growth curve in oscillator form, this indicator helps traders and analysts more effectively gauge Bitcoin’s position within its long-term growth trajectory while identifying potential opportunities based on historical price tendencies.
Bitcoin Polynomial Regression ModelThis is the main version of the script. Click here for the Oscillator part of the script.
💡Why this model was created:
One of the key issues with most existing models, including our own Bitcoin Log Growth Curve Model , is that they often fail to realistically account for diminishing returns. As a result, they may present overly optimistic bull cycle targets (hence, we introduced alternative settings in our previous Bitcoin Log Growth Curve Model).
This new model however, has been built from the ground up with a primary focus on incorporating the principle of diminishing returns. It directly responds to this concept, which has been briefly explored here .
📉The theory of diminishing returns:
This theory suggests that as each four-year market cycle unfolds, volatility gradually decreases, leading to more tempered price movements. It also implies that the price increase from one cycle peak to the next will decrease over time as the asset matures. The same pattern applies to cycle lows and the relationship between tops and bottoms. In essence, these price movements are interconnected and should generally follow a consistent pattern. We believe this model provides a more realistic outlook on bull and bear market cycles.
To better understand this theory, the relationships between cycle tops and bottoms are outlined below:https://www.tradingview.com/x/7Hldzsf2/
🔧Creation of the model:
For those interested in how this model was created, the process is explained here. Otherwise, feel free to skip this section.
This model is based on two separate cubic polynomial regression lines. One for the top price trend and another for the bottom. Both follow the general cubic polynomial function:
ax^3 +bx^2 + cx + d.
In this equation, x represents the weekly bar index minus an offset, while a, b, c, and d are determined through polynomial regression analysis. The input (x, y) values used for the polynomial regression analysis are as follows:
Top regression line (x, y) values:
113, 18.6
240, 1004
451, 19128
655, 65502
Bottom regression line (x, y) values:
103, 2.5
267, 211
471, 3193
676, 16255
The values above correspond to historical Bitcoin cycle tops and bottoms, where x is the weekly bar index and y is the weekly closing price of Bitcoin. The best fit is determined using metrics such as R-squared values, residual error analysis, and visual inspection. While the exact details of this evaluation are beyond the scope of this post, the following optimal parameters were found:
Top regression line parameter values:
a: 0.000202798
b: 0.0872922
c: -30.88805
d: 1827.14113
Bottom regression line parameter values:
a: 0.000138314
b: -0.0768236
c: 13.90555
d: -765.8892
📊Polynomial Regression Oscillator:
This publication also includes the oscillator version of the this model which is displayed at the bottom of the screen. The oscillator applies a logarithmic transformation to the price and the regression lines using the formula log10(x) .
The log-transformed price is then normalized using min-max normalization relative to the log-transformed top and bottom regression line with the formula:
normalized price = log(close) - log(bottom regression line) / log(top regression line) - log(bottom regression line)
This transformation results in a price value between 0 and 1 between both the regression lines. The Oscillator version can be found here.
🔍Interpretation of the Model:
In general, the red area represents a caution zone, as historically, the price has often been near its cycle market top within this range. On the other hand, the green area is considered an area of opportunity, as historically, it has corresponded to the market bottom.
The top regression line serves as a signal for the absolute market cycle peak, while the bottom regression line indicates the absolute market cycle bottom.
Additionally, this model provides a predicted range for Bitcoin's future price movements, which can be used to make extrapolated predictions. We will explore this further below.
🔮Future Predictions:
Finally, let's discuss what this model actually predicts for the potential upcoming market cycle top and the corresponding market cycle bottom. In our previous post here , a cycle interval analysis was performed to predict a likely time window for the next cycle top and bottom:
In the image, it is predicted that the next top-to-top cycle interval will be 208 weeks, which translates to November 3rd, 2025. It is also predicted that the bottom-to-top cycle interval will be 152 weeks, which corresponds to October 13th, 2025. On the macro level, these two dates align quite well. For our prediction, we take the average of these two dates: October 24th 2025. This will be our target date for the bull cycle top.
Now, let's do the same for the upcoming cycle bottom. The bottom-to-bottom cycle interval is predicted to be 205 weeks, which translates to October 19th, 2026, and the top-to-bottom cycle interval is predicted to be 259 weeks, which corresponds to October 26th, 2026. We then take the average of these two dates, predicting a bear cycle bottom date target of October 19th, 2026.
Now that we have our predicted top and bottom cycle date targets, we can simply reference these two dates to our model, giving us the Bitcoin top price prediction in the range of 152,000 in Q4 2025 and a subsequent bottom price prediction in the range of 46,500 in Q4 2026.
For those interested in understanding what this specifically means for the predicted diminishing return top and bottom cycle values, the image below displays these predicted values. The new values are highlighted in yellow:
And of course, keep in mind that these targets are just rough estimates. While we've done our best to estimate these targets through a data-driven approach, markets will always remain unpredictable in nature. What are your targets? Feel free to share them in the comment section below.
Bitcoin Polynomial Regression OscillatorThis is the oscillator version of the script. Click here for the other part of the script.
💡Why this model was created:
One of the key issues with most existing models, including our own Bitcoin Log Growth Curve Model , is that they often fail to realistically account for diminishing returns. As a result, they may present overly optimistic bull cycle targets (hence, we introduced alternative settings in our previous Bitcoin Log Growth Curve Model).
This new model however, has been built from the ground up with a primary focus on incorporating the principle of diminishing returns. It directly responds to this concept, which has been briefly explored here .
📉The theory of diminishing returns:
This theory suggests that as each four-year market cycle unfolds, volatility gradually decreases, leading to more tempered price movements. It also implies that the price increase from one cycle peak to the next will decrease over time as the asset matures. The same pattern applies to cycle lows and the relationship between tops and bottoms. In essence, these price movements are interconnected and should generally follow a consistent pattern. We believe this model provides a more realistic outlook on bull and bear market cycles.
To better understand this theory, the relationships between cycle tops and bottoms are outlined below:https://www.tradingview.com/x/7Hldzsf2/
🔧Creation of the model:
For those interested in how this model was created, the process is explained here. Otherwise, feel free to skip this section.
This model is based on two separate cubic polynomial regression lines. One for the top price trend and another for the bottom. Both follow the general cubic polynomial function:
ax^3 +bx^2 + cx + d.
In this equation, x represents the weekly bar index minus an offset, while a, b, c, and d are determined through polynomial regression analysis. The input (x, y) values used for the polynomial regression analysis are as follows:
Top regression line (x, y) values:
113, 18.6
240, 1004
451, 19128
655, 65502
Bottom regression line (x, y) values:
103, 2.5
267, 211
471, 3193
676, 16255
The values above correspond to historical Bitcoin cycle tops and bottoms, where x is the weekly bar index and y is the weekly closing price of Bitcoin. The best fit is determined using metrics such as R-squared values, residual error analysis, and visual inspection. While the exact details of this evaluation are beyond the scope of this post, the following optimal parameters were found:
Top regression line parameter values:
a: 0.000202798
b: 0.0872922
c: -30.88805
d: 1827.14113
Bottom regression line parameter values:
a: 0.000138314
b: -0.0768236
c: 13.90555
d: -765.8892
📊Polynomial Regression Oscillator:
This publication also includes the oscillator version of the this model which is displayed at the bottom of the screen. The oscillator applies a logarithmic transformation to the price and the regression lines using the formula log10(x) .
The log-transformed price is then normalized using min-max normalization relative to the log-transformed top and bottom regression line with the formula:
normalized price = log(close) - log(bottom regression line) / log(top regression line) - log(bottom regression line)
This transformation results in a price value between 0 and 1 between both the regression lines.
🔍Interpretation of the Model:
In general, the red area represents a caution zone, as historically, the price has often been near its cycle market top within this range. On the other hand, the green area is considered an area of opportunity, as historically, it has corresponded to the market bottom.
The top regression line serves as a signal for the absolute market cycle peak, while the bottom regression line indicates the absolute market cycle bottom.
Additionally, this model provides a predicted range for Bitcoin's future price movements, which can be used to make extrapolated predictions. We will explore this further below.
🔮Future Predictions:
Finally, let's discuss what this model actually predicts for the potential upcoming market cycle top and the corresponding market cycle bottom. In our previous post here , a cycle interval analysis was performed to predict a likely time window for the next cycle top and bottom:
In the image, it is predicted that the next top-to-top cycle interval will be 208 weeks, which translates to November 3rd, 2025. It is also predicted that the bottom-to-top cycle interval will be 152 weeks, which corresponds to October 13th, 2025. On the macro level, these two dates align quite well. For our prediction, we take the average of these two dates: October 24th 2025. This will be our target date for the bull cycle top.
Now, let's do the same for the upcoming cycle bottom. The bottom-to-bottom cycle interval is predicted to be 205 weeks, which translates to October 19th, 2026, and the top-to-bottom cycle interval is predicted to be 259 weeks, which corresponds to October 26th, 2026. We then take the average of these two dates, predicting a bear cycle bottom date target of October 19th, 2026.
Now that we have our predicted top and bottom cycle date targets, we can simply reference these two dates to our model, giving us the Bitcoin top price prediction in the range of 152,000 in Q4 2025 and a subsequent bottom price prediction in the range of 46,500 in Q4 2026.
For those interested in understanding what this specifically means for the predicted diminishing return top and bottom cycle values, the image below displays these predicted values. The new values are highlighted in yellow:
And of course, keep in mind that these targets are just rough estimates. While we've done our best to estimate these targets through a data-driven approach, markets will always remain unpredictable in nature. What are your targets? Feel free to share them in the comment section below.
Bitcoin Risk Long Term indicatorOBJECTIVE:
The purpose of this indicator is to synthesize via an average several indicators from a wide choice with in order to simplify the reading of the bitcoin price and that on a long term vision.
Useful for those who want to see things simply, typically to make a smart DCA based on risk.
I originally used this script as a sandbox to understand and test the usefulness of several indicators, and to develop my PineScript skills, but finally the Risk Indicator output seems relevant so I decided to share it.
USAGE:
The selected indicators are the ones that I think give the best market bottoms, but the idea here is that anyone can try and use any set of indicators based on those preferences (post in comments if you find a relevant config)
Most of the indicator inputs are configurable. And some are not taken into account in the calculation of the Risk indicator because I consider them not relevant, this script is also a test more than a final version.
NOTES :
If you have any idea of adding an indicator, modification, criticism, bug found: share them, it is appreciated!
In the future I will create another more versatile Risk indicator that will not be focused on bitcoin in weekly. (this indicator is still usable on other assets and timeframe)
THANKS:
to Benjamin Cowen for inspiring me with his Bitcoin Risk metric
to Lazybear for his Wavetrend Indicator and all the scripts he shares
to Mabonyi for his Bitcoin Logarithmic Growth Curves & Zones script
to VuManChu for his VMC Cypher B Divergence
to the Trading view team for developing TV and PineScript
And to all the community for all the published codes that allowed me to progress and create this script
---- FR ----
OBJECTIF :
L'objectif de cet indicateur est de synthétiser via une moyenne plusieurs indicateurs parmi un large choix avec afin de simplifier la lecture du cours de bitcoin et cela sur une vision longue terme.
Utile pour ceux qui veulent voir les choses simplement, typiquement faire un DCA intelligent en fonction du risque.
À la base j'ai utilisé ce script comme un bac à sable pour comprendre puis tester l'utilité de plusieurs indicateurs, et développer mes compétences PineScript, mais finalement l'output Risk Indicateur me semble pertinent donc autant le partager.
UTILISATION :
Les indicateurs sélectionnés sont ceux qui permettent selon moi d'avoir les meilleurs point bas de marché, mais l'idée ici est que chacun puisse essayer et utiliser n'importe quel ensemble d'indicateur en fonction de ces préférences (poster en commentaire si vous trouvez une configuration pertinente)
La plupart des inputs indicateurs sont paramétrables. Et certains ne sont pas pris en compte dans le calcul du Risk indicateur car je les estime non pertinent, ce script est aussi un essai plus qu'une version finale.
NOTES :
Si vous avez la moindre idée d'ajout d'indicateur, modification, critique, bug trouvé : partagez-les, c'est apprécié !
à l'avenir je créerais un autre Risk indicator plus polyvalent qui ne sera pas focalisé sur bitcoin en weekly. (cet indicateur est tout de même utilisable sur d'autre actif et timeframe)
REMERCIEMENT :
à Benjamin Cowen pour m'avoir inspiré avec son Bitcoin Risk metric
à Lazybear pour son Wavetrend Indicator et globalement tout les scripts qu'il partage
à Mabonyi pour son script Bitcoin Logarithmic Growth Curves & Zones
à VuManChu pour son VMC Cypher B Divergence
à l'équipe Trading view pour avoir développé TV et PineScript
Et à toute la communauté pour tous les codes publiés qui m'ont permis de progresser et de créer ce script
Logarithmic Regression (Weekly)This script is a combination of different logarithmic regression fits on weekly BTC data. It is meant to be used only on the weekly timeframe and on the BLX chart for bitcoin. The "fair value" line is still subjective, as it is only a regression and does not take into account other metrics.
My BTC log curveLogarithmic regression of the USD price of Bitcoin , calculated according to the equation:
y=A*exp(beta*x^lambda + c) + m*x + b
where x is the number of days since the genesis block. All parameters are editable in the script options.
Moving Average BandsUse this script to find buy and sell zones for BTC based on momentum of the move relative to the average asset price over a given period. The script plots a series of offset bands above and below the Simple Moving Average. When price crosses another band further from the SMA, the background is rendered brighter. The brighter the background, the stronger the buy and sell signal is, as the expectation is that price wants to return to the SMA. Settings are adjustable to fine tune to various time frames and assets. Good settings for BTC Daily are length 30, layers at 10, 20, 30, and 40.
On 1H BTC/USD I use length 200, layers at 5, 10, 15, 20 to find decent swing trading opportunities.
On BTC/USD 1D chart, combine with Bitcoin Logarithmic Growth Curve from @mabonyi (original by @quantadelic )for confluence of very reliable signals.