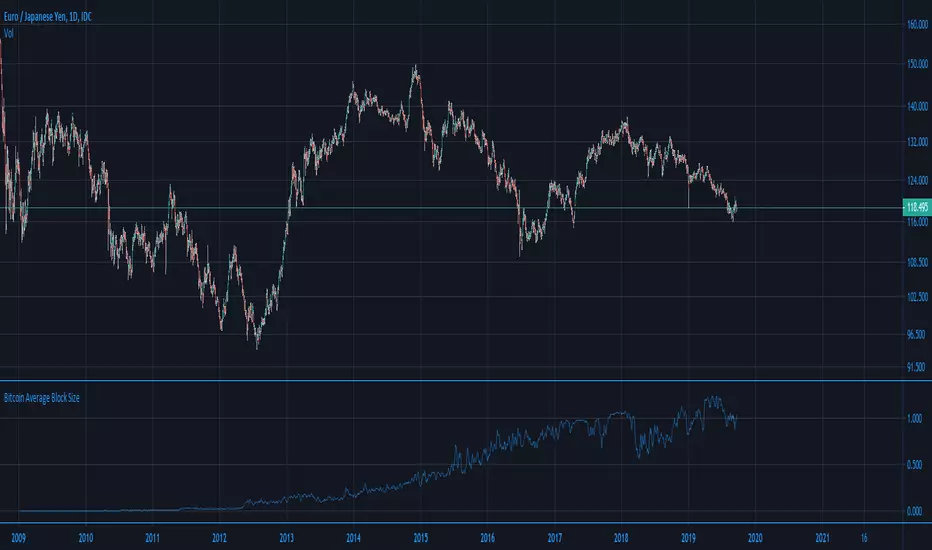
Ori Bitcoin Average Block SizeThis indicator shows Bitcoin Average Block Size . Have options to toggle line/trend view, log on/off and smoothing for line view.
Cerca negli script per "bitcoin"
Ori Bitcoin Cost Per TransactionThis indicator shows Bitcoin Cost Per Transaction . Have options to toggle line/trend view, log on/off and smoothing for line view.

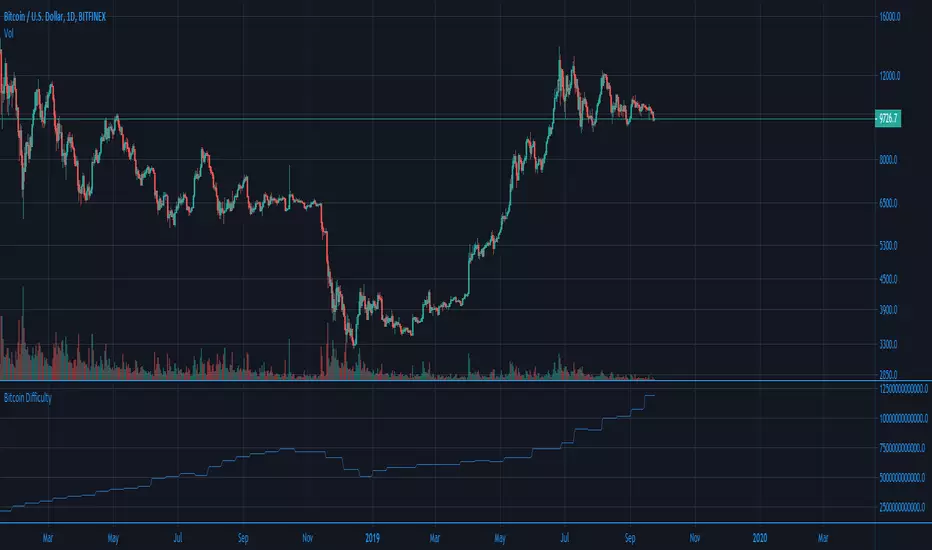
Ori Bitcoin DifficultyThis indicator shows Bitcoin Mining Difficulty. Have options to toggle line/trend view, log on/off and smoothing for line view.


ABV Scalper - Free Bitcoin Scalper IndicatorExcited to bring you this totally free to use indicator to be used as a scalper for Bitcoin!
You are required to use the following:
Use with Bitfinex charts
Use Heiken Ashi candles
Use the 30m timeframe
UTC time setting
This indicator does not take new entries on weekends given lower volatility in the market. However, if it enters a trade it will manage the position over the weekend for Stop Loss and Take Profit logic.
This indicator is setup to be fully automated!
If you love this indicator and the work we put behind it - please give it a like and share it with your network!

Bitmex Bitcoin BasisInspired by the Ugly Old Goat's articles about the Bitcoin basis - medium.com
with the help of @Plumptoiletduck this indicator was created to show the Bitmex futures premium or discount.
Note you need to add in the new futures ticker every 3 months.

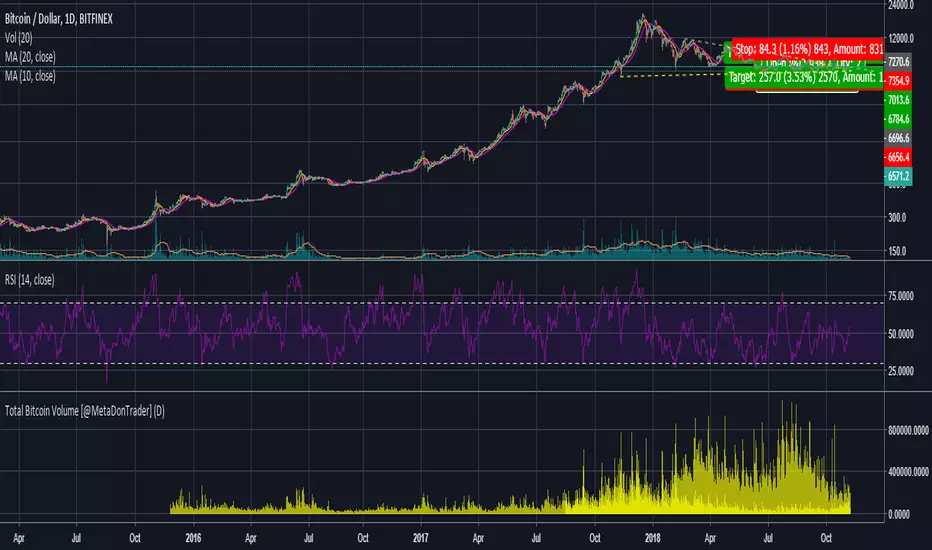
Total Bitcoin Volume [@MetaDonTrader]Aggregates all the bitcoin volume from different exchanges. Note that new exchanges like Binance and Bitmex will have an affect on this data as well. Who's to say how much of it is legit and how much is wash trading.
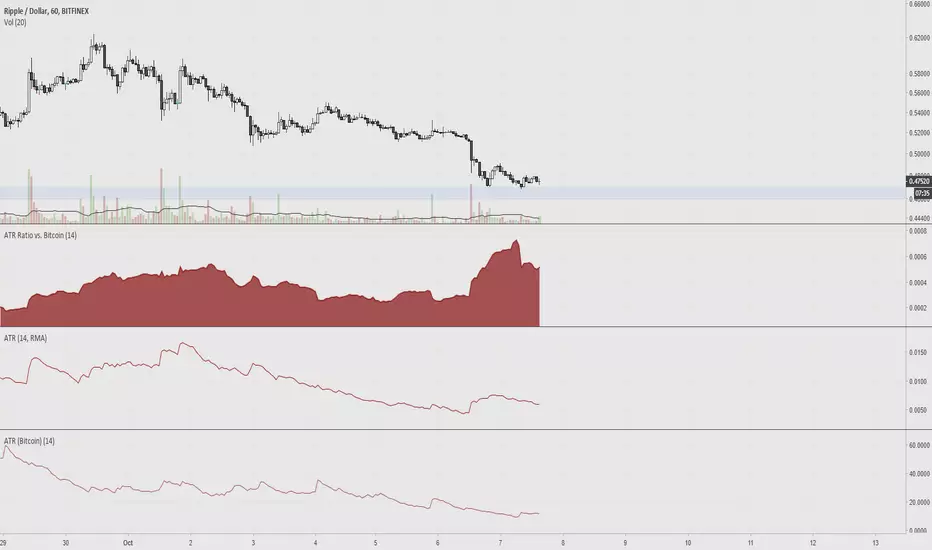
ATR Ratio vs. BitcoinAverage True Range is used to determine if a ticker's trading range is widening or narrowing, which is helpful for finding the trend or to use as a stop loss. The idea of this indicator is to compare the ATR of altcoins versus bitcoin, since volatility is low.
SSABU Bitcoin Long Short Line
✅ an indicator requested by acquiantance
This is an indicator that allows you to see Bitcoin chart with long and short at the same time.
Green line is long. Red line represents short
✅ 지인 요청지표
비트차트와 함께 롱, 숏 차트를 볼 수 있는 지표 입니다.
초록색이 Long 빨간색이 Short.
※ 기존의 차트에 대비하여 롱, 숏 차트의 선행적인 움직임을 통해서 비트의 움직임을 예상 하는 보조지표

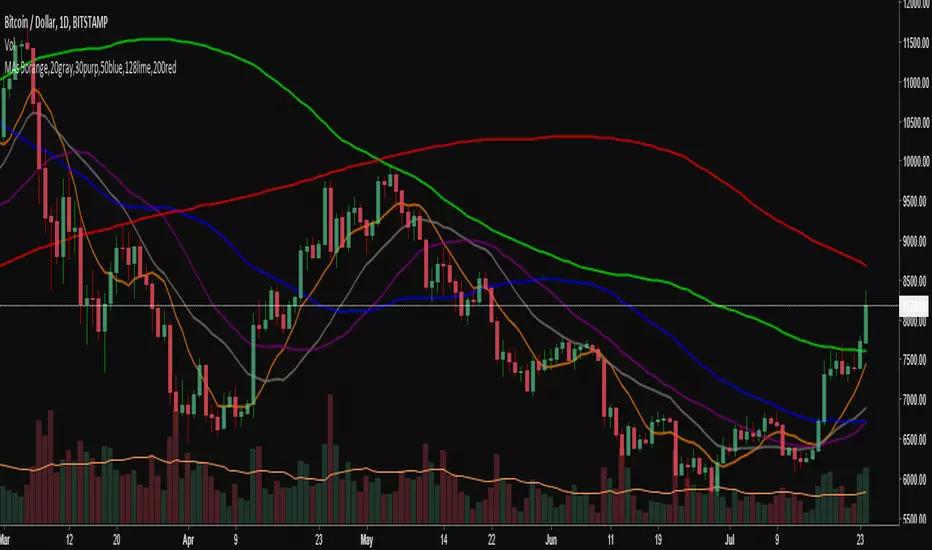
6 Simple Moving Averages 9,20,30,50,128,200 (bitcoin tested)I've condensed my SMAs down to these 6 and have found them to be most useful for Bitcoin, which is what I trade the most. They all have played their roll in acting as support and resistance and making decisions with the 30 period probably the least relevant, but relevant nonetheless. There is the option to change to exponential if desired.

Modified Fisher Strategy Alerts BitcoinAlerts for strategy using Fisher transform with modification and implemented into Bitcoin trading perspective

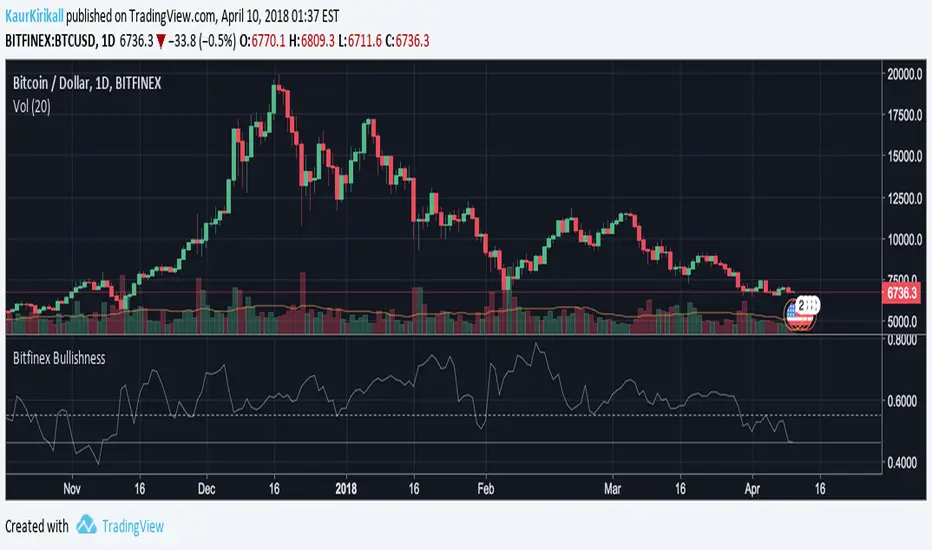
Bitfinex Bitcoin BullishnessBased on contrary opinion in futures, I've adjusted this to Bitcoin, more thoroughly Bitfinex margin longs & shorts. Those unfamiliar with the concept, contrary opinion illustrates the psychological sentiment in the market by determining the degree of bullishness or bearishness among participants in the market.
The principle holds that when the majority of people agree on anything, they are generally wrong, so following the principle you would analyse and look to take the other side of the trades.
Consider this, once the market is extremely bullish, all bulls have already entered the market to an extent that one can't commit any more funds to the position. Even though Bitfinex margin positions are not like future trading, that every short must have someone taking the long side, one should understand that the majority of people do not make money on the market, so whenever this indicator goes too low or too high, one should look for a trend reversal.
This indicator is in the range of 0 to 1 and the neutral position for a "healthy" market is 0.55ish. Some adjustments should probably be made according to the cryptocurrency markets and I might add this in the future updates, but as of now it's a good indicator for forecasts and to get a bigger picture on a timeframe of 1 DAY or longer charts.
The base of the indicator is simple, amount of longs divided by the sum of shorts and longs.
Also you can see, how only now, 10th of April, we are hitting new lows in the bearishness of the market.
[Bitcoin] Spot price vs Futures indicatorA handy script to detect opportunities in the futures market during extreme movement.
During rallies, futures usually tend to be US$10 above spot price, on the other hand it can be $1 below spot price when the price starts to decline.
You could also draw a trendline to it :) measuring the amount of risk people are willing to take just to predict future prices in the rally/decline.
Credits to lowstrife for the idea, I'm just implementing it :)

LIB: Puell MultipleIndicator Overview
This metric looks at the supply side of Bitcoin's economy - bitcoin miners and their revenue.
It explores market cycles from a mining revenue perspective. Bitcoin miners are sometimes referred to as compulsory sellers due to their need to cover fixed costs of mining hardware in a market where price is extremely volatile. The revenue they generate can therefore influence price over time.
The Puell Multiple is calculated by dividing the daily issuance value of bitcoins (in USD) by the 365-day moving average of daily issuance value.
How It Can Be Used
There are periods of time where the value of bitcoins being mined and entering the ecosystem is too great or too little relative to historical norms.
Understanding these periods of time can be beneficial to the strategic Bitcoin investor.
The chart above highlights periods where the value of Bitcoin's issued on a daily basis has historically been extremely low (Puell Multiple entering green box), which was a good time to buy Bitcoin. It also shows periods where the daily issuance value was extremely high (Puell Multiple entering red box), historically a good time to sell Bitcoin.

LIB: Pi Cycle Top IndicatorIndicator Overview
The Pi Cycle Top Indicator has historically been effective in picking out the timing of market cycle highs to within 3 days.
It uses the 111 day moving average (111DMA) and a newly created multiple of the 350 day moving average, the 350DMA x 2.
Note: The multiple is of the price values of the 350DMA not the number of days.
For the past three market cycles, when the 111DMA moves up and crosses the 350DMA x 2 we see that it coincides with the price of Bitcoin peaking.
It is also interesting to note that 350 / 111 is 3.153, which is very close to Pi = 3.142. In fact, it is the closest we can get to Pi when dividing 350 by another whole number.
It once again demonstrates the cyclical nature of Bitcoin price action over long time frames. Though in this instance it does so with a high degree of accuracy over the past 7 years.
How It Can Be Used
Pi Cycle Top is useful to indicate when the market is very overheated. So overheated that the shorter term moving average of the 111day moving average has reached a x2 multiple of the 350 day moving average. Historically this has been a very good time to sell Bitcoin.
Created By
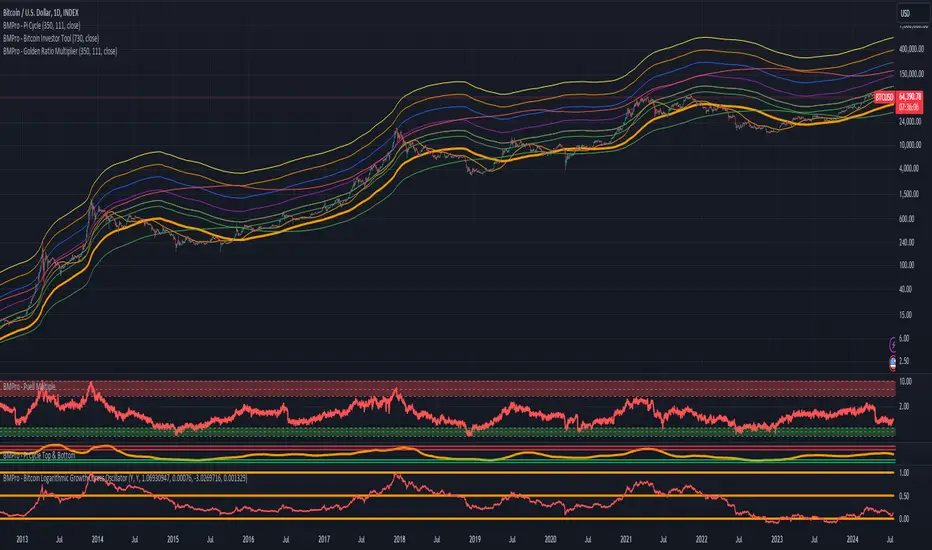
LIB: Golden Ratio MultiplierIndicator Overview
The Golden Ratio Multiplier explores Bitcoin's adoption curve and market cycles to understand how price may behave on medium to long term time frames.
To do this it uses multiples of the 350 day moving average (350DMA) of Bitcoin's price to identify areas of potential resistance to price movements. Note: multiples are of the 350DMA's price values rather than its number of days.
The multiples reference the Golden Ratio (1.6) and the Fibonacci sequence (0, 1, 1, 2, 3, 5, 8, 13, 21). These are important mathematical numbers.
These specific multiplications of the 350DMA have been very effective over time at picking out intracycle highs for Bitcoin price and also the major market cycle highs.
As Bitcoin becomes adopted over time, it's market cycle highs hit decreasing Fibonacci sequence multiples of the 350DMA. This is because the explosive growth of Bitcoin on a logarithmic scale is slowing over time. As it's market cap increases it becomes more difficult for the same growth rates to continue.
If this decreasing Fibonacci sequence pattern continues to play out as it has done over the course of the past 9 years, then the next market cycle high will be when price is in the area of the 350DMA x3.
The Golden Ratio Multiplier is an effective tool because it is able to demonstrate when the market is likely overstretched within the context of Bitcoin's adoption curve growth and market cycles.

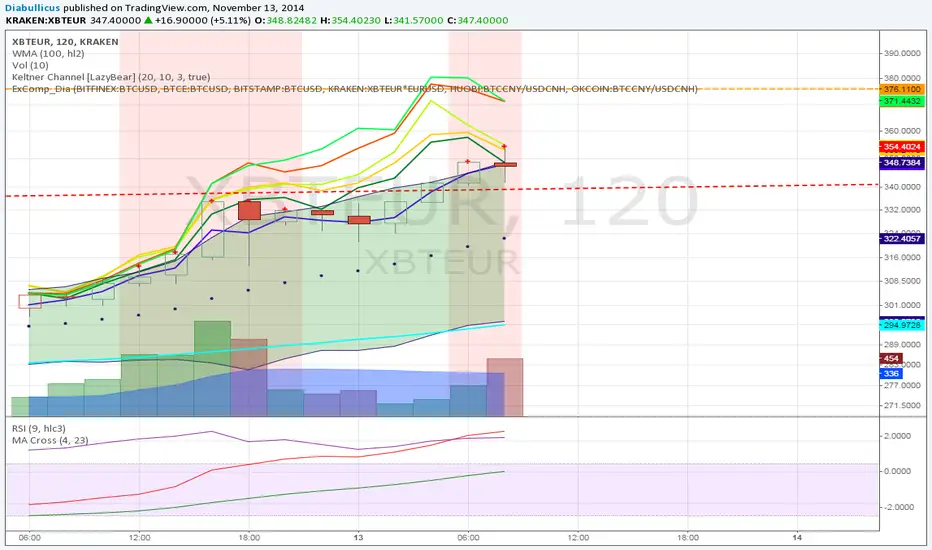
Exchange Comparison [Diabolicus]This script helps you compare bitcoin prices across different currency pairs and exchanges. Quickly judge at a glance if "your" exhange currently trades above or below the rest of the market.
Each colored line represents an exchange pair of your choice. Exchange pairs must be entered normalized to USD, so for BTCEUR or XBTEUR multiply by EURUSD, for BTCCNY divide by USDCNH respectively.