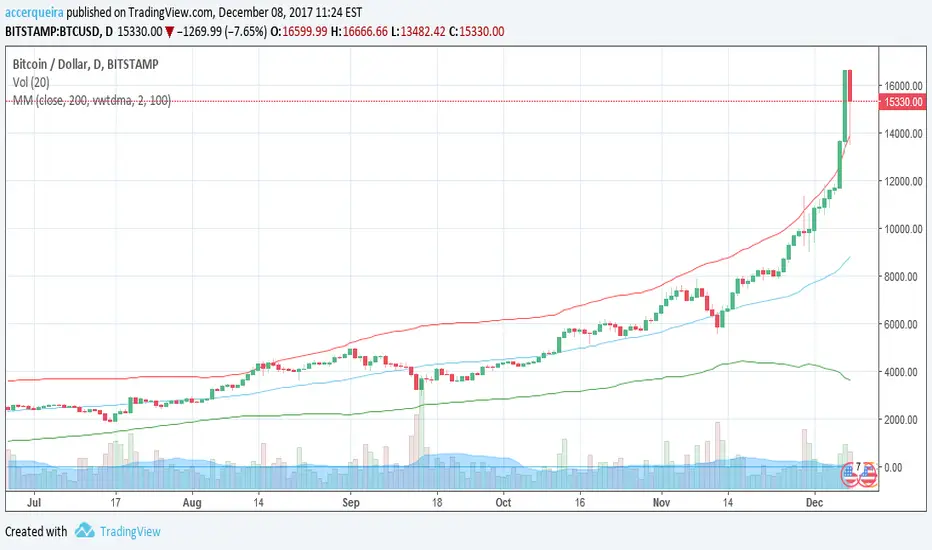
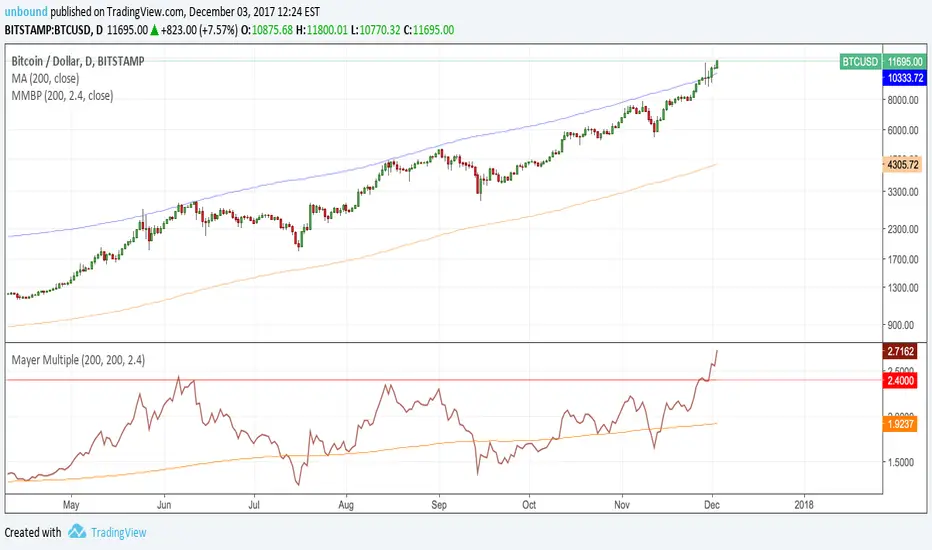
MayerMultiple Price BBThis charts an indicator created by Trace Mayer with some extras.
Plots:
- Mayer Multiple (may be hard to notice, since it overlays by default and stay at the bottom...)
- Price adjusted by Mayer Multiple Average with Bollinger Bands
Moving Average Function can be selected from a list with standard functions and following experimental extras:
- Volume Weighted Exponential Moving Average
- Volume Weighted Time Decayed Moving Average // similar to vwema, but alpha is calculated from length as half-life decay function (not sure if I got that right...)
Default MA function is sma, to keep it true to the original MM indicator, but I think VWEMA and VWTDMA may perform better with exponential nature of Bitcoin .
Suggestions and bug reports are welcome =)
Cerca negli script per "bitcoin"
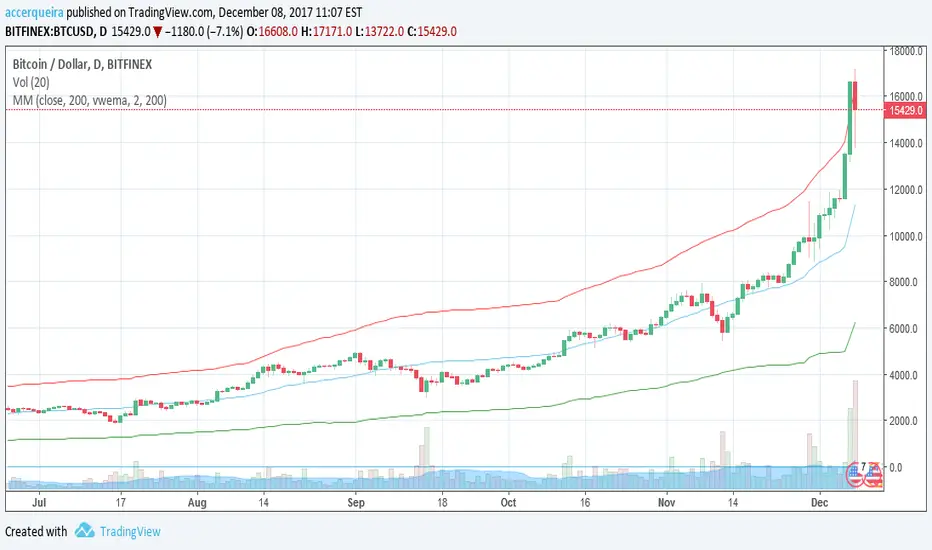
MayerMultiple Price BBThis charts an indicator created by Trace Mayer with some extras.
Plots:
- Mayer Multiple
- Price adjusted by Mayer Multiple Average with Bollinger Bands
Moving Average Function can be selected from a list with standard functions and following experimental extras:
- Volume Weighted Exponential Moving Average
- Volume Weighted Time Decayed Moving Average // similar to vwema, but alpha is calculated from length as half-life decay function (not sure if I got that right...)
Default MA function is sma, to keep it true to the original MM indicator, but I think VWEMA and VWTDMA may perform better with exponential nature of Bitcoin .
Suggestions and bug reports are welcome =)
Mayer MultipleFollowing Preston Pysh's "Bitcoin Mayer Multiple" study, I made this simple script to plot the Mayer multiple by calculating the ratio between bitcoin price and its 200-day moving average. It also plots the moving average of ratio itself.
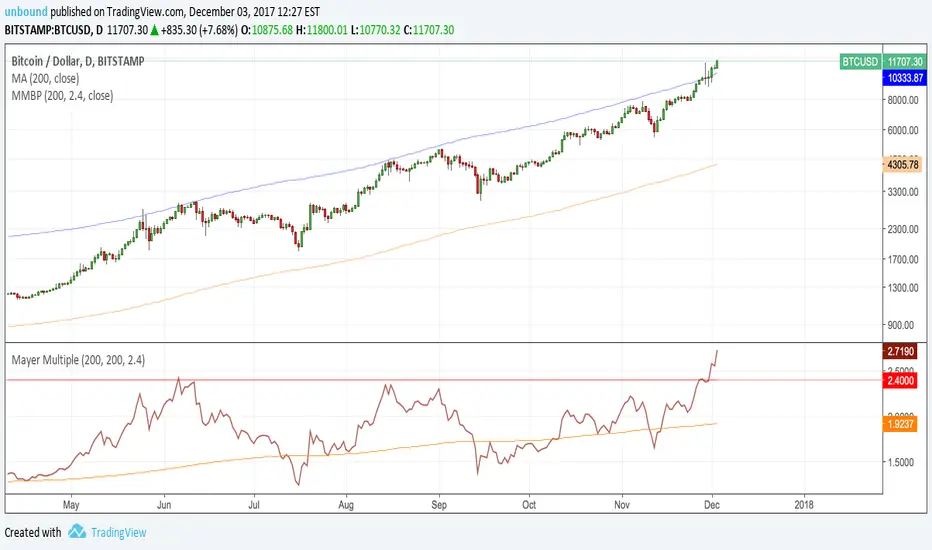
Mayer Multiple Buy PriceFollowing Preston Pysh's "Bitcoin Mayer Multiple" study, I made this simple script to plot the recommended buy price based on the calculated 2.4x ratio between bitcoin price and its 200-day moving average. The ratio and SMA length have default values of 2.4 and 200 and can be adjusted.
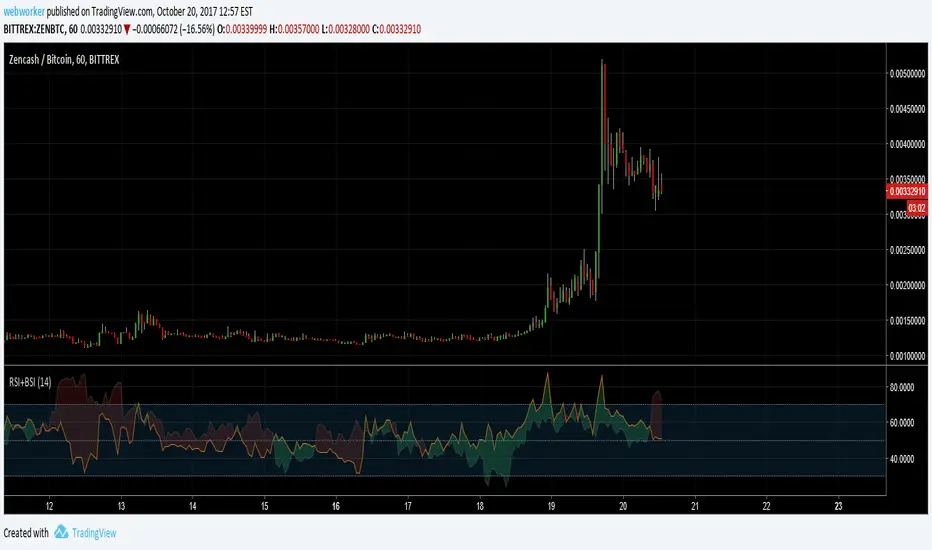
RSI+BSIThis script simply plots the current instruments RSI as well as Bitcoin's RSI from bitfinex. Helpful to identify when an alt is performing stronger than BTC or if BTC is dragging the alt down.
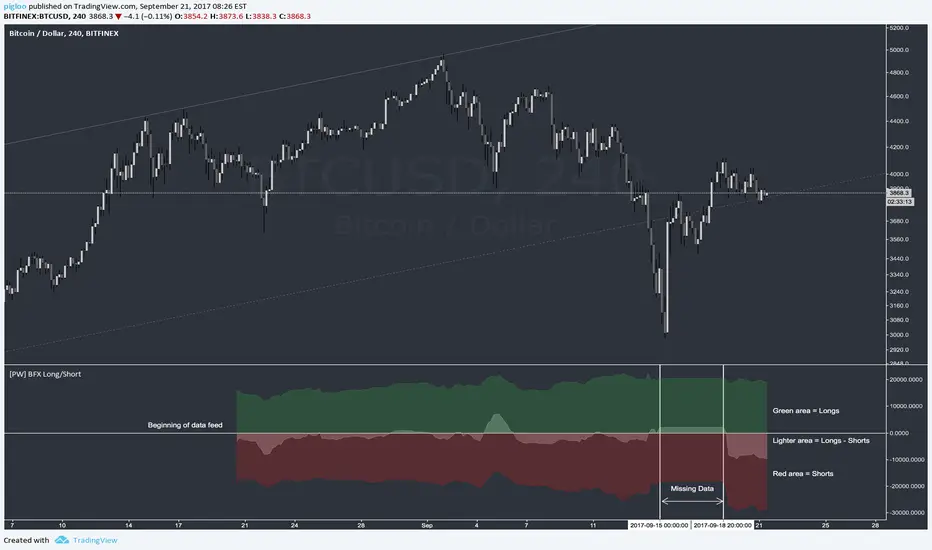
BFXLS - BitFinex Long/Shorts
Small improvement upon the above script - all credit should really go to pigloo
Auto-detects ticker and automatically loads the long/shorts for it - so works on more than just BTC
Note - only works on BitFinex and only works for tickers which have long and short data available!
Green area = Longs
Red area = Shorts
Lighter area = Longs - Shorts

Bitfinex Bitcoin Short/Long PercentageShows the percentage of longs vs shorts. Red area means more shorts than longs and the other way around.
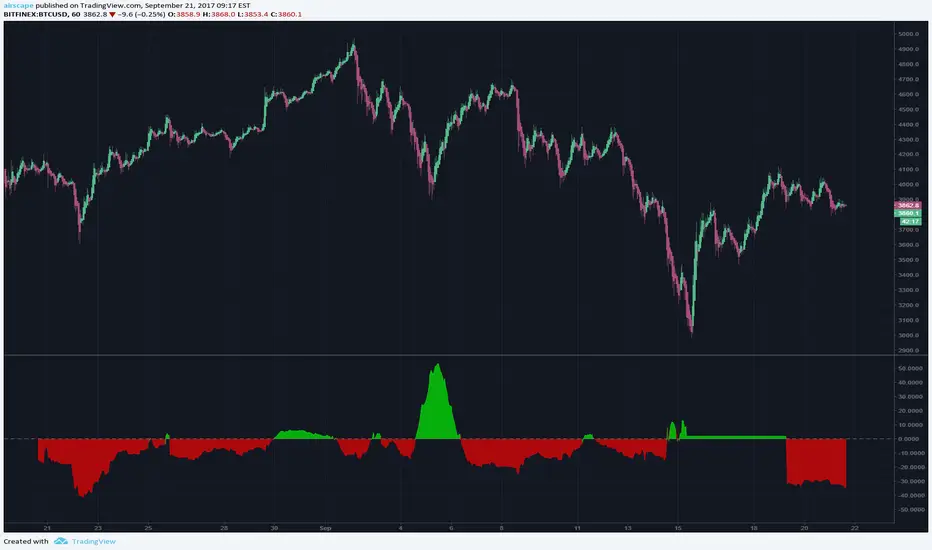
Bitfinex (BFX) - Longs and Shorts for BitcoinGreen area = Longs
Red area = Shorts
Lighter area = Longs - Shorts
The data only started recently which is why there is not much history, also I have marked a period of missing data between the vertical lines.
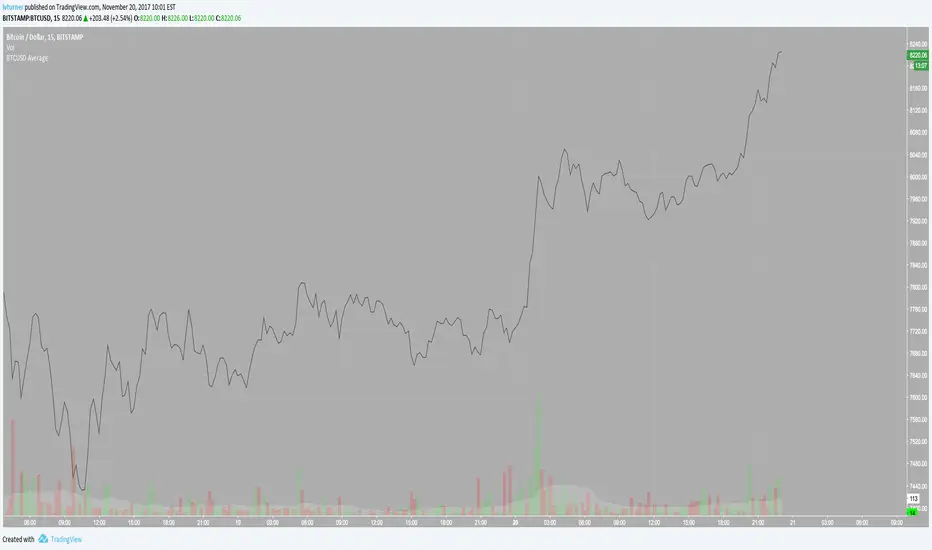
Volume Conversion IndicatorVolume Conversion Indicator
The volume conversion indicator is much like the in-built volume indicator. This particular volume indicator allows you to find out how much of something has been traded in a given timeframe.
This is done by multiplying volume by the average price at that point.
What does this mean?
Well, say, for example, you were watching DGB/BTC (DigiByte/Bitcoin). Instead of the volume being displayed in the amount of DGB traded, the amount of BTC traded is displayed instead.
Feel free to comment... Hope this helps :D

WhenWasThePriceAction
Bars of largest range (volatility)
* see moments of strongest price action immediately
* colored & upDown by candle color
* amplifier: you see only the bull runs, and subsequent dumps
Very nice on the 5 years scale of BITSTAMP:BTCUSD - nothing comparable to 2013 has happened yet.
Internals:
squared_range = pow(high-low, 2)
That is essentially it already. The rest are details:
* gauge with (in case of Bitcoin exponentially rising) price
* show in red for negative candles
* take even higher polynomial (than 2) to show only the very largest values
* allow some user input (but there is not much more that can be chosen here.)
Sorry for such a simple formula - but sometimes the easiest things are powerful.
Please give feedback. www.tradingview.com and/or in the cryptocurrency chat. Thanks.

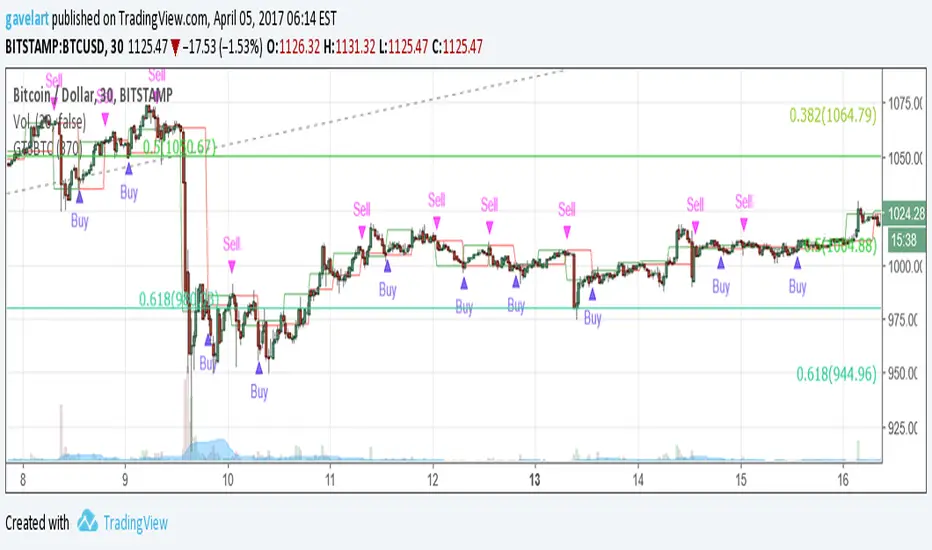
Alert GetTrendStrategy BTCUSDAlerta para la estrategia "GetTrendStrategy 370 30 min" optimizada para Bitcoin
Puedes programar alarmas para que envié mensajes al móvil o al correo electrónico. Para ello observa la siguiente imagen:
mejorestraders.ml
Pip Foundry - BitMEX BVOL7D IndexMy premium indicators are available for monthly lease at www.tradingview.com
A quick indicator in response to the product released this month from BitMEX - a Weekly settled volatility index for bitcoin!
www.bitmex.com
uses BVOL calculation from www.bitmex.com

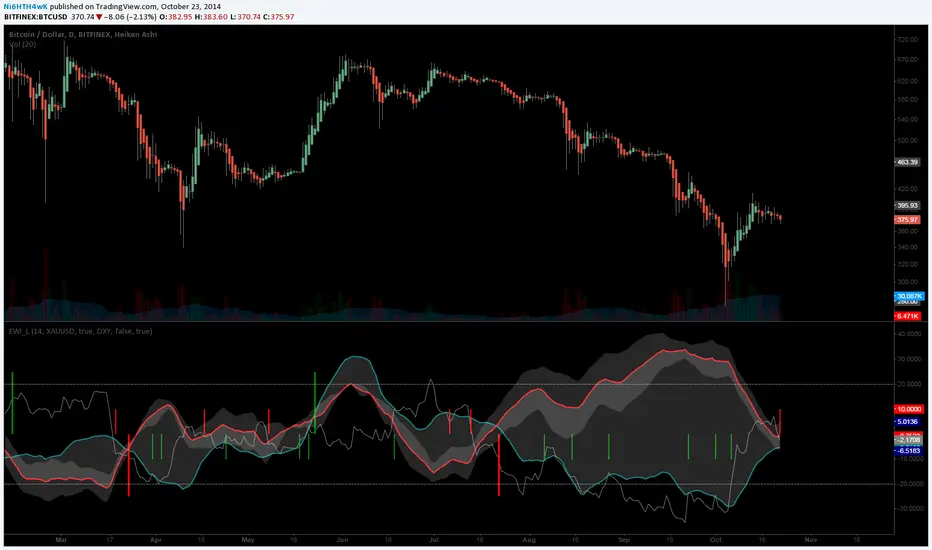
[LAVA] Early Warning IndicatorCombined the RSI inverse of gold to USD with the Dollar index (or whatever stock symbol that may be inverted/complementary) with another asset/currency, like bitcoin, you can basically be well informed when a potential move is on the horizon. Settings allow for inverse settings and de-combining the two pairs as well as a nice cloud look if all the lines get annoying.
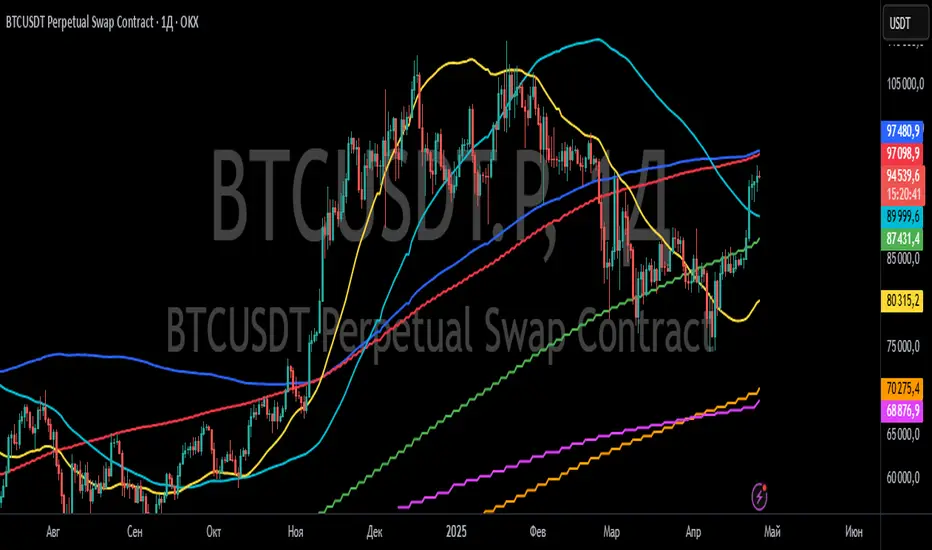
Event-Based Multi MA v1.1📈 Event-Based Multi MA v1.1 — Smart Trading with Dynamic MA Updates
Overview
In a world where most moving averages blindly follow every candle, Event-Based Multi MA v1.1 introduces a smarter logic:
➡️ Update moving averages only when significant price movements occur.
Forget the noise. Focus on what's important.
This indicator recalculates your moving averages only after meaningful price shifts, allowing you to spot true trends and avoid market whipsaws.
Key Features
✅ Event-Driven Logic
Set events based on:
Points: Absolute price change
Percent: Relative price movement
ATR: Volatility-adjusted dynamic movement
✅ Seven Fully Customizable Moving Averages (MA1–MA7)
Each MA offers:
Custom timeframe
Selection of types (EMA, SMA, WMA, VWMA, HMA, LSMA, DEMA, TEMA, ALMA, RMA)
Adjustable lengths and colors
✅ Reduced Market Noise
MAs adjust only after important price actions — cutting down lag and false signals.
✅ Multi-Timeframe Analysis
You can blend moving averages from different timeframes (e.g., 15m, 1H, Daily) into a single chart — perfect for professional multi-frame strategy building.
Settings Explained
Event Trigger Type: Select Points, Percent, or ATR-based movement.
Event Threshold: The amount of price movement needed to trigger a new calculation.
ATR Length: If ATR mode is selected, this controls the sensitivity.
Each Moving Average (MA1 to MA7) has:
MA Type: Choose the smoothing method that suits your trading style.
Length: The number of bars used in the calculation.
Color: Customize visual styling.
Timeframe: Load MAs from different timeframes into your current chart.
How to Use It in Trading
🔹 Trend Confirmation
Wait for event-triggered updates. Fresh MAs after a significant move are much stronger signals than constantly refreshing MAs.
🔹 Momentum Breakouts
Combine short-term (e.g., MA1, MA2) and long-term (e.g., MA5, MA6) MAs. When short-term MAs cross above/below long-term after an event, it's a powerful breakout cue.
🔹 Dynamic Support/Resistance
Use slow-moving MAs like 100-200 length across different timeframes.
The event-based recalculation keeps them relevant to recent major price moves.
🔹 Volatility Filters
Switch to ATR-based events to adapt moving average updates during volatile periods and calm markets.
Why It Beats Traditional Moving Averages
🚀 No More Overfitting to Every Candle
You focus only on impactful price changes.
🚀 Multi-Timeframe Flexibility
Blend micro and macro views seamlessly in one chart.
🚀 Cleaner Signals, Less Noise
Event-triggered recalculations filter out useless minor price wobbles.
🚀 Customization Beyond Standard MAs
TEMA, HMA, ALMA, DEMA, VWMA — all included for ultra-fine-tuned strategies.
✨ Ready to Upgrade Your Trading?
Forget the old, slow MAs.
Use intelligence. Trade events, not noise.
→ Add Event-Based Multi MA v1.1 to your chart and experience true precision!
Realized PriceBitcoin Realized Price is a metric that determines the value of all bitcoins in circulation by dividing the total purchase price by the number of bitcoins. This provides traders with the average cost basis for all bitcoins in circulation, which is also known as Realized Price.
Unlike the current Market Price that reflects the current value of CRYPTOCAP:BTC , Realized Price shows the average purchase price of all bitcoins in circulation. It is essential to note that Realized Price values each UTXO based on the value when it last moved from one wallet to another, assuming that the movement represents the purchase of the bitcoins.
The significance of Bitcoin Realized Price lies in its ability to provide traders with an overall economic perspective of the Bitcoin market. When the CRYPTOCAP:BTC Market Price exceeds the Realized Price, the market participants are making a profit on average. Conversely, when the CRYPTOCAP:BTC Market Price is lower than the Realized Price, traders are incurring paper losses on average.
It's worth noting that Realized Price is a modification of Realized Cap, created in 2018 by Antoine Le Calvez.
In addition to BTC I have added LTC and ETH
NB!
Script is history data depended - use on charts with most history data
BTC -> BNC:BLX
ETH -> BITSTAMP:ETHUSD
LTC -> BITFINEX:LTCUSD
it plots realized price and its deviation - when price break out from these bands it explodes hard - near the realized price is good to accumulate the coin - it is fair price
Examples
BTC
ETH
LTC
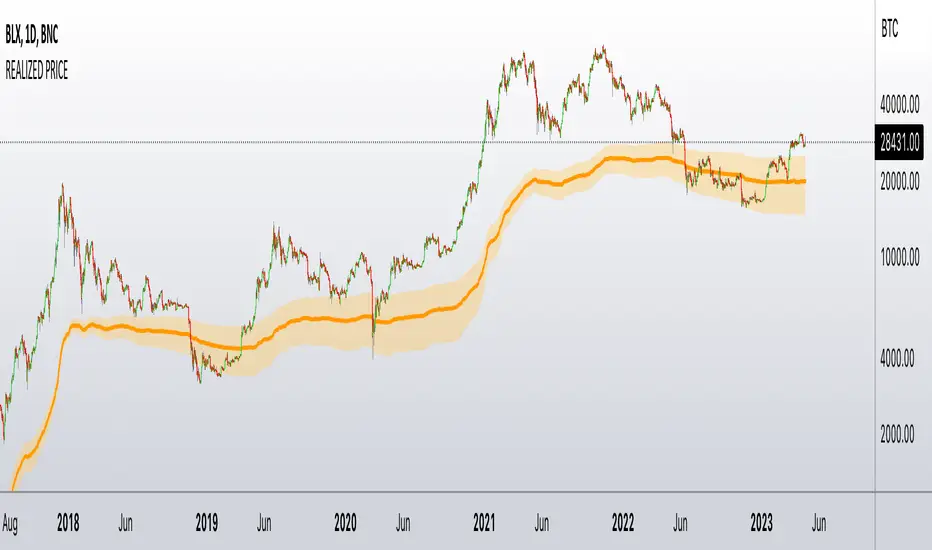
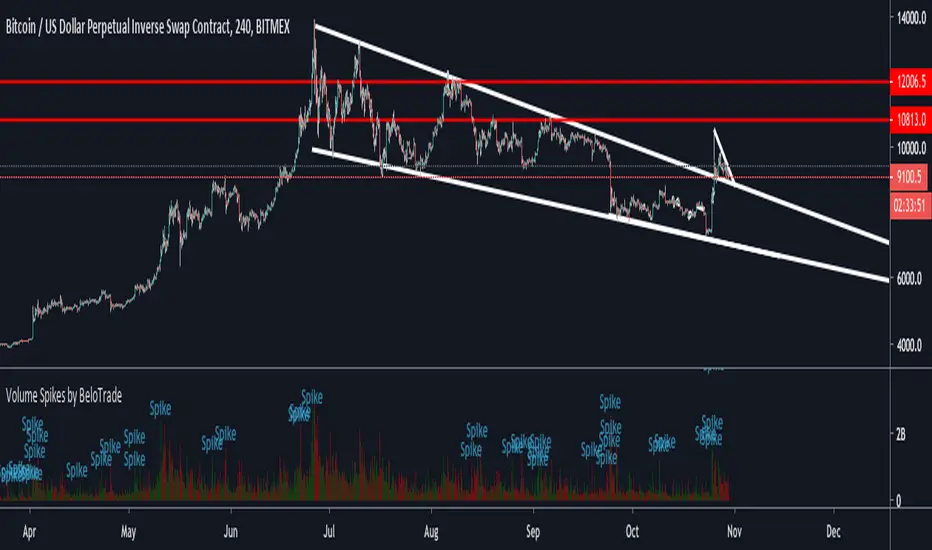
Volume Spikes by BeloTradeBitcoin: 3 Times Bigger / 20 Period
Big Altcoins: 4 Times Bigger / 20 Period
Small Altcoins 5 Times Bigger / 20 Period
Always apply this settings with the price context.
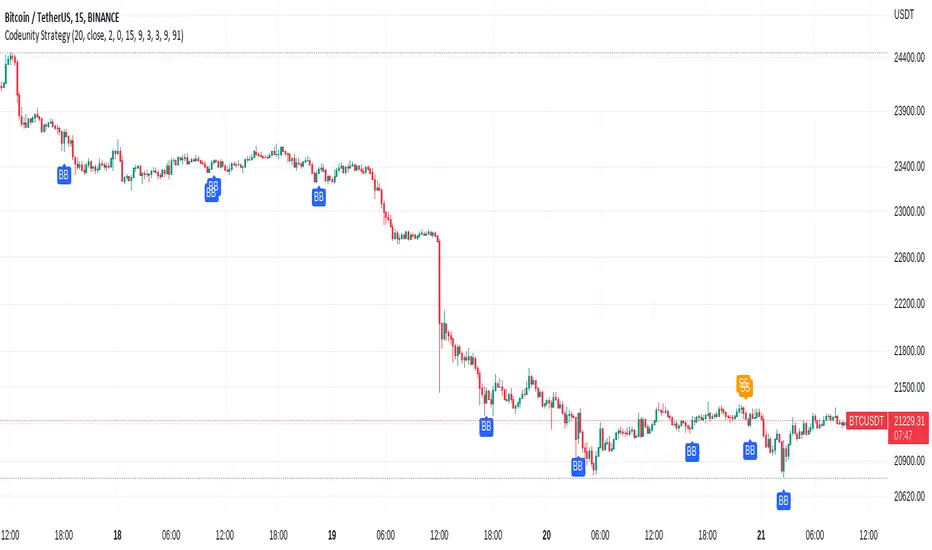
Code Unity 1.0Bitcoin 15 minutes strategy.
Bitcoin 15 minutes strategy.
Bitcoin 15 minutes strategy.
Bitcoin 15 minutes strategy.
Bitcoin 15 minutes strategy.
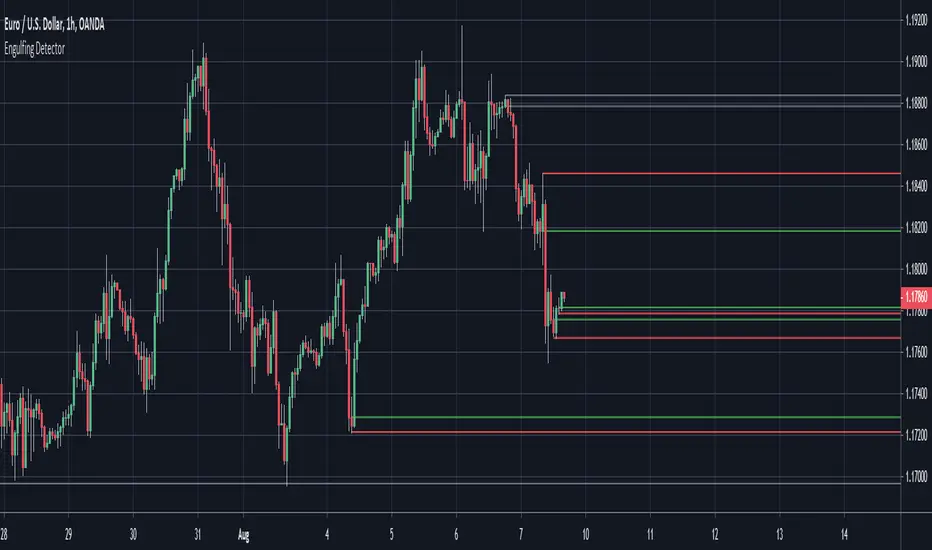
Engulfing Detector (Supply and Demand)Bullish and bearish engulfing candles marked with horizontal lines around engulfed candle.
This indicator can be used to assist in locating potential supply and demand zones.
The fresh zones will be of green and red line colors and the tested zone lines are grey in color.
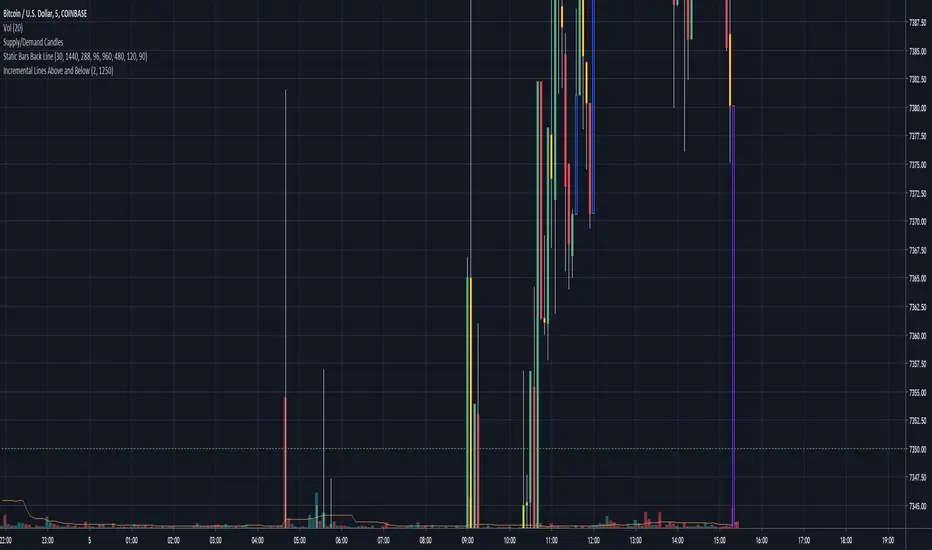
Incremental Lines Above and BelowPut lines above and below current price by a specified value. The step value refers to the mintick value of the symbol. (e.g. BTCUSD has a mintick value of 0.01 so if you wanted an increment of $12.50 you would use 1250 for the number of steps between value)
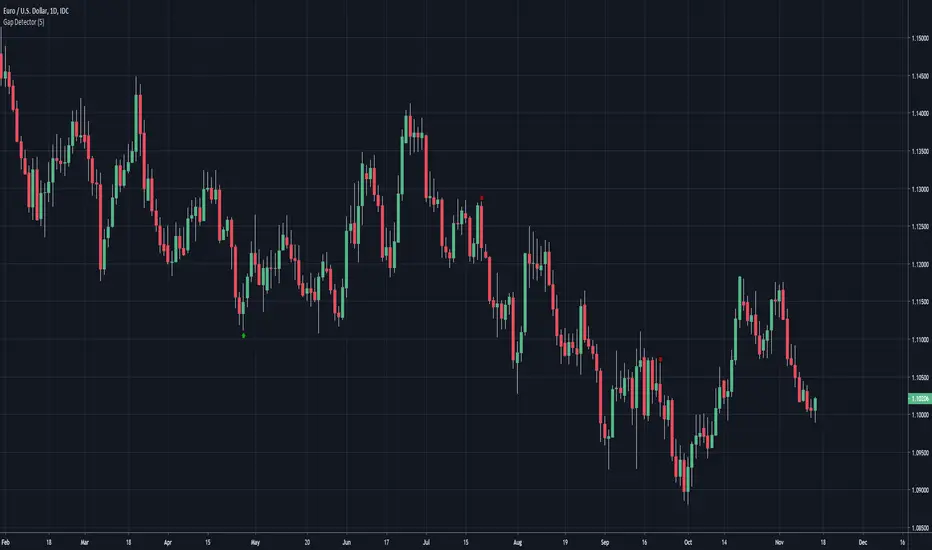
Gap DetectorArrow at candle where bullish or bearish gap occurred by a configurable minimum pip distance