Apex Wallet - Bitcoin Halving Cycle & Profit ProjectionOverview The Apex Wallet Bitcoin Halving Cycle Profit is a strategic macro-analysis tool designed for Bitcoin investors and long-term holders. It provides a visual framework of Bitcoin's 4-year cycles by identifying past halving dates and projecting future ones automatically. The script highlights key accumulation and profit-taking windows based on historical cycle performance.
Dynamic Cycle Intelligence
Halving Milestones: Automatically detects and marks all major halving events (2012, 2016, 2020, 2024) with precise timestamps.
Predictive Projections: Using an estimated 1,460-day cycle, the script projects up to 30 future halving events to help plan long-term investment horizons.
Timeframe Optimization: Built specifically for Weekly (W) and Monthly (M) charts to provide a clean, high-level perspective of market structure.
Key Strategy Visuals
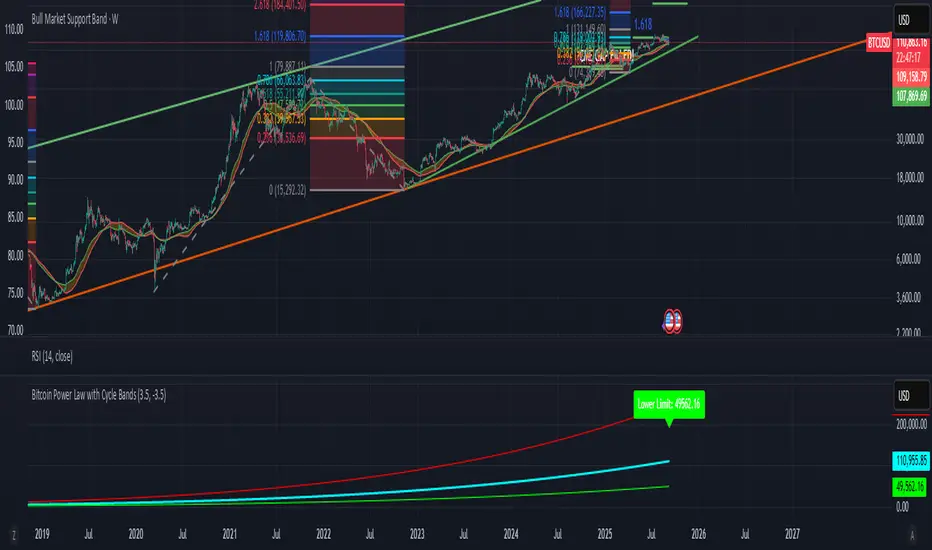
Profit Windows: Visualizes "Start" and "End" profit zones with automated vertical lines and color-coded labels based on user-defined offsets from the halving.
DCA Chain Signals: Identifies strategic Dollar Cost Averaging (DCA) points throughout the cycle to assist in disciplined accumulation.
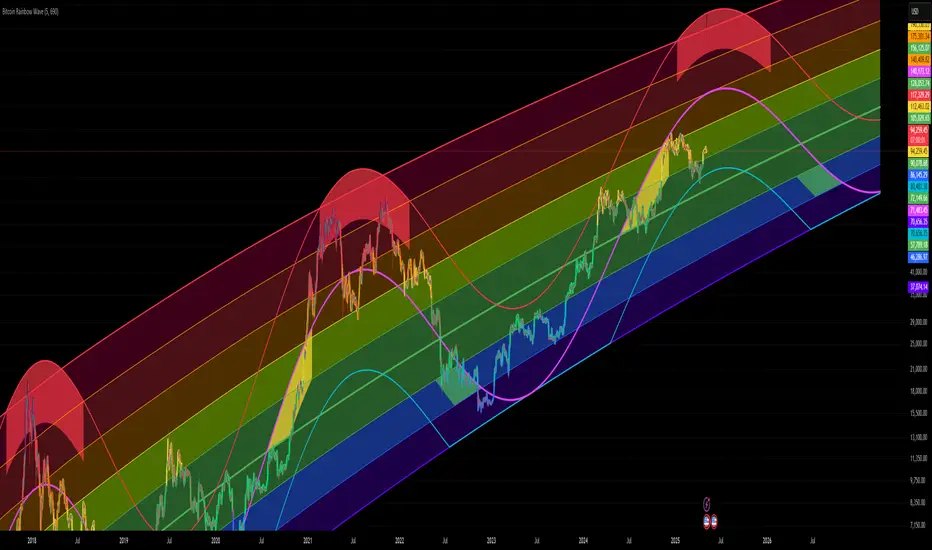
Heatmap Shading: Features dynamic background shading that intensifies as the cycle progresses toward historical peak performance periods.
How to Use:
Switch to a Weekly or Monthly Bitcoin chart.
Use the Green Labels (Profit START) to identify early cycle strength.
Monitor the Red Labels (Profit END) for historical cycle exhaustion zones.
Indicatore Pine Script®