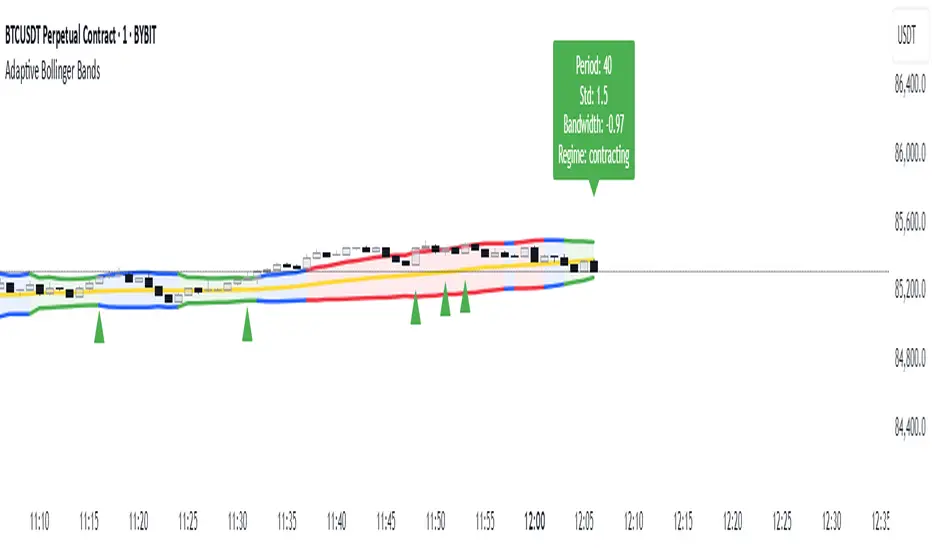
Adaptive Bollinger BandsAdaptive Bollinger Bands
This indicator displays Bollinger Bands with parameters that dynamically adjust based on market volatility. Unlike standard Bollinger Bands with fixed parameters, this version adaptively modifies both the period and standard deviation multiplier in real-time based on measured market conditions.
Key Features
Dynamic adjustment of period and standard deviation based on normalized volatility
Color-coded visualization of current volatility regime (expanding, normal, contracting)
Integration with Keltner Channels for band refinement
Bandwidth analysis for volatility regime identification
Optional on-chart parameter labels showing current settings
Band cross alerts and visual markers
Volatility Visualization
The indicator uses color-coding to display different volatility regimes:
Red: Expanding volatility regime (higher measured volatility)
Blue: Normal volatility regime (average measurements)
Green: Contracting volatility regime (lower measured volatility)
Technical Information
The indicator calculates volatility by analyzing price returns over a configurable lookback period (default 50 bars). The standard deviation of returns is normalized against historical extremes to create an adaptive scaling factor.
Band adaptation occurs through two primary mechanisms:
1. Period adjustment: Higher volatility uses shorter periods (more responsive), while lower volatility uses longer periods (more stable)
2. Standard deviation multiplier adjustment: Higher volatility increases the multiplier (wider bands), while lower volatility decreases it (tighter bands)
The middle band uses a simple moving average with the adaptive period. Additional refinement occurs through Keltner Channel integration, which can tighten bands when contained within Keltner boundaries.
Volatility regimes are determined by analyzing Bollinger Bandwidth relative to its recent history, providing contextual information about the current market state.
Settings Customization
The indicator provides extensive customization options:
- Base parameters (period and standard deviation)
- Adaptive range limits (min/max period and standard deviation)
- Keltner Channel parameters for band refinement
- Bandwidth analysis settings
- Display options for visual elements
Limitations and Considerations
All technical indicators have inherent limitations and should not be used in isolation
Past performance does not guarantee future results
The indicator requires sufficient historical data for proper volatility normalization
Smaller timeframes may produce more noise in the adaptive calculations
Parameters may require adjustment for different markets and trading styles
Band crosses are not trading signals on their own and should be evaluated with other factors
This indicator is designed to provide objective information about market volatility conditions and potential support/resistance zones. Always combine with other analysis methods within a comprehensive trading approach.
Cerca negli script per "bollingerband"
Red & Green Zone ReversalOverview
The “Red & Green Zone Reversal” indicator is designed to visually highlight potential reversal zones on your chart by using a combination of Bollinger Bands and the Relative Strength Index (RSI).
It overlays on the chart and provides background color cues—red for oversold conditions and green for overbought conditions—along with corresponding alert triggers.
Key Components
Overlay: The indicator is set to overlay the chart, meaning its visual cues (colored backgrounds) are drawn directly on the price chart.
Bollinger Bands Calculation
Period: A 20-period simple moving average (SMA) is calculated from the closing prices.
Standard Deviation Multiplier: A multiplier of 2.0 is applied.
Bands Defined:
Basis: The 20-period SMA.
Deviation: Calculated as 2 times the standard deviation over the same period.
Upper Band: Basis plus the deviation.
Lower Band: Basis minus the deviation.
RSI Calculation
Period: The RSI is computed over a 14-period span using the closing prices.
Thresholds:
Oversold Threshold: 30 (used for the red zone condition).
Overbought Threshold: 70 (used for the green zone condition).
Zone Conditions
Red Zone (Oversold):
Criteria: The price is below the lower Bollinger Band and the RSI is below 30.
Purpose: Highlights a situation where the asset may be deeply oversold, signaling a potential reversal to the upside.
Green Zone (Overbought):
Criteria: The price is above the upper Bollinger Band and the RSI is above 70.
Purpose: Indicates that the asset may be overbought, potentially signaling a reversal to the downside.
Visual and Alert Components
Background Coloring:
Red Background: Applied when the red zone condition is met (using a semi-transparent red).
Green Background: Applied when the green zone condition is met (using a semi-transparent green).
Alerts:
Red Alert: An alert condition titled “Deep Oversold Alert” is triggered with the message “Deep Oversold Signal triggered!” when the red zone criteria are satisfied.
Green Alert: Similarly, an alert condition titled “Deep Overbought Alert” is triggered with the message “Deep Overbought Signal triggered!” when the green zone criteria are met.
Important Disclaimers
Not Financial Advice:
This indicator is provided for informational and analytical purposes only. It does not constitute trading advice or a recommendation to buy or sell any asset. Traders should use it as one of several tools in their analysis and should perform their own due diligence.
Risk Management:
Trading inherently involves risk. Past performance is not indicative of future results. Always implement appropriate risk management and use stop losses where necessary.
Summary
In summary, the “Red & Green Zone Reversal” indicator uses Bollinger Bands and RSI to detect extreme market conditions. It visually marks oversold (red) and overbought (green) conditions directly on the chart and offers alert conditions to help traders monitor these potential reversal points.
Enjoy!!

RSI with Bollinger Bands and Buy/Sell SignalsPurpose:
This indicator combines the Relative Strength Index (RSI) with Bollinger Bands to identify overbought and oversold conditions in the market. It also generates buy and sell signals based on the interaction between the RSI and the Bollinger Bands. It is particularly useful for traders looking for opportunities in volatile or trending markets.
How It Works:
RSI (Relative Strength Index):
The RSI measures the magnitude of recent price changes to evaluate whether an asset is overbought (values > 70) or oversold (values < 30).
In this indicator, horizontal lines at levels 70 (overbought) and 30 (oversold) are used as reference points.
Bollinger Bands:
Bollinger Bands are calculated around a smoothed moving average of the RSI. The upper band represents dynamic overbought levels, while the lower band indicates dynamic oversold levels.
These bands automatically adjust their width based on the volatility of the RSI, allowing them to adapt to different market conditions.
Buy and Sell Signals:
Buy Signal: A buy signal is generated when the RSI exceeds both the upper Bollinger Band and the overbought level (70). This suggests that the asset is in an extreme bullish phase.
Sell Signal: A sell signal is generated when the RSI falls below both the lower Bollinger Band and the oversold level (30). This suggests that the asset is in an extreme bearish phase.
Alerts:
The indicator includes automatic alerts to notify you when buy or sell signals are generated. This allows traders to act quickly on new opportunities.
Best Practices:
Confirmation in Lower Timeframes:
Although this indicator is powerful, it is recommended to confirm signals in lower timeframes before making trading decisions. For example:
If you receive a buy signal on a 4-hour chart, check if the RSI and Bollinger Bands on lower timeframes (such as 1 hour or 15 minutes) also show bullish signals.
This reduces the risk of false positives and increases the accuracy of your entries.
Use in Trends:
This indicator works best in markets with clear trends. In sideways or low-volatility markets, signals may be less reliable due to the lack of directional momentum.
Risk Management:
Always use stop-loss and take-profit to protect your positions. Buy and sell signals are just one tool for analysis; they do not guarantee results.
Combination with Other Indicators:
To improve accuracy, consider combining this indicator with others, such as MACD, Stochastic Oscillator, or Japanese candlestick patterns. This can provide additional confirmation before opening a position.
Summary:
The RSI + Bollinger Bands with Buy/Sell Signals indicator is an advanced tool designed to identify entry and exit points in the market based on extreme overbought and oversold conditions. However, to maximize its effectiveness, it is crucial to confirm signals in lower timeframes and use it in combination with other technical analysis tools. With proper risk management and careful interpretation of signals, this indicator can be a valuable ally in your trading strategy.

Waldo Momentum Cloud Bollinger Bands (WMCBB)
Title: Waldo Momentum Cloud Bollinger Bands (WMCBB)
Description:
Introducing the "Waldo Momentum Cloud Bollinger Bands (WMCBB)," an innovative trading tool crafted for those who aim to deepen their market analysis by merging two dynamic technical indicators: Dynamic RSI Bollinger Bands and the Waldo Cloud.
What is this Indicator?
WMCBB integrates the volatility-based traditional Bollinger Bands with a momentum-sensitive approach through the Relative Strength Index (RSI). Here’s how it works:
Dynamic RSI Bollinger Bands: These bands dynamically adjust according to the RSI, which tracks the momentum of price movements. By scaling the RSI to align with price levels, we generate bands that not only reflect market volatility but also the underlying momentum, offering a refined view of overbought and oversold conditions.
Waldo Cloud: This feature adds a layer of traditional Bollinger Bands, visualized as a 'cloud' on your chart. It employs standard Bollinger Band methodology but enhances it with additional moving average layers to better define market trends.
The cloud's color changes dynamically based on various market conditions, providing visual signals for trend direction and potential trend reversals.
Why Combine These Indicators?
Combining Dynamic RSI Bollinger Bands with the Waldo Cloud in WMCBB aims to:
Enhance Trend Identification: The Waldo Cloud's color-coded system aids in recognizing the overarching market trend, while the Dynamic RSI Bands give insights into momentum changes within that trend, offering a comprehensive view.
Improve Volatility and Momentum Analysis: While traditional Bollinger Bands measure market volatility, integrating RSI adds a layer of momentum analysis, potentially leading to more accurate trading signals.
Visual Clarity: The unified color scheme for both sets of bands, which changes according to RSI levels, moving average crossovers, and price positioning, simplifies the process of gauging market sentiment at a glance.
Customization: Users have the option to toggle the visibility of moving averages (MA) through the settings, allowing for tailored analysis based on individual trading strategies.
Usage:
Utilize WMCBB to identify potential trend shifts by observing price interactions with the dynamic bands or changes in the Waldo Cloud's color.
Watch for divergences between price movements and RSI to forecast potential market reversals or continuations.
This combination shines in sideways markets where traditional indicators might fall short, as it provides additional context through RSI momentum analysis.
Settings:
Customize parameters for both the Dynamic RSI and Waldo Cloud Bollinger Bands, including the calculation source, standard deviation factors, and moving average lengths.
WMCBB is perfect for traders seeking to enhance their market analysis through the synergy of momentum and volatility, all while maintaining visual simplicity. Trade with greater insight using the Waldo Momentum Cloud Bollinger Bands!

Smart Market Bias [PhenLabs]📊 Smart Market Bias Indicator (SMBI)
Version: PineScript™ v6
Description
The Smart Market Bias Indicator (SMBI) is an advanced technical analysis tool that combines multiple statistical approaches to determine market direction and strength. It utilizes complexity analysis, information theory (Kullback Leibler divergence), and traditional technical indicators to provide a comprehensive market bias assessment. The indicator features adaptive parameters based on timeframe and trading style, with real-time visualization through a sophisticated dashboard.
🔧 Components
Complexity Analysis: Measures price movement patterns and trend strength
KL Divergence: Statistical comparison of price distributions
Technical Overlays: RSI and Bollinger Bands integration
Filter System: Volume and trend validation
Visual Dashboard: Dynamic color-coded display of all components
Simultaneous current timeframe + higher time frame analysis
🚨Important Explanation Feature🚨
By hovering over each individual cell in this comprehensive dashboard, you will get a thorough and in depth explanation of what each cells is showing you
Visualization
HTF Visualization
📌 Usage Guidelines
Based on your own trading style you should alter the timeframe length that you would like to be analyzing with your dashboard
The longer the term of the position you are planning on entering the higher timeframe you should have your dashboard set to
Bias Interpretation:
Values > 50% indicate bullish bias
Values < 50% indicate bearish bias
Neutral zone: 45-55% suggests consolidation
✅ Best Practices:
Use appropriate timeframe preset for your trading style
Monitor all components for convergence/divergence
Consider filter strength for signal validation
Use color intensity as confidence indicator
⚠️ Limitations
Requires sufficient historical data for accurate calculations
Higher computational complexity on lower timeframes
May lag during extremely volatile conditions
Best performance during regular market hours
What Makes This Unique
Multi-Component Analysis: Combines complexity theory, statistical analysis, and traditional technical indicators
Adaptive Parameters: Automatically optimizes settings based on timeframe
Triple-Layer Filtering: Uses trend, volume, and minimum strength thresholds
Visual Confidence System: Color intensity indicates signal strength
Multi-Timeframe Capabilities: Allowing the trader to analyze not only their current time frame but also the higher timeframe bias
🔧 How It Works
The indicator processes market data through four main components:
Complexity Score (40% weight): Analyzes price returns and pattern complexity
Kullback Leibler Divergence (30% weight): Compares current and historical price distributions
RSI Analysis (20% weight): Momentum and oversold/overbought conditions
Bollinger Band Position (10% weight): Price position relative to volatility
Underlying Method
Maintains rolling windows of price data for multiple calculations
Applies custom normalization using hyperbolic tangent function
Weights component scores based on reliability and importance
Generates final bias percentage with confidence visualization
💡 Note: For optimal results, use in conjunction with price action analysis and consider multiple timeframe confirmation. The indicator performs best when all components show alignment.

Multi-Band Comparison (Uptrend)Multi-Band Comparison
Overview:
The Multi-Band Comparison indicator is engineered to reveal critical levels of support and resistance in strong uptrends. In a healthy upward market, the price action will adhere closely to the 95th percentile line (the Upper Quantile Band), effectively “riding” it. This indicator combines a modified Bollinger Band (set at one standard deviation), quantile analysis (95% and 5% levels), and power‑law math to display a dynamic picture of market structure—highlighting a “golden channel” and robust support areas.
Key Components & Calculations:
The Golden Channel: Upper Bollinger Band & Upper Std Dev Band of the Upper Quantile
Upper Bollinger Band:
Calculation:
boll_upper=SMA(close,length)+(boll_mult×stdev)
boll_upper=SMA(close,length)+(boll_mult×stdev) Here, the 20-period SMA is used along with one standard deviation of the close, where the multiplier (boll_mult) is 1.0.
Role in an Uptrend:
In a healthy uptrend, price rides near the 95th percentile line. When price crosses above this Upper Bollinger Band, it confirms strong bullish momentum.
Upper Std Dev Band of the Upper Quantile (95th Percentile) Band:
Calculation:
quant_upper_std_up=quant_upper+stdev
quant_upper_std_up=quant_upper+stdev The Upper Quantile Band, quant_upperquant_upper, is calculated as the 95th percentile of recent price data. Adding one standard deviation creates an extension that accounts for normal volatility around this extreme level.
The Golden Channel:
When the price crosses above the Upper Bollinger Band, the Upper Std Dev Band of the Upper Quantile immediately shifts to gold (yellow) and remains gold until price falls below the Bollinger level. Together, these two lines form the “golden channel”—a visual hallmark of a healthy uptrend where the price reliably hugs the 95th percentile level.
Upper Power‑Law Band
Calculation:
The Upper Power‑Law Band is derived in two steps:
Determine the Extreme Return Factor:
power_upper=Percentile(returns,95%)
power_upper=Percentile(returns,95%) where returns are computed as:
returns=closeclose −1.
returns=close close−1.
Scale the Current Price:
power_upper_band=close×(1+power_upper)
power_upper_band=close×(1+power_upper)
Rationale and Correlation:
By focusing on the upper 5% of returns (reflecting “fat tails”), the Upper Power‑Law Band captures extreme but statistically expected movements. In an uptrend, its value often converges with the Upper Std Dev Band of the Upper Quantile because both measures reflect heightened volatility and extreme price levels. When the Upper Power‑Law Band exceeds the Upper Std Dev Band, it can signal a temporary overextension.
Upper Quantile Band (95% Percentile)
Calculation:
quant_upper=Percentile(price,95%)
quant_upper=Percentile(price,95%) This level represents where 95% of past price data falls below, and in a robust uptrend the price action practically rides this line.
Color Logic:
Its color shifts from a neutral (blackish) tone to a vibrant, bullish hue when the Upper Power‑Law Band crosses above it—signaling extra strength in the trend.
Lower Quantile and Its Support
Lower Quantile Band (5% Percentile):
Calculation:
quant_lower=Percentile(price,5%)
quant_lower=Percentile(price,5%)
Behavior:
In a healthy uptrend, price remains well above the Lower Quantile Band. It turns red only when price touches or crosses it, serving as a warning signal. Under normal conditions it remains bright green, indicating the market is not nearing these extreme lows.
Lower Std Dev Band of the Lower Quantile:
This line is calculated by subtracting one standard deviation from quant_lowerquant_lower and typically serves as absolute support in nearly all conditions (except during gap or near-gap moves). Its consistent role as support provides traders with a robust level to monitor.
How to Use the Indicator:
Golden Channel and Trend Confirmation:
As price rides the Upper Quantile (95th percentile) perfectly in a healthy uptrend, the Upper Bollinger Band (1 stdev above SMA) and the Upper Std Dev Band of the Upper Quantile form a “golden channel” once price crosses above the Bollinger level. When this occurs, the Upper Std Dev Band remains gold until price dips back below the Bollinger Band. This visual cue reinforces trend strength.
Power‑Law Insights:
The Upper Power‑Law Band, which is based on extreme (95th percentile) returns, tends to align with the Upper Std Dev Band. This convergence reinforces that extreme, yet statistically expected, price moves are occurring—indicating that even though the price rides the 95th percentile, it can only stretch so far before a correction or consolidation.
Support Indicators:
Primary and Secondary Support in Uptrends:
The Upper Bollinger Band and the Lower Std Dev Band of the Upper Quantile act as support zones for minor retracements in the uptrend.
Absolute Support:
The Lower Std Dev Band of the Lower Quantile serves as an almost invariable support area under most market conditions.
Conclusion:
The Multi-Band Comparison indicator unifies advanced statistical techniques to offer a clear view of uptrend structure. In a healthy bull market, price action rides the 95th percentile line with precision, and when the Upper Bollinger Band is breached, the corresponding Upper Std Dev Band turns gold to form a “golden channel.” This, combined with the Power‑Law analysis that captures extreme moves, and the robust lower support levels, provides traders with powerful, multi-dimensional insights for managing entries, exits, and risk.
Disclaimer:
Trading involves risk. This indicator is for educational purposes only and does not constitute financial advice. Always perform your own analysis before making trading decisions.

Adaptive Momentum Reversion StrategyThe Adaptive Momentum Reversion Strategy: An Empirical Approach to Market Behavior
The Adaptive Momentum Reversion Strategy seeks to capitalize on market price dynamics by combining concepts from momentum and mean reversion theories. This hybrid approach leverages a Rate of Change (ROC) indicator along with Bollinger Bands to identify overbought and oversold conditions, triggering trades based on the crossing of specific thresholds. The strategy aims to detect momentum shifts and exploit price reversions to their mean.
Theoretical Framework
Momentum and Mean Reversion: Momentum trading assumes that assets with a recent history of strong performance will continue in that direction, while mean reversion suggests that assets tend to return to their historical average over time (Fama & French, 1988; Poterba & Summers, 1988). This strategy incorporates elements of both, looking for periods when momentum is either overextended (and likely to revert) or when the asset’s price is temporarily underpriced relative to its historical trend.
Rate of Change (ROC): The ROC is a straightforward momentum indicator that measures the percentage change in price over a specified period (Wilder, 1978). The strategy calculates the ROC over a 2-period window, making it responsive to short-term price changes. By using ROC, the strategy aims to detect price acceleration and deceleration.
Bollinger Bands: Bollinger Bands are used to identify volatility and potential price extremes, often signaling overbought or oversold conditions. The bands consist of a moving average and two standard deviation bounds that adjust dynamically with price volatility (Bollinger, 2002).
The strategy employs two sets of Bollinger Bands: one for short-term volatility (lower band) and another for longer-term trends (upper band), with different lengths and standard deviation multipliers.
Strategy Construction
Indicator Inputs:
ROC Period: The rate of change is computed over a 2-period window, which provides sensitivity to short-term price fluctuations.
Bollinger Bands:
Lower Band: Calculated with a 18-period length and a standard deviation of 1.7.
Upper Band: Calculated with a 21-period length and a standard deviation of 2.1.
Calculations:
ROC Calculation: The ROC is computed by comparing the current close price to the close price from rocPeriod days ago, expressing it as a percentage.
Bollinger Bands: The strategy calculates both upper and lower Bollinger Bands around the ROC, using a simple moving average as the central basis. The lower Bollinger Band is used as a reference for identifying potential long entry points when the ROC crosses above it, while the upper Bollinger Band serves as a reference for exits, when the ROC crosses below it.
Trading Conditions:
Long Entry: A long position is initiated when the ROC crosses above the lower Bollinger Band, signaling a potential shift from a period of low momentum to an increase in price movement.
Exit Condition: A position is closed when the ROC crosses under the upper Bollinger Band, or when the ROC drops below the lower band again, indicating a reversal or weakening of momentum.
Visual Indicators:
ROC Plot: The ROC is plotted as a line to visualize the momentum direction.
Bollinger Bands: The upper and lower bands, along with their basis (simple moving averages), are plotted to delineate the expected range for the ROC.
Background Color: To enhance decision-making, the strategy colors the background when extreme conditions are detected—green for oversold (ROC below the lower band) and red for overbought (ROC above the upper band), indicating potential reversal zones.
Strategy Performance Considerations
The use of Bollinger Bands in this strategy provides an adaptive framework that adjusts to changing market volatility. When volatility increases, the bands widen, allowing for larger price movements, while during quieter periods, the bands contract, reducing trade signals. This adaptiveness is critical in maintaining strategy effectiveness across different market conditions.
The strategy’s pyramiding setting is disabled (pyramiding=0), ensuring that only one position is taken at a time, which is a conservative risk management approach. Additionally, the strategy includes transaction costs and slippage parameters to account for real-world trading conditions.
Empirical Evidence and Relevance
The combination of momentum and mean reversion has been widely studied and shown to provide profitable opportunities under certain market conditions. Studies such as Jegadeesh and Titman (1993) confirm that momentum strategies tend to work well in trending markets, while mean reversion strategies have been effective during periods of high volatility or after sharp price movements (De Bondt & Thaler, 1985). By integrating both strategies into one system, the Adaptive Momentum Reversion Strategy may be able to capitalize on both trending and reverting market behavior.
Furthermore, research by Chan (1996) on momentum-based trading systems demonstrates that adaptive strategies, which adjust to changes in market volatility, often outperform static strategies, providing a compelling rationale for the use of Bollinger Bands in this context.
Conclusion
The Adaptive Momentum Reversion Strategy provides a robust framework for trading based on the dual concepts of momentum and mean reversion. By using ROC in combination with Bollinger Bands, the strategy is capable of identifying overbought and oversold conditions while adapting to changing market conditions. The use of adaptive indicators ensures that the strategy remains flexible and can perform across different market environments, potentially offering a competitive edge for traders who seek to balance risk and reward in their trading approaches.
References
Bollinger, J. (2002). Bollinger on Bollinger Bands. McGraw-Hill Professional.
Chan, L. K. C. (1996). Momentum, Mean Reversion, and the Cross-Section of Stock Returns. Journal of Finance, 51(5), 1681-1713.
De Bondt, W. F., & Thaler, R. H. (1985). Does the Stock Market Overreact? Journal of Finance, 40(3), 793-805.
Fama, E. F., & French, K. R. (1988). Permanent and Temporary Components of Stock Prices. Journal of Political Economy, 96(2), 246-273.
Jegadeesh, N., & Titman, S. (1993). Returns to Buying Winners and Selling Losers: Implications for Stock Market Efficiency. Journal of Finance, 48(1), 65-91.
Poterba, J. M., & Summers, L. H. (1988). Mean Reversion in Stock Prices: Evidence and Implications. Journal of Financial Economics, 22(1), 27-59.
Wilder, J. W. (1978). New Concepts in Technical Trading Systems. Trend Research.

Uptrick: Volatility Reversion BandsUptrick: Volatility Reversion Bands is an indicator designed to help traders identify potential reversal points in the market by combining volatility and momentum analysis within one comprehensive framework. It calculates dynamic bands around a simple moving average and issues signals when price interacts with these bands. Below is a fully expanded description, structured in multiple sections, detailing originality, usefulness, uniqueness, and the purpose behind blending standard deviation-based and ATR-based concepts. All references to code have been removed to focus on the written explanation only.
Section 1: Overview
Uptrick: Volatility Reversion Bands centers on a moving average around which various bands are constructed. These bands respond to changes in price volatility and can help gauge potential overbought or oversold conditions. Signals occur when the price moves beyond certain thresholds, which may imply a reversal or significant momentum shift.
Section 2: Originality, Usefulness, Uniqness, Purpose
This indicator merges two distinct volatility measurements—Bollinger Bands and ATR—into one cohesive system. Bollinger Bands use standard deviation around a moving average, offering a baseline for what is statistically “normal” price movement relative to a recent mean. When price hovers near the upper band, it may indicate overbought conditions, whereas price near the lower band suggests oversold conditions. This straightforward construction often proves invaluable in moderate-volatility settings, as it pinpoints likely turning points and gauges a market’s typical trading range.
Yet Bollinger Bands alone can falter in conditions marked by abrupt volatility spikes or sudden gaps that deviate from recent norms. Intraday news, earnings releases, or macroeconomic data can alter market behavior so swiftly that standard-deviation bands do not keep pace. This is where ATR (Average True Range) adds an important layer. ATR tracks recent highs, lows, and potential gaps to produce a dynamic gauge of how much price is truly moving from bar to bar. In quieter times, ATR contracts, reflecting subdued market activity. In fast-moving markets, ATR expands, exposing heightened volatility on each new bar.
By overlaying Bollinger Bands and ATR-based calculations, the indicator achieves a broader situational awareness. Bollinger Bands excel at highlighting relative overbought or oversold areas tied to an established average. ATR simultaneously scales up or down based on real-time market swings, signaling whether conditions are calm or turbulent. When combined, this means a price that barely crosses the Bollinger Band but also triggers a high ATR-based threshold is likely experiencing a volatility surge that goes beyond typical market fluctuations. Conversely, a price breach of a Bollinger Band when ATR remains low may still warrant attention, but not necessarily the same urgency as in a high-volatility regime.
The resulting synergy offers balanced, context-rich signals. In a strong trend, the ATR layer helps confirm whether an apparent price breakout really has momentum or if it is just a temporary spike. In a range-bound market, standard deviation-based Bollinger Bands define normal price extremes, while ATR-based extensions highlight whether a breakout attempt has genuine force behind it. Traders gain clarity on when a move is both statistically unusual and accompanied by real volatility expansion, thus carrying a higher probability of a directional follow-through or eventual reversion.
Practical advantages emerge across timeframes. Scalpers in fast-paced markets appreciate how ATR-based thresholds update rapidly, revealing if a sudden price push is routine or exceptional. Swing traders can rely on both indicators to filter out false signals in stable conditions or identify truly notable moves. By calibrating to changes in volatility, the merged system adapts naturally whether the market is trending, ranging, or transitioning between these phases.
In summary, combining Bollinger Bands (for a static sense of standard-deviation-based overbought/oversold zones) with ATR (for a dynamic read on current volatility) yields an adaptive, intuitive indicator. Traders can better distinguish fleeting noise from meaningful expansions, enabling more informed entries, exits, and risk management. Instead of relying on a single yardstick for all market conditions, this fusion provides a layered perspective, encouraging traders to interpret price moves in the broader context of changing volatility.
Section 3: Why Bollinger Bands and ATR are combined
Bollinger Bands provide a static snapshot of volatility by computing a standard deviation range above and below a central average. ATR, on the other hand, adapts in real time to expansions or contractions in market volatility. When combined, these measures offset each other’s limitations: Bollinger Bands add structure (overbought and oversold references), and ATR ensures responsiveness to rapid price shifts. This synergy helps reduce noisy signals, particularly during sudden market turbulence or extended consolidations.
Section 4: User Inputs
Traders can adjust several parameters to suit their preferences and strategies. These typically include:
1. Lookback length for calculating the moving average and standard deviation.
2. Multipliers to control the width of Bollinger Bands.
3. An ATR multiplier to set the distance for additional reversal bands.
4. An option to display weaker signals when the price merely approaches but does not cross the outer bands.
Section 5: Main Calculations
At the core of this indicator are four important steps:
1. Calculate a basis using a simple moving average.
2. Derive Bollinger Bands by adding and subtracting a product of the standard deviation and a user-defined multiplier.
3. Compute ATR over the same lookback period and multiply it by the selected factor.
4. Combine ATR-based distance with the Bollinger Bands to set the outer reversal bands, which serve as stronger signal thresholds.
Section 6: Signal Generation
The script interprets meaningful reversal points when the price:
1. Crosses below the lower outer band, potentially highlighting oversold conditions where a bullish reversal may occur.
2. Crosses above the upper outer band, potentially indicating overbought conditions where a bearish reversal may develop.
Section 7: Visualization
The indicator provides visual clarity through labeled signals and color-coded references:
1. Distinct colors for upper and lower reversal bands.
2. Markers that appear above or below bars to denote possible buying or selling signals.
3. A gradient bar color scheme indicating a bar’s position between the lower and upper bands, helping traders quickly see if the price is near either extreme.
Section 8: Weak Signals (Optional)
For those preferring early cues, the script can highlight areas where the price nears the outer bands. When weak signals are enabled:
1. Bars closer to the upper reversal zone receive a subtle marker suggesting a less robust, yet still noteworthy, potential selling area.
2. Bars closer to the lower reversal zone receive a subtle marker suggesting a less robust, yet still noteworthy, potential buying area.
Section 9: Simplicity, Effectiveness, and Lower Timeframes
Although combining standard deviation and ATR involves sophisticated volatility concepts, this indicator is visually straightforward. Reversal bands and gradient-colored bars make it easy to see at a glance when price approaches or crosses a threshold. Day traders operating on lower timeframes benefit from such clarity because it helps filter out minor fluctuations and focus on more meaningful signals.
Section 10: Adaptability across Market Phases
Because both the standard deviation (for Bollinger Bands) and ATR adapt to changing volatility, the indicator naturally adjusts to various environments:
1. Trending: The additional ATR-based outer bands help distinguish between temporary pullbacks and deeper reversals.
2. Ranging: Bollinger Bands often remain narrower, identifying smaller reversals, while the outer ATR bands remain relatively close to the main bands.
Section 11: Reduced Noise in High-Volatility Scenarios
By factoring ATR into the band calculations, the script widens or narrows the thresholds during rapid market fluctuations. This reduces the amount of false triggers typically found in indicators that rely solely on fixed calculations, preventing overreactions to abrupt but short-lived price spikes.
Section 12: Incorporation with Other Technical Tools
Many traders combine this indicator with oscillators such as RSI, MACD, or Stochastic, as well as volume metrics. Overbought or oversold signals in momentum oscillators can provide additional confirmation when price reaches the outer bands, while volume spikes may reinforce the significance of a breakout or potential reversal.
Section 13: Risk Management Considerations
All trading strategies carry risk. This indicator, like any tool, can and does produce losing trades if price unexpectedly reverses again or if broader market conditions shift rapidly. Prudent traders employ protective measures:
1. Stop-loss orders or trailing stops.
2. Position sizing that accounts for market volatility.
3. Diversification across different asset classes when possible.
Section 14: Overbought and Oversold Identification
Standard Bollinger Bands highlight regions where price might be overextended relative to its recent average. The extended ATR-based reversal bands serve as secondary lines of defense, identifying moments when price truly stretches beyond typical volatility bounds.
Section 15: Parameter Customization for Different Needs
Users can tailor the script to their unique preferences:
1. Shorter lookback settings yield faster signals but risk more noise.
2. Higher multipliers spread the bands further apart, filtering out small moves but generating fewer signals.
3. Longer lookback periods smooth out market noise, often leading to more stable but less frequent trading cues.
Section 16: Examples of Different Trading Styles
1. Day Traders: Often reduce the length to capture quick price swings.
2. Swing Traders: May use moderate lengths such as 20 to 50 bars.
3. Position Traders: Might opt for significantly longer settings to detect macro-level reversals.
Section 17: Performance Limitations and Reality Check
No technical indicator is free from false signals. Sudden fundamental news events, extreme sentiment changes, or low-liquidity conditions can render signals less reliable. Backtesting and forward-testing remain essential steps to gauge whether the indicator aligns well with a trader’s timeframe, risk tolerance, and instrument of choice.
Section 18: Merging Volatility and Momentum
A critical uniqueness of this indicator lies in how it merges Bollinger Bands (standard deviation-based) with ATR (pure volatility measure). Bollinger Bands provide a relative measure of price extremes, while ATR dynamically reacts to market expansions and contractions. Together, they offer an enhanced perspective on potential market turns, ideally reducing random noise and highlighting moments where price has traveled beyond typical bounds.
Section 19: Purpose of this Merger
The fundamental purpose behind blending standard deviation measures with real-time volatility data is to accommodate different market behaviors. Static standard deviation alone can underreact or overreact in abnormally volatile conditions. ATR alone lacks a baseline reference to normality. By merging them, the indicator aims to provide:
1. A versatile dynamic range for both typical and extreme moves.
2. A filter against frequent whipsaws, especially in choppy environments.
3. A visual framework that novices and experts can interpret rapidly.
Section 20: Summary and Practical Tips
Uptrick: Volatility Reversion Bands offers a powerful tool for traders looking to combine volatility-based signals with momentum-derived reversals. It emphasizes clarity through color-coded bars, defined reversal zones, and optional weak signal markers. While potentially useful across all major timeframes, it demands ongoing risk management, realistic expectations, and careful study of how signals behave under different market conditions. No indicator serves as a crystal ball, so integrating this script into an overall strategy—possibly alongside volume data, fundamentals, or momentum oscillators—often yields the best results.
Disclaimer and Educational Use
This script is intended for educational and informational purposes. It does not constitute financial advice, nor does it guarantee trading success. Sudden economic events, low-liquidity times, and unexpected market behaviors can all undermine technical signals. Traders should use proper testing procedures (backtesting and forward-testing) and maintain disciplined risk management measures.

Forex Pair Yield Momentum This Pine Script strategy leverages yield differentials between the 2-year government bond yields of two countries to trade Forex pairs. Yield spreads are widely regarded as a fundamental driver of currency movements, as highlighted by international finance theories like the Interest Rate Parity (IRP), which suggests that currencies with higher yields tend to appreciate due to increased capital flows:
1. Dynamic Yield Spread Calculation:
• The strategy dynamically calculates the yield spread (yield_a - yield_b) for the chosen Forex pair.
• Example: For GBP/USD, the spread equals US 2Y Yield - UK 2Y Yield.
2. Momentum Analysis via Bollinger Bands:
• Yield momentum is computed as the difference between the current spread and its moving
Bollinger Bands are applied to identify extreme deviations:
• Long Entry: When momentum crosses below the lower band.
• Short Entry: When momentum crosses above the upper band.
3. Reversal Logic:
• An optional checkbox reverses the trading logic, allowing long trades at the upper band and short trades at the lower band, accommodating different market conditions.
4. Trade Management:
• Positions are held for a predefined number of bars (hold_periods), and each trade uses a fixed contract size of 100 with a starting capital of $20,000.
Theoretical Basis:
1. Yield Differentials and Currency Movements:
• Empirical studies, such as Clarida et al. (2009), confirm that interest rate differentials significantly impact exchange rate dynamics, especially in carry trade strategies .
• Higher-yields tend to appreciate against lower-yielding currencies due to speculative flows and demand for higher returns.
2. Bollinger Bands for Momentum:
• Bollinger Bands effectively capture deviations in yield momentum, identifying opportunities where price returns to equilibrium (mean reversion) or extends in trend-following scenarios (momentum breakout).
• As Bollinger (2001) emphasized, this tool adapts to market volatility by dynamically adjusting thresholds .
References:
1. Dornbusch, R. (1976). Expectations and Exchange Rate Dynamics. Journal of Political Economy.
2. Obstfeld, M., & Rogoff, K. (1996). Foundations of International Macroeconomics.
3. Clarida, R., Davis, J., & Pedersen, N. (2009). Currency Carry Trade Regimes. NBER.
4. Bollinger, J. (2001). Bollinger on Bollinger Bands.
5. Mendelsohn, L. B. (2006). Forex Trading Using Intermarket Analysis.

Soul Button Scalping (1 min chart) V 1.0Indicator Description
- P Signal: The foundational buy signal. It should be confirmed by observing RSI divergence on the 1-minute chart.
- Green, Orange, and Blue Signals: Three buy signals generated through the combination of multiple oscillators. These signals should also be cross-referenced with the RSI on the 1-minute chart.
- Big White and Big Yellow Signals: These represent strong buy signals, triggered in extreme oversold conditions.
- BEST BUY Signal: The most reliable and powerful buy signal available in this indicator.
____________
Red Sell Signal: A straightforward sell signal indicating potential overbought conditions.
____________
Usage Guidance
This scalping indicator is specifically designed for use on the 1-minute chart, incorporating data from the 5-minute chart for added context. It is most effective when used in conjunction with:
• VWAP (Volume Weighted Average Price), already included in the indicator.
• RSI on the 1-minute chart, which should be opened as a separate indicator.
• Trendlines, structure breakouts, and price action analysis to confirm signals.
Intended for Crypto Scalping:
The indicator is optimized for scalping cryptocurrency markets.
____________
Future Enhancements:
• Integration of price action and candlestick patterns.
• A refined version tailored for trading futures contracts, specifically ES and MES in the stock market.

Williams BBDiv Signal [trade_lexx]📈 Williams BBDiv Signal — Improve your trading strategy with accurate signals!
Introducing Williams BBDiv Signal , an advanced trading indicator designed for a comprehensive analysis of market conditions. This indicator combines Williams%R with Bollinger Bands, providing traders with a powerful tool for generating buy and sell signals, as well as detecting divergences. It is ideal for traders who need an advantage in detecting changing trends and market conditions.
🔍 How signals work
— A buy signal is generated when the Williams %R line crosses the lower Bollinger Bands band from bottom to top. This indicates that the market may be oversold and ready for a rebound. They are displayed as green triangles located under the Williams %R graph. On the main chart, buy signals are displayed as green triangles labeled "Buy" under candlesticks.
— A sell signal is generated when the Williams %R line crosses the upper Bollinger Bands band from top to bottom. This indicates that the market may be overbought and ready for a correction. They are displayed as red triangles located above the Williams %R chart. On the main chart, the sell signals are displayed as red triangles with the word "Sell" above the candlesticks.
— Minimum Bars Between Signals
The user can adjust the minimum number of bars between the signals to avoid false signals. This helps to filter out noise and improve signal quality.
— Mode "Wait for Opposite Signal"
In this mode, buy and sell signals are generated only after receiving the opposite signal. This adds an additional level of filtering and helps to avoid false alarms.
— Mode "Overbought and Oversold Zones"
A buy signal is generated only when Williams %R is below the -80 level (Lower Band). A sell signal is generated only when Williams %R is above -20 (Upper Band).
📊 Divergences
— Bullish divergence occurs when Williams%R shows a higher low while price shows a lower low. This indicates a possible upward reversal. They are displayed as green lines and labels labeled "Bull" on the Williams %R chart. On the main chart, bullish divergences are displayed as green triangles labeled "Bull" under candlesticks.
— A bearish divergence occurs when Williams %R shows a lower high, while the price shows a higher high. This indicates a possible downward reversal. They are displayed as red lines and labels labeled "Bear" on the Williams %R chart. On the main chart, bearish divergences are displayed as red triangles with the word "Bear" above the candlesticks.
— 🔌Connector Signal🔌 and 🔌Connector Divergence🔌
It allows you to connect the indicator to trading strategies and test signals throughout the trading history. This makes the indicator an even more powerful tool for traders who want to test the effectiveness of their strategies on historical data.
🔔 Alerts
The indicator provides the ability to set up alerts for buy and sell signals, as well as for divergences. This allows traders to keep abreast of important market developments without having to constantly monitor the chart.
🎨 Customizable Appearance
Customize the appearance of Williams BBDiv Signal according to your preferences to make the analysis more convenient and visually pleasing. In the indicator settings section, you can change the colors of the buy and sell signals, as well as divergences, so that they stand out on the chart and are easily visible.
🔧 How it works
— The indicator starts by calculating the Williams %R and Bollinger Bands values for a certain period to assess market conditions. Initial assumptions are introduced for overbought and oversold levels, as well as for the standard deviation of the Bollinger Bands. The indicator then analyzes these values to generate buy and sell signals. This classification helps to determine the appropriate level of volatility for signal calculation. As the market evolves, the indicator dynamically adjusts, providing information about the trend and volatility in real time.
Quick Guide to Using Williams BBDiv Signal
— Add the indicator to your favorites by clicking on the star icon. Adjust the parameters, such as the period length for Williams %R, the type of moving average and the standard deviation for Bollinger Bands, according to your trading style. Or leave all the default settings.
— Adjust the signal filters to improve the quality of the signals and avoid false alarms, adjust the filters in the "Signal Settings" section.
— Turn on alerts so that you don't miss important trading opportunities and don't constantly sit at the chart, set up alerts for buy and sell signals, as well as for divergences. This will allow you to keep abreast of all key market developments and respond to them in a timely manner, without being distracted from other business.
— Use signals. They will help you determine the optimal entry and exit points for your positions. Also, pay attention to bullish and bearish divergences, which may indicate possible market reversals and provide additional trading opportunities.
— Use the 🔌Connector🔌 for deeper analysis and verification of the effectiveness of signals, connect it to your trading strategies. This will allow you to test signals throughout the trading history and evaluate their accuracy based on historical data. Include the indicator in your trading strategy and run testing to see how buy and sell signals have worked in the past. Analyze the test results to determine how reliable the signals are and how they can improve your trading strategy. This will help you make better informed decisions and increase your trading efficiency.

Uptrick: Smart BoundariesThis script is an indicator that combines the RSI (Relative Strength Index) and Bollinger Bands to highlight potential points where price momentum and volatility may both be at extreme levels. Below is a detailed explanation of its components, how it calculates signals, and why these two indicators have been merged into one tool. This script is intended solely for educational purposes and for traders who want to explore the combined use of momentum and volatility measures. Please remember that no single indicator guarantees profitable results.
Purpose of This Script
This script is designed to serve as a concise, all-in-one tool for traders seeking to track both momentum and volatility extremes in real time. By overlaying RSI signals with Bollinger Band boundaries, it helps users quickly identify points on a chart where price movement may be highly stretched. The goal is to offer a clearer snapshot of potential overbought or oversold conditions without requiring two separate indicators. Additionally, its optional pyramiding feature enables users to manage how many times they initiate trades when signals repeat in the same direction. Through these combined functions, the script aims to streamline technical analysis by consolidating two popular measures—momentum via RSI and volatility via Bollinger Bands—into a single, manageable interface.
1. Why Combine RSI and Bollinger Bands
• RSI (Relative Strength Index): This is a momentum oscillator that measures the speed and magnitude of recent price changes. It typically ranges between 0 and 100. Traders often watch for RSI crossing into “overbought” or “oversold” levels because it may indicate a potential shift in momentum.
• Bollinger Bands: These bands are plotted around a moving average, using a standard deviation multiplier to create an upper and lower boundary. They help illustrate how volatile the price has been relative to its recent average. When price moves outside these boundaries, some traders see it as a sign the price may be overstretched and could revert closer to the average.
Combining these two can be useful because it blends two different perspectives on market movement. RSI attempts to identify momentum extremes, while Bollinger Bands track volatility extremes. By looking for moments when both conditions agree, the script tries to highlight points where price might be unusually stretched in terms of both momentum and volatility.
2. How Signals Are Generated
• Buy Condition:
- RSI dips below a specified “oversold” level (for example, 30 by default).
- Price closes below the lower Bollinger Band.
When these occur together, the script draws a label indicating a potential bullish opportunity. The underlying reasoning is that momentum (RSI) suggests a stronger-than-usual sell-off, and price is also stretched below the lower Bollinger Band.
• Sell Condition:
- RSI rises above a specified “overbought” level (for example, 70 by default).
- Price closes above the upper Bollinger Band.
When these occur together, a label is plotted for a potential bearish opportunity. The rationale is that momentum (RSI) may be overheated, and the price is trading outside the top of its volatility range.
3. Pyramiding Logic and Trade Count Management
• Pyramiding refers to taking multiple positions in the same direction when signals keep firing. While some traders prefer just one position per signal, others like to scale into a trade if the market keeps pushing in their favor.
• This script uses variables that keep track of how many recent buy or sell signals have fired. If the count reaches a user-defined maximum, no more signals of that type will trigger additional labels. This protects traders from over-committing to one direction if the market conditions remain “extreme” for a prolonged period.
• If you disable the pyramiding feature, the script will only plot one label per side until the condition resets (i.e., until RSI and price conditions are no longer met).
4. Labels and Visual Feedback
• Whenever a buy or sell condition appears, the script plots a label directly on the chart:
- Buy labels under the price bar.
- Sell labels above the price bar.
These labels make it easier to review where both RSI and Bollinger Band conditions align. It can be helpful for visually scanning the chart to see if the signals show any patterns related to market reversals or trend continuations.
• The Bollinger Bands themselves are plotted so traders can see when the price is approaching or exceeding the upper or lower band. Watching the RSI and Bollinger Band plots simultaneously can give traders more context for each signal.
5. Originality and Usefulness
This script provides a distinct approach by merging two well-established concepts—RSI and Bollinger Bands—within a single framework, complemented by optional pyramiding controls. Rather than using each indicator separately, it attempts to uncover moments when momentum signals from RSI align with volatility extremes highlighted by Bollinger Bands. This combined perspective can aid in spotting areas of possible overextension in price. Additionally, the built-in pyramiding mechanism offers a method to manage multiple signals in the same direction, allowing users to adjust how aggressively they scale into trades. By integrating these elements together, the script aims to deliver a tool that caters to diverse trading styles while remaining straightforward to configure and interpret.
6. How to Use the Indicator
• Configure the Inputs:
- RSI Length (the lookback period used for the RSI calculation).
- RSI Overbought and Oversold Levels.
- Bollinger Bands Length and Multiplier (defines the moving average period and the degree of deviation).
- Option to reduce pyramiding.
• Set Alerts (Optional):
- You can create TradingView alerts for when these conditions occur, so you do not have to monitor the chart constantly. Choose the buy or sell alert conditions in your alert settings.
• Integration in a Trading Plan:
- This script alone is not a complete trading system. Consider combining it with other forms of analysis, such as support and resistance, volume profiles, or candlestick patterns. Thorough research, testing on historical data, and risk management are always recommended.
7. No Performance Guarantees
• This script does not promise any specific trading results. It is crucial to remember that no single indicator can accurately predict future market movements all the time. The script simply tries to highlight moments when two well-known indicators both point to an extreme condition.
• Actual trading decisions should factor in a range of market information, including personal risk tolerance and broader market conditions.
8. Purpose and Limitations
• Purpose:
- Provide a combined view of momentum (RSI) and volatility (Bollinger Bands) in a single script.
- Assist in spotting times when price may be at an extreme.
- Offer a configurable system for labeling potential buy or sell points based on these extremes.
• Limitations:
- Overbought and oversold conditions can persist for an extended period in trending markets.
- Bollinger Band breakouts do not always result in immediate reversals. Sometimes price keeps moving in the same direction.
- The script does not include a built-in exit strategy or risk management rules. Traders must handle these themselves.
Additional Disclosures
This script is published open-source and does not rely on any external or private libraries. It does not use lookahead methods or repaint signals; all calculations are performed on the current bar without referencing future data. Furthermore, the script is designed for standard candlestick or bar charts rather than non-standard chart types (e.g., Heikin Ashi, Renko). Traders should keep in mind that while the script can help locate potential momentum and volatility extremes, it does not include an exit strategy or account for factors like slippage or commission. All code comes from built-in Pine Script functions and standard formulas for RSI and Bollinger Bands. Anyone reviewing or modifying this script should exercise caution and incorporate proper risk management when applying it to their own trading.
Calculation Details
The script computes RSI by examining a user-defined number of prior bars (the RSI Length) and determining the average of up-moves relative to the average of down-moves over that period. This ratio is then scaled to a 0–100 range, so lower values typically indicate stronger downward momentum, while higher values suggest stronger upward momentum. In parallel, Bollinger Bands are generated by first calculating a simple moving average (SMA) of the closing price for the user-specified length. The script then measures the standard deviation of closing prices over the same period and multiplies it by the chosen factor (the Bollinger Bands Multiplier) to form the upper and lower boundaries around the SMA. These two measures are checked in tandem: if the RSI dips below a certain oversold threshold and price trades below the lower Bollinger Band, a condition is met that may imply a strong short-term sell-off; similarly, if the RSI surpasses the overbought threshold and price rises above the upper Band, it may indicate an overextended move to the upside. The pyramiding counters track how many of these signals occur in sequence, preventing excessive stacking of labels on the chart if conditions remain extreme for multiple bars.
Conclusion
This indicator aims to provide a more complete view of potential market extremes by overlaying the RSI’s momentum readings on top of Bollinger Band volatility signals. By doing so, it attempts to help traders see when both indicators suggest that the market might be oversold or overbought. The optional reduced pyramiding logic further refines how many signals appear, giving users the choice of a single entry or multiple scaling entries. It does not claim any guaranteed success or predictive power, but rather serves as a tool for those wanting to explore this combined approach. Always be cautious and consider multiple factors before placing any trades.

RSI and Bollinger Bands Screener [deepakks444]Indicator Overview
The indicator is designed to help traders identify potential long signals by combining the Relative Strength Index (RSI) and Bollinger Bands across multiple timeframes. This combination allows traders to leverage the strengths of both indicators to make more informed trading decisions.
Understanding RSI
What is RSI?
The Relative Strength Index (RSI) is a momentum oscillator that measures the speed and change of price movements. Developed by J. Welles Wilder Jr. for stocks and forex trading, the RSI is primarily used to identify overbought or oversold conditions in an asset.
How RSI Works:
Calculation: The RSI is calculated using the average gains and losses over a specified period, typically 14 periods.
Range: The RSI oscillates between 0 and 100.
Interpretation:
Key Features of RSI:
Momentum Indicator: RSI helps identify the momentum of price movements.
Divergences: RSI can show divergences, where the price makes a higher high, but the RSI makes a lower high, indicating potential reversals.
Trend Identification: RSI can also help identify trends. In an uptrend, the RSI tends to stay above 50, and in a downtrend, it tends to stay below 50.
Understanding Bollinger Bands
What is Bollinger Bands?
Bollinger Bands are a type of trading band or envelope plotted two standard deviations (positively and negatively) away from a simple moving average (SMA) of a price. Developed by financial analyst John Bollinger, Bollinger Bands consist of three lines:
Upper Band: SMA + (Standard Deviation × Multiplier)
Middle Band (Basis): SMA
Lower Band: SMA - (Standard Deviation × Multiplier)
How Bollinger Bands Work:
Volatility Measure: Bollinger Bands measure the volatility of the market. When the bands are wide, it indicates high volatility, and when the bands are narrow, it indicates low volatility.
Price Movement: The price tends to revert to the mean (middle band) after touching the upper or lower bands.
Support and Resistance: The upper and lower bands can act as dynamic support and resistance levels.
Key Features of Bollinger Bands:
Volatility Indicator: Bollinger Bands help traders understand the volatility of the market.
Mean Reversion: Prices tend to revert to the mean (middle band) after touching the bands.
Squeeze: A Bollinger Band Squeeze occurs when the bands narrow significantly, indicating low volatility and a potential breakout.
Combining RSI and Bollinger Bands
Strategy Overview:
The strategy aims to identify potential long signals by combining RSI and Bollinger Bands across multiple timeframes. The key conditions are:
RSI Crossing Above 60: The RSI should cross above 60 on the 15-minute timeframe.
RSI Above 60 on Higher Timeframes: The RSI should already be above 60 on the hourly and daily timeframes.
Price Above 20MA or Walking on Upper Bollinger Band: The price should be above the 20-period moving average of the Bollinger Bands or walking on the upper Bollinger Band.
Strategy Details:
RSI Calculation:
Calculate the RSI for the 15-minute, 1-hour, and 1-day timeframes.
Check if the RSI crosses above 60 on the 15-minute timeframe.
Ensure the RSI is above 60 on the 1-hour and 1-day timeframes.
Bollinger Bands Calculation:
Calculate the Bollinger Bands using a 20-period moving average and 2 standard deviations.
Check if the price is above the 20-period moving average or walking on the upper Bollinger Band.
Entry and Exit Signals:
Long Signal: When all the above conditions are met, consider a long entry.
Exit: Exit the trade when the price crosses below the 20-period moving average or the stop-loss is hit.
Example Usage
Setup:
Add the indicator to your TradingView chart.
Configure the inputs as per your requirements.
Monitoring:
Look for the long signal on the chart.
Ensure that the RSI is above 60 on the 15-minute, 1-hour, and 1-day timeframes.
Check that the price is above the 20-period moving average or walking on the upper Bollinger Band.
Trading:
Enter a long position when the criteria are met.
Set a stop-loss below the low of the recent 15-minute candle or based on your risk management rules.
Monitor the trade and exit when the RSI returns below 60 on any of the timeframes or when the price crosses below the 20-period moving average.
House Rules Compliance
No Financial Advice: This strategy is for educational purposes only and should not be construed as financial advice.
Risk Management: Always use proper risk management techniques, including stop-loss orders and position sizing.
Past Performance: Past performance is not indicative of future results. Always conduct your own research and analysis.
TradingView Guidelines: Ensure that any shared scripts or strategies comply with TradingView's terms of service and community guidelines.
Conclusion
This strategy combines RSI and Bollinger Bands across multiple timeframes to identify potential long signals. By ensuring that the RSI is above 60 on higher timeframes and that the price is above the 20-period moving average or walking on the upper Bollinger Band, traders can make more informed decisions. Always remember to conduct thorough research and use proper risk management techniques.

DCA Strategy with Mean Reversion and Bollinger BandDCA Strategy with Mean Reversion and Bollinger Band
The Dollar-Cost Averaging (DCA) Strategy with Mean Reversion and Bollinger Bands is a sophisticated trading strategy that combines the principles of DCA, mean reversion, and technical analysis using Bollinger Bands. This strategy aims to capitalize on market corrections by systematically entering positions during periods of price pullbacks and reversion to the mean.
Key Concepts and Principles
1. Dollar-Cost Averaging (DCA)
DCA is an investment strategy that involves regularly purchasing a fixed dollar amount of an asset, regardless of its price. The idea behind DCA is that by spreading out investments over time, the impact of market volatility is reduced, and investors can avoid making large investments at inopportune times. The strategy reduces the risk of buying all at once during a market high and can smooth out the cost of purchasing assets over time.
In the context of this strategy, the Investment Amount (USD) is set by the user and represents the amount of capital to be invested in each buy order. The strategy executes buy orders whenever the price crosses below the lower Bollinger Band, which suggests a potential market correction or pullback. This is an effective way to average the entry price and avoid the emotional pitfalls of trying to time the market perfectly.
2. Mean Reversion
Mean reversion is a concept that suggests prices will tend to return to their historical average or mean over time. In this strategy, mean reversion is implemented using the Bollinger Bands, which are based on a moving average and standard deviation. The lower band is considered a potential buy signal when the price crosses below it, indicating that the asset has become oversold or underpriced relative to its historical average. This triggers the DCA buy order.
Mean reversion strategies are popular because they exploit the natural tendency of prices to revert to their mean after experiencing extreme deviations, such as during market corrections or panic selling.
3. Bollinger Bands
Bollinger Bands are a technical analysis tool that consists of three lines:
Middle Band: The moving average, usually a 200-period Exponential Moving Average (EMA) in this strategy. This serves as the "mean" or baseline.
Upper Band: The middle band plus a certain number of standard deviations (multiplier). The upper band is used to identify overbought conditions.
Lower Band: The middle band minus a certain number of standard deviations (multiplier). The lower band is used to identify oversold conditions.
In this strategy, the Bollinger Bands are used to identify potential entry points for DCA trades. When the price crosses below the lower band, this is seen as a potential opportunity for mean reversion, suggesting that the asset may be oversold and could reverse back toward the middle band (the EMA). Conversely, when the price crosses above the upper band, it indicates overbought conditions and signals potential market exhaustion.
4. Time-Based Entry and Exit
The strategy has specific entry and exit points defined by time parameters:
Open Date: The date when the strategy begins opening positions.
Close Date: The date when all positions are closed.
This time-bound approach ensures that the strategy is active only during a specified window, which can be useful for testing specific market conditions or focusing on a particular time frame.
5. Position Sizing
Position sizing is determined by the Investment Amount (USD), which is the fixed amount to be invested in each buy order. The quantity of the asset to be purchased is calculated by dividing the investment amount by the current price of the asset (investment_amount / close). This ensures that the amount invested remains constant despite fluctuations in the asset's price.
6. Closing All Positions
The strategy includes an exit rule that closes all positions once the specified close date is reached. This allows for controlled exits and limits the exposure to market fluctuations beyond the strategy's timeframe.
7. Background Color Based on Price Relative to Bollinger Bands
The script uses the background color of the chart to provide visual feedback about the price's relationship with the Bollinger Bands:
Red background indicates the price is above the upper band, signaling overbought conditions.
Green background indicates the price is below the lower band, signaling oversold conditions.
This provides an easy-to-interpret visual cue for traders to assess the current market environment.
Postscript: Configuring Initial Capital for Backtesting
To ensure the backtest results align with the actual investment scenario, users must adjust the Initial Capital in the TradingView strategy properties. This is done by calculating the Initial Capital as the product of the Total Closed Trades and the Investment Amount (USD). For instance:
If the user is investing 100 USD per trade and has 10 closed trades, the Initial Capital should be set to 1,000 USD.
Similarly, if the user is investing 200 USD per trade and has 24 closed trades, the Initial Capital should be set to 4,800 USD.
This adjustment ensures that the backtesting results reflect the actual capital deployed in the strategy and provides an accurate representation of potential gains and losses.
Conclusion
The DCA strategy with Mean Reversion and Bollinger Bands is a systematic approach to investing that leverages the power of regular investments and technical analysis to reduce market timing risks. By combining DCA with the insights offered by Bollinger Bands and mean reversion, this strategy offers a structured way to navigate volatile markets while targeting favorable entry points. The clear entry and exit rules, coupled with time-based constraints, make it a robust and disciplined approach to long-term investing.

UVR ChannelsUVR CHANNELS: A VOLATILITY-BASED TREND ANALYSIS TOOL
PURPOSE
UVR Channels are designed to dynamically measure market volatility and identify key price levels for potential trend reversals. The channels are calculated using a unique volatility formula(UVR) combined with an EMA as the central reference point. This approach provides traders with a tool for evaluating trends, reversals, and market conditions such as breakouts or consolidations.
CALCULATION MECHANISM
1. Ultimate Volatility Rate (UVR) Calculation:
The UVR is a custom measure of volatility that highlights significant price movements by comparing the extremes of current and previous candles.
Volatility Components:
Two values are calculated to represent potential price fluctuations:
The absolute difference between the current candle's high and the previous candle's low:
Volatility Component 1=∣high−low ∣
The absolute difference between the previous candle's high and the current candle's low:
Volatility Component 2=∣high −low∣
Volatility Ratio:
The larger of the two components is selected as the Volatility Ratio, ensuring the UVR captures the most significant movement:
Volatility Ratio=max(Volatility Component 1,Volatility Component 2)
Smoothing with SMMA:
To stabilize the volatility calculation, the Volatility Ratio is smoothed using a Smoothed Moving Average (SMMA) over a user-defined period (e.g., 14 candles):
UVR= (UVR(Previous) × (Period−1))+Volatility Ratio)/Period
2. Band Construction:
The UVR is integrated into the band calculations by using the Exponential Moving Average (EMA) as the central line:
Central Line (EMA):
The EMA is calculated based on closing prices over a user-defined period (e.g., 20 candles).
Upper Band:
The upper band represents a dynamic resistance level, calculated as:
Upper Band=EMA+(UVR × Multiplier)
Lower Band:
The lower band serves as a dynamic support level, calculated as:
Lower Band=EMA−(UVR × Multiplier)
3. Role of the Multiplier:
The Multiplier adjusts the width of the bands based on trader preferences:
Higher Multiplier: Wider bands to capture larger price swings.
Lower Multiplier: Narrower bands for tighter market analysis.
FEATURES AND USAGE
Dynamic Volatility Analysis:
The UVR Channels expand and contract based on real-time market volatility, offering a dynamic framework for identifying potential price trends.
Expanding Bands: High market volatility.
Contracting Bands: Low volatility or consolidation.
Trend Identification:
Price consistently near the upper band indicates a strong bullish trend.
Price near the lower band signals a bearish trend.
Trend Reversal Signals:
Price reaching the upper band may signal overbought conditions, while price touching the lower band may signal oversold conditions.
Breakout Potential:
Narrow bands often precede significant price breakouts, making UVR Channels a useful tool for spotting early breakout conditions.
DIFFERENCES FROM BOLLINGER BANDS
Unlike Bollinger Bands, which rely on standard deviation to measure volatility, the UVR Channels use a custom volatility formula based on price extremes (highs and lows). This approach adapts to market behaviour in a unique way, providing traders with an alternative and accurate view of volatility and trends.
INPUT PARAMETERS
Volatility Period:
Determines the number of periods used to smooth the volatility ratio. A higher value results in smoother bands but may lag behind sudden market changes.
EMA Period:
Controls the calculation of the central reference line.
Multiplier:
Adjusts the width of the bands. Increasing the multiplier widens the bands, capturing larger price movements, while decreasing it narrows the bands for tighter analysis.
VISUALIZATION
Purple Line: The EMA (central line).
Red Line: Upper band (dynamic resistance).
Green Line: Lower band (dynamic support).
Shaded Area: Fills the space between the upper and lower bands, visually highlighting the channel.

[Venturose] MACD x BB x STDEV x RVIDescription:
The MACD x BB x STDEV x RVI combines MACD, Bollinger Bands, Standard Deviation, and Relative Volatility Index into a single tool. This indicator is designed to provide insights into market trends, momentum, and volatility. It generates buy and sell signals, by analyzing the interactions between these components. These buy and sell signals are not literal, and should be used in combination with the current trend.
How It Works:
MACD: Tracks momentum and trend direction using customizable fast and slow EMA periods.
Bollinger Bands: Adds volatility bands to MACD to identify overextension zones.
Standard Deviation: Dynamically adjusts the Bollinger Band width based on MACD volatility.
RVI (Relative Volatility Index): Confirms momentum extremes with upper and lower threshold markers.
Custom Logic: Includes a trigger system ("inside" or "flipped") to adapt signals to various market conditions and an optional filter to reduce noise.
Key Features:
Combines MACD and Bollinger Bands with volatility and momentum confirmations from RVI.
Dynamic color-coded plots for identifying bullish, bearish, and neutral trends.
Customizable parameters for tailoring the indicator to different strategies.
Optional signal filtering to refine buy and sell triggers.
Alerts for buy and sell signals based on signal logic.
Why It’s Unique:
This indicator combines momentum (MACD), volatility (Bollinger Bands and Standard Deviation), and confirmation signals (RVI thresholds) into a unified system. It introduces custom "inside" and "flipped" triggers for adaptable signal generation and includes signal filtering to reduce noise. The addition of RVI-based hints helps identify early overbought or oversold conditions, providing an extra layer of insight for decision-making. The dynamic integration of these components ensures a comprehensive yet straightforward analysis tool for various market conditions.
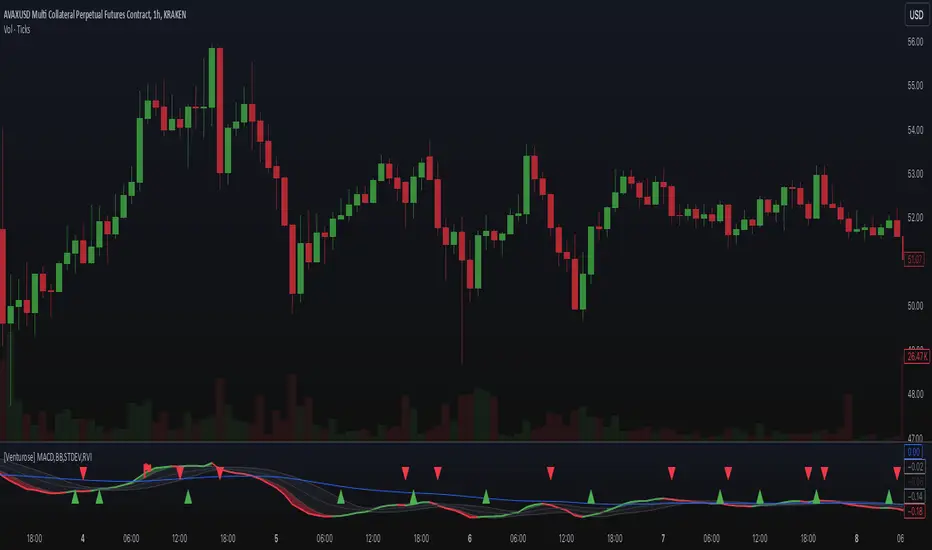
MACD, ADX & RSI -> for altcoins# MACD + ADX + RSI Combined Indicator
## Overview
This advanced technical analysis tool combines three powerful indicators (MACD, ADX, and RSI) into a single view, providing a comprehensive analysis of trend, momentum, and divergence signals. The indicator is designed to help traders identify potential trading opportunities by analyzing multiple aspects of price action simultaneously.
## Components
### 1. MACD (Moving Average Convergence Divergence)
- **Purpose**: Identifies trend direction and momentum
- **Components**:
- Fast EMA (default: 12 periods)
- Slow EMA (default: 26 periods)
- Signal Line (default: 9 periods)
- Histogram showing the difference between MACD and Signal line
- **Visual**:
- Blue line: MACD line
- Orange line: Signal line
- Green/Red histogram: MACD histogram
- **Interpretation**:
- Histogram color changes indicate potential trend shifts
- Crossovers between MACD and Signal lines suggest entry/exit points
### 2. ADX (Average Directional Index)
- **Purpose**: Measures trend strength and direction
- **Components**:
- ADX line (default threshold: 20)
- DI+ (Positive Directional Indicator)
- DI- (Negative Directional Indicator)
- **Visual**:
- Navy blue line: ADX
- Green line: DI+
- Red line: DI-
- **Interpretation**:
- ADX > 20 indicates a strong trend
- DI+ crossing above DI- suggests bullish momentum
- DI- crossing above DI+ suggests bearish momentum
### 3. RSI (Relative Strength Index)
- **Purpose**: Identifies overbought/oversold conditions and divergences
- **Components**:
- RSI line (default: 14 periods)
- Divergence detection
- **Visual**:
- Purple line: RSI
- Horizontal lines at 70 (overbought) and 30 (oversold)
- Divergence labels ("Bull" and "Bear")
- **Interpretation**:
- RSI > 70: Potentially overbought
- RSI < 30: Potentially oversold
- Bullish/Bearish divergences indicate potential trend reversals
## Alert System
The indicator includes several automated alerts:
1. **MACD Alerts**:
- Rising to falling histogram transitions
- Falling to rising histogram transitions
2. **RSI Divergence Alerts**:
- Bullish divergence formations
- Bearish divergence formations
3. **ADX Trend Alerts**:
- Strong trend development (ADX crossing threshold)
- DI+ crossing above DI- (bullish)
- DI- crossing above DI+ (bearish)
## Settings Customization
All components can be fine-tuned through the settings panel:
### MACD Settings
- Fast Length
- Slow Length
- Signal Smoothing
- Source
- MA Type options (SMA/EMA)
### ADX Settings
- Length
- Threshold level
### RSI Settings
- RSI Length
- Source
- Divergence calculation toggle
## Usage Guidelines
### Entry Signals
Strong entry signals typically occur when multiple components align:
1. MACD histogram color change
2. ADX showing strong trend (>20)
3. RSI showing divergence or leaving oversold/overbought zones
### Exit Signals
Consider exits when:
1. MACD crosses signal line in opposite direction
2. ADX shows weakening trend
3. RSI reaches extreme levels with divergence
### Risk Management
- Use the indicator as part of a complete trading strategy
- Combine with price action and support/resistance levels
- Consider multiple timeframe analysis for confirmation
- Don't rely solely on any single component
## Technical Notes
- Built for TradingView using Pine Script v5
- Compatible with all timeframes
- Optimized for real-time calculation
- Includes proper error handling and NA value management
- Memory-efficient calculations for smooth performance
## Installation
1. Copy the provided Pine Script code
2. Open TradingView Chart
3. Create New Indicator -> Pine Editor
4. Paste the code and click "Add to Chart"
5. Adjust settings as needed through the indicator settings panel
## Version Information
- Version: 2.0
- Last Updated: November 2024
- Platform: TradingView
- Language: Pine Script v5

MACD+RSI+BBDESCRIPTION
The MACD + RSI + Bollinger Bands Indicator is a comprehensive technical analysis tool designed for traders and investors to identify potential market trends and reversals. This script combines three indicators: the Moving Average Convergence Divergence (MACD), the Relative Strength Index (RSI), and Bollinger Bands. Each of these indicators provides unique insights into market behavior.
FEATURES
MACD (Moving Average Convergence Divergence)
The MACD is a trend-following momentum indicator that shows the relationship between two moving averages of a security’s price.
The script calculates the MACD line, the signal line, and the histogram, which visually represents the difference between the MACD line and the signal line.
RSI (Relative Strength Index)
The RSI is a momentum oscillator that measures the speed and change of price movements. It ranges from 0 to 100 and is typically used to identify overbought or oversold conditions.
The script allows users to set custom upper and lower thresholds for the RSI, with default values of 70 and 30, respectively.
Bollinger Bands
Bollinger Bands consist of a middle band (EMA) and two outer bands (standard deviations away from the EMA). They help traders identify volatility and potential price reversals.
The script allows users to customize the length of the Bollinger Bands and the multiplier for the standard deviation.
Color-Coding Logic
The histogram color changes based on the following conditions:
Black: If the RSI is above the upper threshold and the closing price is above the upper Bollinger Band, or if the RSI is below the lower threshold and the closing price is below the lower Bollinger Band.
Green (#4caf50): If the RSI is above the upper threshold but the closing price is not above the upper Bollinger Band.
Light Green (#a5d6a7): If the histogram is positive and the RSI is not above the upper threshold.
Red (#f23645): If the RSI is below the lower threshold but the closing price is not below the lower Bollinger Band.
Light Red (#faa1a4): If the histogram is negative and the RSI is not below the lower threshold.
Inputs
Bollinger Bands Settings
Length: The number of periods for the moving average.
Basis MA Type: The type of moving average (SMA, EMA, SMMA, WMA, VWMA).
Source: The price source for the Bollinger Bands calculation.
StdDev: The multiplier for the standard deviation.
RSI Settings
RSI Length: The number of periods for the RSI calculation.
RSI Upper: The upper threshold for the RSI.
RSI Lower: The lower threshold for the RSI.
Source: The price source for the RSI calculation.
MACD Settings
Fast Length: The length for the fast moving average.
Slow Length: The length for the slow moving average.
Signal Smoothing: The length for the signal line smoothing.
Oscillator MA Type: The type of moving average for the MACD calculation.
Signal Line MA Type: The type of moving average for the signal line.
Usage
This indicator is suitable for various trading strategies, including day trading, swing trading, and long-term investing.
Traders can use the MACD histogram to identify potential buy and sell signals, while the RSI can help confirm overbought or oversold conditions.
The Bollinger Bands provide context for price volatility and potential breakout or reversal points.
Example:
From the example, it can clearly see that the Selling Climax and Buying Climax, marked as orange circle when a black histogram occurs.
Conclusion
The MACD + RSI + Bollinger Bands Indicator is a versatile tool that combines multiple technical analysis methods to provide traders with a comprehensive view of market conditions. By utilizing this script, traders can enhance their analysis and improve their decision-making process.

Pivot Bollinger BandThis is a special kind of Bollinger Bands indicator that adapts to the market's pivot points. Instead of using regular price data, it first finds important swing highs and lows in the market (called pivot points). It then uses these pivot points to create a center line, which is like a moving average of where the market is pivoting.
Around this center line, it draws the classic Bollinger Bands - an upper and lower band that show where prices might find resistance or support. The distance between these bands changes based on market volatility, just like regular Bollinger Bands. You can adjust how sensitive it is to pivot points and how wide the bands should be.
By using pivot point based Bollinger Bands, we expect band breakout can be captured more effectively.

VIDYA ProTrend Multi-Tier ProfitHello! This time is about a trend-following system.
VIDYA is quite an interesting indicator that adjusts dynamically to market volatility, making it more responsive to price changes compared to traditional moving averages. Balancing adaptability and precision, especially with the more aggressive short trade settings, challenged me to fine-tune the strategy for a variety of market conditions.
█ Introduction and How it is Different
The "VIDYA ProTrend Multi-Tier Profit" strategy is a trend-following system that combines the VIDYA (Variable Index Dynamic Average) indicator with Bollinger Bands and a multi-step take-profit mechanism.
Unlike traditional trend strategies, this system allows for more adaptive profit-taking, adjusting for long and short positions through distinct ATR-based and percentage-based targets. The innovation lies in its dynamic multi-tier approach to profit-taking, especially for short trades, where more aggressive percentages are applied using a multiplier. This flexibility helps adapt to various market conditions by optimizing trade management and profit allocation based on market volatility and trend strength.
BTCUSD 6hr performance
█ Strategy, How it Works: Detailed Explanation
The core of the "VIDYA ProTrend Multi-Tier Profit" strategy lies in the dual VIDYA indicators (fast and slow) that analyze price trends while accounting for market volatility. These indicators work alongside Bollinger Bands to filter trade entries and exits.
🔶 VIDYA Calculation
The VIDYA indicator is calculated using the following formula:
Smoothing factor (𝛼):
alpha = 2 / (Length + 1)
VIDYA formula:
VIDYA(t) = alpha * k * Price(t) + (1 - alpha * k) * VIDYA(t-1)
Where:
k = |Chande Momentum Oscillator (MO)| / 100
🔶 Bollinger Bands as a Volatility Filter
Bollinger Bands are calculated using a rolling mean and standard deviation of price over a specified period:
Upper Band:
BB_upper = MA + (K * stddev)
Lower Band:
BB_lower = MA - (K * stddev)
Where:
MA is the moving average,
K is the multiplier (typically 2), and
stddev is the standard deviation of price over the Bollinger Bands length.
These bands serve as volatility filters to identify potential overbought or oversold conditions, aiding in the entry and exit logic.
🔶 Slope Calculation for VIDYA
The slopes of both fast and slow VIDYAs are computed to assess the momentum and direction of the trend. The slope for a given VIDYA over its length is:
Slope = (VIDYA(t) - VIDYA(t-n)) / n
Where:
n is the length of the lookback period. Positive slope indicates bullish momentum, while negative slope signals bearish momentum.
LOCAL picture
🔶 Entry and Exit Conditions
- Long Entry: Occurs when the price moves above the slow VIDYA and the fast VIDYA is trending upward. Bollinger Bands confirm the signal when the price crosses the upper band, indicating bullish strength.
- Short Entry: Happens when the price drops below the slow VIDYA and the fast VIDYA trends downward. The signal is confirmed when the price crosses the lower Bollinger Band, showing bearish momentum.
- Exit: Based on VIDYA slopes flattening or reversing, or when the price hits specific ATR or percentage-based profit targets.
🔶 Multi-Step Take Profit Mechanism
The strategy incorporates three levels of take profit for both long and short trades:
- ATR-based Take Profit: Each step applies a multiple of the ATR (Average True Range) to the entry price to define the exit point.
The first level of take profit (long):
TP_ATR1_long = Entry Price + (2.618 * ATR)
etc.
█ Trade Direction
The strategy offers flexibility in defining the trading direction:
- Long: Only long trades are considered based on the criteria for upward trends.
- Short: Only short trades are initiated in bearish trends.
- Both: The strategy can take both long and short trades depending on the market conditions.
█ Usage
To use the strategy effectively:
- Adjust the VIDYA lengths (fast and slow) based on your preference for trend sensitivity.
- Use Bollinger Bands as a filter for identifying potential breakout or reversal scenarios.
- Enable the multi-step take profit feature to manage positions dynamically, allowing for partial exits as the price reaches specified ATR or percentage levels.
- Leverage the short trade multiplier for more aggressive take profit levels in bearish markets.
This strategy can be applied to different asset classes, including equities, forex, and cryptocurrencies. Adjust the input parameters to suit the volatility and characteristics of the asset being traded.
█ Default Settings
The default settings for this strategy have been designed for moderate to trending markets:
- Fast VIDYA Length (10): A shorter length for quick responsiveness to price changes. Increasing this length will reduce noise but may delay signals.
- Slow VIDYA Length (30): The slow VIDYA is set longer to capture broader market trends. Shortening this value will make the system more reactive to smaller price swings.
- Minimum Slope Threshold (0.05): This threshold helps filter out weak trends. Lowering the threshold will result in more trades, while raising it will restrict trades to stronger trends.
Multi-Step Take Profit Settings
- ATR Multipliers (2.618, 5.0, 10.0): These values define how far the price should move before taking profit. Larger multipliers widen the profit-taking levels, aiming for larger trend moves. In higher volatility markets, these values might be adjusted downwards.
- Percentage Levels (3%, 8%, 17%): These percentage levels define how much the price must move before taking profit. Increasing the percentages will capture larger moves, while smaller percentages offer quicker exits.
- Short TP Multiplier (1.5): This multiplier applies more aggressive take profit levels for short trades. Adjust this value based on the aggressiveness of your short trade management.
Each of these settings directly impacts the performance and risk profile of the strategy. Shorter VIDYA lengths and lower slope thresholds will generate more trades but may result in more whipsaws. Higher ATR multipliers or percentage levels can delay profit-taking, aiming for larger trends but risking partial gains if the trend reverses too early.

Theoretical price by volumeThis code is used to calculate a theoretical price range based on volume and price change and display it on the chart. Specifically, it calculates the “theoretical price volatility” based on price changes and volume, from which the upper and lower price limits are derived.
The price volatility is calculated by dividing the price change by the volume as the change unit volume.
Based on this volatility, we calculate the theoretical variation relative to the current price (“Theoretical Variance Difference”).
Based on the results, **Theoretical High Price (p_price) and Theoretical Low Price (m_price)** are calculated.
The chart displays the upper and lower bounds of these theoretical prices in color, and also calculates their mean and standard deviation (in the form of a Bollinger band) and plots them.
The background color on the chart indicates whether the price is within the theoretical price range, and at the same time, the mean and standard deviation of the theoretical prices are used to visualize price movements in more detail.
This indicator helps traders understand the impact of volume on price movements and helps them determine if prices are staying within the theoretical range or if there are unusual movements.
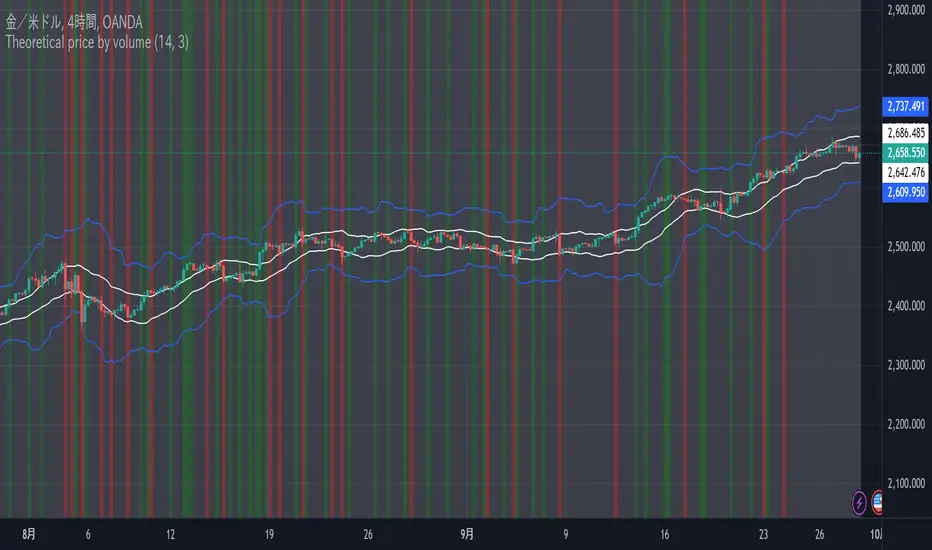
Bitcoin CME-Spot Z-Spread - Strategy [presentTrading]This time is a swing trading strategy! It measures the sentiment of the Bitcoin market through the spread of CME Bitcoin Futures and Bitfinex BTCUSD Spot prices. By applying Bollinger Bands to the spread, the strategy seeks to capture mean-reversion opportunities when prices deviate significantly from their historical norms
█ Introduction and How it is Different
The Bitcoin CME-Spot Bollinger Bands Strategy is designed to capture mean-reversion opportunities by exploiting the spread between CME Bitcoin Futures and Bitfinex BTCUSD Spot prices. The strategy uses Bollinger Bands to detect when the spread between these two correlated assets has deviated significantly from its historical norm, signaling potential overbought or oversold conditions.
What sets this strategy apart is its focus on spread trading between futures and spot markets rather than price-based indicators. By applying Bollinger Bands to the spread rather than individual prices, the strategy identifies price inefficiencies across markets, allowing traders to take advantage of the natural reversion to the mean that often occurs in these correlated assets.
BTCUSD 8hr Performance
█ Strategy, How It Works: Detailed Explanation
The strategy relies on Bollinger Bands to assess the volatility and relative deviation of the spread between CME Bitcoin Futures and Bitfinex BTCUSD Spot prices. Bollinger Bands consist of a moving average and two standard deviation bands, which help measure how much the spread deviates from its historical mean.
🔶 Spread Calculation:
The spread is calculated by subtracting the Bitfinex spot price from the CME Bitcoin futures price:
Spread = CME Price - Bitfinex Price
This spread represents the difference between the futures and spot markets, which may widen or narrow based on supply and demand dynamics in each market. By analyzing the spread, the strategy can detect when prices are too far apart (potentially overbought or oversold), indicating a trading opportunity.
🔶 Bollinger Bands Calculation:
The Bollinger Bands for the spread are calculated using a simple moving average (SMA) and the standard deviation of the spread over a defined period.
1. Moving Average (SMA):
The simple moving average of the spread (mu_S) over a specified period P is calculated as:
mu_S = (1/P) * sum(S_i from i=1 to P)
Where S_i represents the spread at time i, and P is the lookback period (default is 200 bars). The moving average provides a baseline for the normal spread behavior.
2. Standard Deviation:
The standard deviation (sigma_S) of the spread is calculated to measure the volatility of the spread:
sigma_S = sqrt((1/P) * sum((S_i - mu_S)^2 from i=1 to P))
3. Upper and Lower Bollinger Bands:
The upper and lower Bollinger Bands are derived by adding and subtracting a multiple of the standard deviation from the moving average. The number of standard deviations is determined by a user-defined parameter k (default is 2.618).
- Upper Band:
Upper Band = mu_S + (k * sigma_S)
- Lower Band:
Lower Band = mu_S - (k * sigma_S)
These bands provide a dynamic range within which the spread typically fluctuates. When the spread moves outside of these bands, it is considered overbought or oversold, potentially offering trading opportunities.
Local view
🔶 Entry Conditions:
- Long Entry: A long position is triggered when the spread crosses below the lower Bollinger Band, indicating that the spread has become oversold and is likely to revert upward.
Spread < Lower Band
- Short Entry: A short position is triggered when the spread crosses above the upper Bollinger Band, indicating that the spread has become overbought and is likely to revert downward.
Spread > Upper Band
🔶 Risk Management and Profit-Taking:
The strategy incorporates multi-step take profits to lock in gains as the trade moves in favor. The position is gradually reduced at predefined profit levels, reducing risk while allowing part of the trade to continue running if the price keeps moving favorably.
Additionally, the strategy uses a hold period exit mechanism. If the trade does not hit any of the take-profit levels within a certain number of bars, the position is closed automatically to avoid excessive exposure to market risks.
█ Trade Direction
The trade direction is based on deviations of the spread from its historical norm:
- Long Trade: The strategy enters a long position when the spread crosses below the lower Bollinger Band, signaling an oversold condition where the spread is expected to narrow.
- Short Trade: The strategy enters a short position when the spread crosses above the upper Bollinger Band, signaling an overbought condition where the spread is expected to widen.
These entries rely on the assumption of mean reversion, where extreme deviations from the average spread are likely to revert over time.
█ Usage
The Bitcoin CME-Spot Bollinger Bands Strategy is ideal for traders looking to capitalize on price inefficiencies between Bitcoin futures and spot markets. It’s especially useful in volatile markets where large deviations between futures and spot prices occur.
- Market Conditions: This strategy is most effective in correlated markets, like CME futures and spot Bitcoin. Traders can adjust the Bollinger Bands period and standard deviation multiplier to suit different volatility regimes.
- Backtesting: Before deployment, backtesting the strategy across different market conditions and timeframes is recommended to ensure robustness. Adjust the take-profit steps and hold periods to reflect the trader’s risk tolerance and market behavior.
█ Default Settings
The default settings provide a balanced approach to spread trading using Bollinger Bands but can be adjusted depending on market conditions or personal trading preferences.
🔶 Bollinger Bands Period (200 bars):
This defines the number of bars used to calculate the moving average and standard deviation for the Bollinger Bands. A longer period smooths out short-term fluctuations and focuses on larger, more significant trends. Adjusting the period affects the responsiveness of the strategy:
- Shorter periods (e.g., 100 bars): Makes the strategy more reactive to short-term market fluctuations, potentially generating more signals but increasing the risk of false positives.
- Longer periods (e.g., 300 bars): Focuses on longer-term trends, reducing the frequency of trades and focusing only on significant deviations.
🔶 Standard Deviation Multiplier (2.618):
The multiplier controls how wide the Bollinger Bands are around the moving average. By default, the bands are set at 2.618 standard deviations away from the average, ensuring that only significant deviations trigger trades.
- Higher multipliers (e.g., 3.0): Require a more extreme deviation to trigger trades, reducing trade frequency but potentially increasing the accuracy of signals.
- Lower multipliers (e.g., 2.0): Make the bands narrower, increasing the number of trade signals but potentially decreasing their reliability.
🔶 Take-Profit Levels:
The strategy has four take-profit levels to gradually lock in profits:
- Level 1 (3%): 25% of the position is closed at a 3% profit.
- Level 2 (8%): 20% of the position is closed at an 8% profit.
- Level 3 (14%): 15% of the position is closed at a 14% profit.
- Level 4 (21%): 10% of the position is closed at a 21% profit.
Adjusting these take-profit levels affects how quickly profits are realized:
- Lower take-profit levels: Capture gains more quickly, reducing risk but potentially cutting off larger profits.
- Higher take-profit levels: Let trades run longer, aiming for bigger gains but increasing the risk of price reversals before profits are locked in.
🔶 Hold Days (20 bars):
The strategy automatically closes the position after 20 bars if none of the take-profit levels are hit. This feature prevents trades from being held indefinitely, especially if market conditions are stagnant. Adjusting this:
- Shorter hold periods: Reduce the duration of exposure, minimizing risks from market changes but potentially closing trades too early.
- Longer hold periods: Allow trades to stay open longer, increasing the chance for mean reversion but also increasing exposure to unfavorable market conditions.
By understanding how these default settings affect the strategy’s performance, traders can optimize the Bitcoin CME-Spot Bollinger Bands Strategy to their preferences, adapting it to different market environments and risk tolerances.

Uptrick: Market MoodsThe "Uptrick: Market Moods" indicator is an advanced technical analysis tool designed for the TradingView platform. It combines three powerful indicators—Relative Strength Index (RSI), Average True Range (ATR), and Bollinger Bands—into one cohesive framework, aimed at helping traders better understand and interpret market sentiment. By capturing shifts in the emotional climate of the market, it provides a holistic view of market conditions, which can range from calm to stressed or even highly excited. This multi-dimensional analysis tool stands apart from traditional single-indicator approaches by offering a more complete picture of market dynamics, making it a valuable resource for traders looking to anticipate and react to changes in market behavior.
The RSI in the "Uptrick: Market Moods" indicator is used to measure momentum. RSI is an essential component of many technical analysis strategies, and in this tool, it is used to identify potential market extremes. When RSI values are high, they indicate an overbought condition, meaning the market may be approaching a peak. Conversely, low RSI values suggest an oversold condition, signaling that the market could be nearing a bottom. These extremes provide crucial clues about shifts in market sentiment, helping traders gauge whether the current emotional state of the market is likely to result in a reversal. This understanding is pivotal in predicting whether the market is transitioning from calm to stressed or from excited to overbought.
The Average True Range adds another layer to this analysis by offering insights into market volatility. Volatility is a key factor in understanding the mood of the market, as periods of high volatility often reflect high levels of excitement or stress, while low volatility typically indicates a calm, steady market. ATR is calculated based on the range of price movements over a given period, and the higher the value, the more volatile the market is. The "Uptrick: Market Moods" indicator uses ATR to dynamically gauge volatility levels, helping traders understand whether the market is currently moving in a way that aligns with its emotional mood. For example, an increase in ATR accompanied by an RSI value that indicates overbought conditions could suggest that the market is in a highly excited state, with the potential for either strong momentum continuation or a sharp reversal.
Bollinger Bands complement these tools by providing visual cues about price volatility and the range within which the market is likely to move. Bollinger Bands plot two standard deviations away from a simple moving average of the price. This banding technique helps traders visualize how far the price is likely to deviate from its average over a certain period. The "Uptrick: Market Moods" indicator uses Bollinger Bands to establish price boundaries and identify breakout conditions. When prices break above the upper band or below the lower band, it often signals that the market is either highly stressed or excited. This breakout condition serves as a visual representation of the market mood, alerting traders to moments when prices are moving beyond typical ranges and when significant emotional shifts are occurring in the market.
Technically, the "Uptrick: Market Moods" indicator has been developed using TradingView’s Pine Script language, a highly efficient language for building custom indicators. It employs functions like ta.rsi, ta.atr, and ta.sma to perform the necessary calculations. The use of these built-in functions ensures that the calculations are both accurate and efficient, allowing the indicator to operate in real-time without lagging, even in volatile market conditions. The ta.rsi function is used to compute the Relative Strength Index, while ta.atr calculates the Average True Range, and ta.sma is used to smooth out price data for the Bollinger Bands. These functions are applied dynamically within the script, allowing the "Uptrick: Market Moods" indicator to respond to changes in market conditions in real time.
The user interface of the "Uptrick: Market Moods" indicator is designed to provide a visually intuitive experience. The market mood is color-coded on the chart, making it easy for traders to identify whether the market is calm, stressed, or excited at a glance. This feature is especially useful for traders who need to make quick decisions in fast-moving markets. Additionally, the indicator includes an interactive table that updates in real-time, showing the most recent mood state and its frequency. This provides valuable statistical insights into market behavior over specific time frames, helping traders track the dominant emotional state of the market. Whether the market is in a prolonged calm state or rapidly transitioning through moods, this real-time feedback offers actionable data that can help traders adjust their strategies accordingly.
The RSI component of the "Uptrick: Market Moods" indicator helps detect the speed and direction of price movements, offering insight into whether the market is approaching extreme conditions. By providing signals based on overbought and oversold levels, the RSI helps traders decide whether to enter or exit positions. The ATR element acts as a volatility gauge, dynamically adjusting traders’ expectations in response to changes in market volatility. Meanwhile, the Bollinger Bands help identify trends and potential breakout conditions, serving as an additional confirmation tool that highlights when the price has moved beyond normal boundaries, indicating heightened market excitement or stress.
Despite the robust capabilities of the "Uptrick: Market Moods" indicator, it does have limitations. In markets affected by sudden shifts, such as those driven by major news events or external economic factors, the indicator’s performance may not always be reliable. These external factors can cause rapid mood swings that are difficult for any technical analysis tool to fully anticipate. Additionally, the indicator’s complexity may pose a learning curve for novice traders, particularly those who are unfamiliar with the concepts of RSI, ATR, and Bollinger Bands. However, with practice, traders can become proficient in using the tool to its full potential, leveraging the insights it provides to better navigate market shifts.
For traders seeking a deeper understanding of market sentiment, the "Uptrick: Market Moods" indicator is an invaluable resource. It is recommended for those dealing with medium to high volatility instruments, where understanding emotional shifts can offer a strategic advantage. While it can be used on its own, integrating it with other forms of analysis, such as fundamental analysis and additional technical indicators, can enhance its effectiveness. By confirming signals with other tools, traders can reduce the likelihood of false signals and improve their overall trading strategy.
To further enhance the accuracy of the "Uptrick: Market Moods" indicator, it can be integrated with volume-based tools like Volume Profile or On-Balance Volume (OBV). This combination allows traders to confirm the moods identified by the indicator with volume data, providing additional confirmation of market sentiment. For example, when the market is in an excited mood, an increase in trading volume could reinforce the reliability of that signal. Conversely, if the market is stressed but volume remains low, traders may want to proceed with caution. Using multiple indicators together creates a more comprehensive trading approach, helping traders better manage risk and make informed decisions based on multiple data points.
In conclusion, the "Uptrick: Market Moods" indicator is a powerful and unique addition to the suite of technical analysis tools available on TradingView. It provides traders with a multi-dimensional view of market sentiment by combining the analytical strengths of RSI, ATR, and Bollinger Bands into a single tool. Its ability to capture and interpret the emotional mood of the market makes it an essential tool for traders seeking to gain an edge in understanding market behavior. While the indicator has certain limitations, particularly in rapidly shifting markets, its ability to provide real-time insights into market sentiment is a valuable asset for traders of all experience levels. Used in conjunction with other tools and sound trading practices, the "Uptrick: Market Moods" indicator offers a comprehensive solution for navigating the complexities of financial markets.
