OB EmaCross + BBThis is my setup and the way I like to trade.
It is based in an EMA cross ( 9 x 21) and the Bollinger Bands without the central Moving Average.
I prefer to use the EMA cross in the middle of the bands.
It is also possible to activate "Colored Bars" to paint the candles according to the EMA cross: green if the candles are above both EMAs, white when at least one of them are in between EMAs and red if they are both below EMAs.
My operational works like this:
- Buy when price is above EMAs
- Sell when price is belos EMAs
Of course, I use BB to give me the direction of the trend and I only enter in a trade when the price is in the same trend of the BB.
I avoid trades when the bands are getting narrowed.
I hope you enjoy my indicator and let me know if you have any suggestion! ;)
Cerca negli script per "bollingerband"

K's Reversal Indicator IK's reversal indicator I is a special combination between Bollinger bands and the MACD oscillator. It is a contrarian indicator that depends on the following conditions:
• A buy signal is generated whenever the current market price is below the 100-period lower Bollinger band while simultaneously, the MACD value must be above its signal line. At the same time, the previous MACD value must be below its previous signal line.
• A sell (short) signal is generated whenever the current market price is above the 100-period upper Bollinger band while simultaneously, the MACD value must be below its signal line. At the same time, the previous MACD value must be above its previous signal line.
The way to use K's reversal indicator is to combine it with your already long/short bias in a sideways/range market in order to maximize the probability of success.
Limitations of the indicator include the following:
• There are no clear exit rules that work well on average across the markets. Even though K’s reversal indicator gives contrarian signals, it does not show when to exit the positions.
• As with other indicators, it underperforms on some markets and is not to be used everywhere.
• False signals tend to occur during trending markets but there is no proven way to detect a false signal.

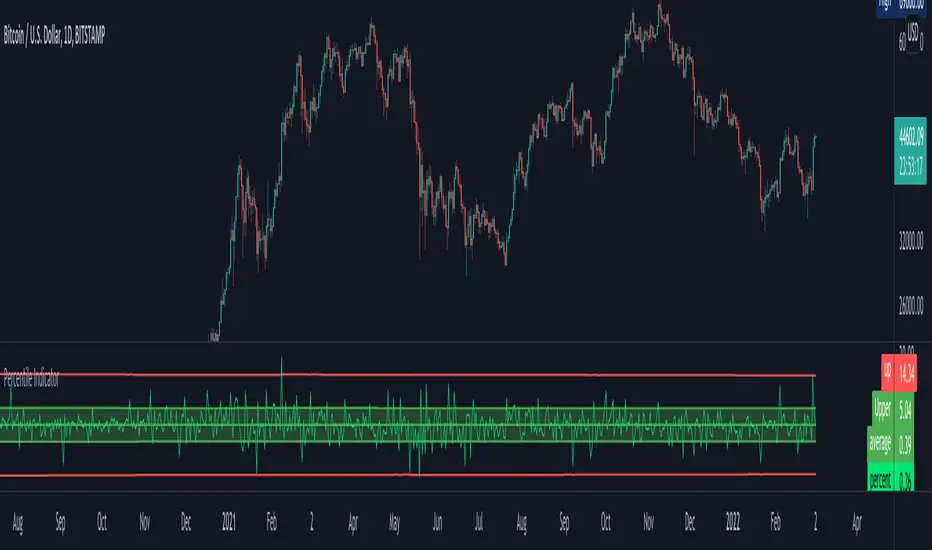
Percentile Major Move Indicator This indicator is a powerful tool for understanding how big of a move a product, crypto, or currency has recently had.
Anything inside of the green bars is a standard move with a 68% chance of happening based on your chart timeframe.
Any move that touches the red lines to the upside or downside has a 2%+ chance of happening in either direction.
This is a powerful indicator but just one point of data and should be used as such.
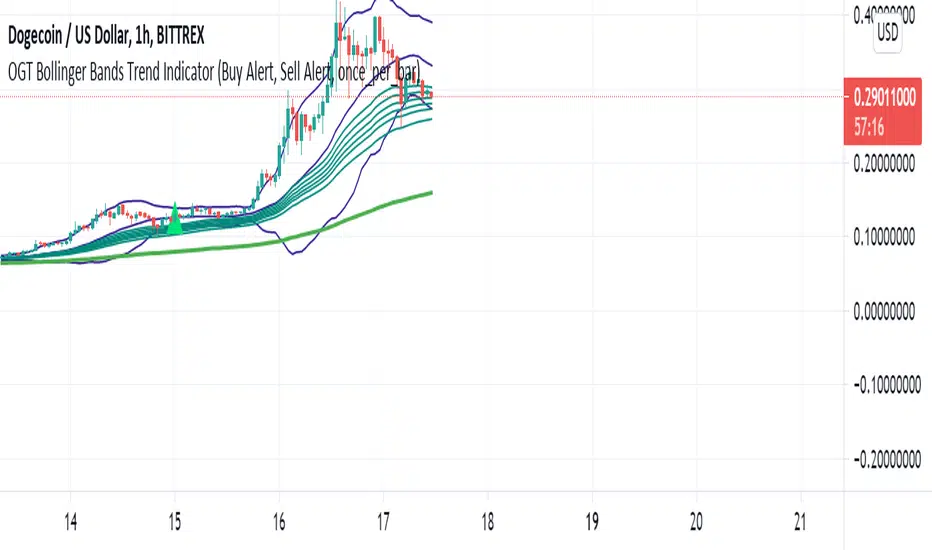
OGT Bollinger Bands Trend IndicatorWhat Is The OGT Bollinger Bands Trend Indicator?
This indicator is a pullback trend trading indicator which uses the following indicators:
- 200 EMA - Long Term Trend Direction
- 30, 35, 40, 45, 50, 60 EMAs - Shorter Term Trend Direction
- Bollinger Bands - Pullback / Entry Signal
How Are Signals Generated?
Buy
- Price above the 200 EMA
- Price touches lower BB with shorter term EMAs all aligned (not crossed)
- Indicator waits for price to close above midpoint BB with shorter term EMAs all still aligned (not crossed)
Sell
- Price below the 200 EMA
- Price touches upper BB with shorter term EMAs all aligned (not crossed)
- Indicator waits for price to close above midpoint BB with shorter term EMAs all still aligned (not crossed)
Alerts function built in, input settings customisable to show/not show indicators and change colours.
Beacon - Anthony Crudele's IndicatorBeacon uses the current volatility of the market based on your trading time frame to determine support and resistance levels, whether a trend is intact or ready to revert back in the range. One of the most difficult things I went through as a trader was determining whether we are in a trend day or if we are in grind up or grind down mode. I created Beacon to give me a simple look at the market to determine what type of environment we are in. I use Bollinger Bands (3 standard deviation) to determine the volatility cycle. Once the BB make peaks I took my Fibonacci Retracement tool and did a retracement from the peak high of the BB to the peak low. I use 70%, 50% and 30% for my support and resistance levels. I use those levels because I tested pretty much every percent level and those percentages averaged the highest performance on all tick charts and time charts. You can use Beacon on whatever time frame or tick chart you are trading on and it will determine that specific volatility cycle.

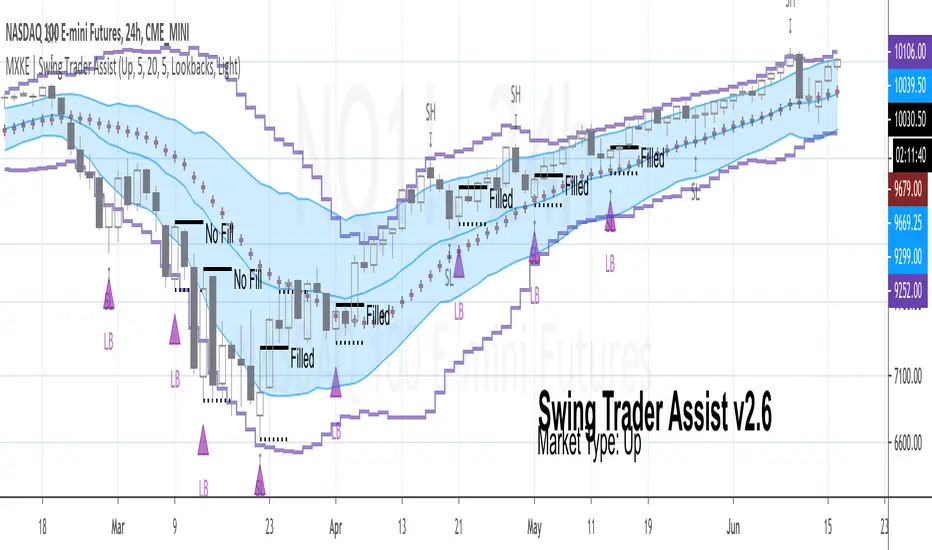
MXKE | Swing Trader AssistIntroduction
Swing Trader Assist indicator is designed to assist in the systematic identification of Hammers & Lookback signals within Uptrending markets, Stars & Lookback signals within Downtrending markets, and Mean Reversion signals within Sideways markets. The trader must first identify a strong market trend, then apply the indicator. Application of the indicator to weak trends will render equally weak signals. Application of the indicator to strong trends will render equally strong signals. Identification of strong trends is the responsibility of the individual trader and is instrumental to the successful deployment of this indicator and accompanying trading plan.
*Please comment below to request access*
*Please share with me on Twitter your usage and/or ideas for improvement so that I may improve this indicator in the future*
Market Types
Uptrend: Higher highs + Higher lows
Downtrend: Lower highs + Lower lows
Sideways: Higher highs + Lower lows (Expanding Range) or Lower highs + Higher lows (Narrowing Range)
Position Sizing
1R = .25%-2% of total nominal capital dependent upon timeframe and risk appetite
Order Types
Entry: Buy Stop 1 tick above High of “Up” Signal Bars; Sell Stop 1 tick below Low of “Down” Signal Bars
Stop: Bar Close <= 1 tick below Low of “Up” Signal Bar; Bar Close >= 1 tick above High of “Down” Signal Bar
Profit Target: 1.5R distance from “Up” or “Down” fill level with the option to trail stop on each new swing high/low; Bollinger Band Midline minimum 1.5R distance from “Sideways” fill level with option to trail stop on continuation to the opposite end of the range (opposite Bollinger Band)
Trading Plan
❑ Market Type is clearly identifiable as Up, Down or Sideways
❑ Swing Trader Assist indicator is set to the corresponding Market Type: Up, Down or Sideways
❑ Position size is no more than .25%-2% of total nominal capital (based on distance from Signal Bar fill level to Signal Bar stop level as 1R)
❑ Distance from Signal Bar fill level to potential Profit Target is minimum 1.5R
❑ On Hammer or Star fill: close position into trend extension at 1.5R+ or adjust trailing stop on each new swing high/low
❑ On Mean Reversion fill: close position at midline or adjust trailing stop on each continuation to opposite end of range
Usage Notes
The indicator will display developing signals intrabar and it is therefore suggested to wait until bar close to act on any signals. “Autodetect” setting under “Market Type” is currently in beta mode. While it is designed to reveal only relevant signals within strong trends based on a series of EMAs, this setting has not been extensively tested. Use with caution.
The indicator is not meant to be a mechanical trading system. It is designed to assist the trader in objectively and systematically identifying signal bars during the execution of the below swing trading plan. It is up to the trader to determine if overall price action warrants acting upon the signal bars or not.
Case Studies


Calendar's Bollinger BandsHI guys, I'm Calendar
I made my 2nd indicator for my followers.
This indicator made by merging 2 Bollinger Bands.(SDV =1, 2)

Bollinger Band Open Gap Alert V1This is the bare bones of what I'm trying to achieve through pine script. The purpose of the script is to:
1. On a 15m chart, calculate and plot upper & lower Bollinger bands and simple moving average of 20 periods. (DONE)
2. On a new day, when the first 15m candle of a session forms, I want to check if a) the low of the new candle is outside the upper Bollinger band (also known as an open gap up) or b) if the high of the candle is the outside the lower Bollinger band (also known as open gap down). In other words, I want to know if the Bollinger Bands are not touching the new candle's wicks/shadows. (DONE)
3. Alert me if the above happens. (DONE)
4. Run the indicator through an entire watch list. I'm not sure if that's possible, yet. (HELP)
For the above job, this is what I could come up with. I need guidance for the last step . And any suggestions for corrections or improvements would be greatly appreciated!
Intraday Volatility Map (Bajrang Bali Indicator)Indicator Name
Bollinger Bands on Historical Volatility (BB-HV) – Intraday Volatility Map
Concept
This indicator applies Bollinger Bands directly on Historical Volatility (HV) instead of price.
HV tells you the “energy” behind the move
Bollinger Bands on HV tell you when volatility is compressing or expanding
Works on all intraday timeframes for indices and stocks
You are not watching price alone — you are watching the strength behind price movement .
---
Core Logic
Historical Volatility is calculated using log returns, annualized
Bollinger Bands are plotted on the HV line (separate pane)
Upper/Lower bands show volatility expansion or contraction
User inputs: HV length, BB length, BB multiplier
---
What This Indicator Shows
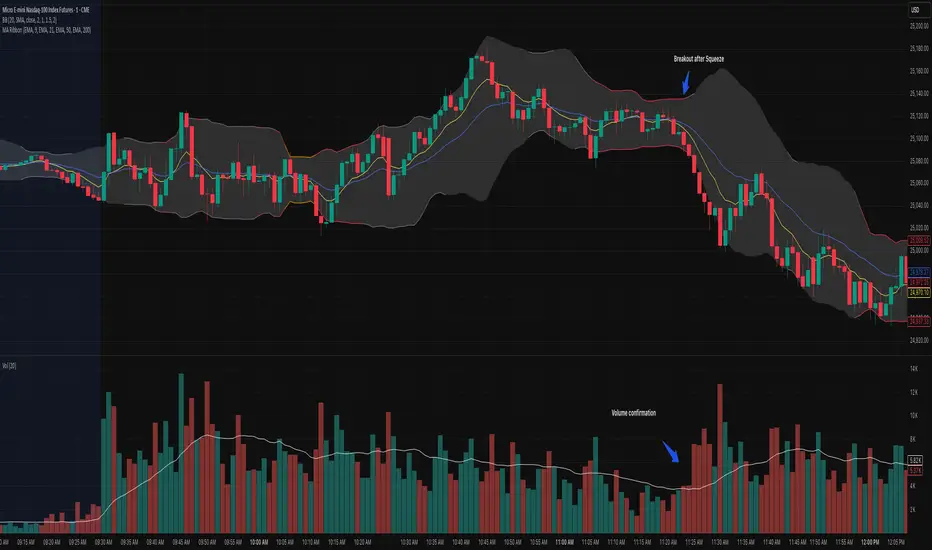
Volatility Squeeze (Low HV) – HV stays below lower BB → quiet market, breakout coming
Volatility Expansion (High HV) – HV breaches upper BB → trend day or news-driven move
Normal Regime – HV oscillates between bands → balanced intraday structure
---
How to Use – Indices (NIFTY / BankNifty)
Trend Day Detection – Early HV breakout above upper band suggests strong directional movement
Range Day Identification – HV hugging lower band implies consolidation and mean reversion
Event Risk Mapping – Sudden HV spikes warn of macro data, gaps, policy events
---
How to Use – Stocks
Stock Selection – Choose stocks where HV is rising above mid-band → active, tradable
Entry Confirmation – Breakouts with rising HV have stronger follow-through
Risk Management – High HV → wide stops, low size; Low HV → tight stops, fakeouts possible
---
Signals Generated (For Alerts)
Squeeze Signal – HV < lower band for a set number of bars
Expansion Signal – HV crossing above upper band
Reversion Signal – HV falls back inside bands after a volatility spike
---
Best Timeframes
1m, 3m, 5m, 15m intraday
Works best on indices and liquid stocks
---
Suggested Inputs
HV Length: 20
BB Length: 20
BB Multiplier: 2.0
Squeeze Bars: 5–10
Expansion Filter: HV closing above upper band
---
Who Should Use This Indicator?
Scalpers – Identify high-energy zones
Day Traders – Ride trend days via volatility regime shifts
Option Traders – Read intraday realized volatility patterns
---
Trading Notes
This is a volatility-regime tool, not a buy/sell signal generator
Works best when combined with VWAP, structure, volume, or trend indicators
Always use personal judgment and risk management
---
Disclaimer
This script is for educational and research use only. It does not provide investment advice or guaranteed trading outcomes. Use at your own risk.

BB TrendDisclaimer: This Script works on daily chart for stocks. No SELL signal offered.
How to Use:
If BUY signal is shown on the chart, please take entry in the beginning of next candle.
please comment, if you find this useful.

Multi-Asset Option Strike PricesMulti-Asset Option Strike Prices automatically plots dynamic option strike levels for multiple assets on your chart. The indicator detects the active symbol and draws strike ladders above and below the current price using customizable strike increments (FX, indices, commodities, metals, etc.).
It also rounds price to the nearest strike, giving a precise structural reference used by institutional options desks. These strike levels help traders visualize trend direction, trend boundaries, and potential turning points based on how price interacts with known option clusters.
By mapping evenly spaced strike steps, the indicator also highlights natural stop-loss and take-profit zones within a trend, allowing traders to manage risk around predictable option-driven price levels.
Supports up to 10 assets, includes custom line styling, and provides automatic strike labeling.

BB Breakout + EMA Touch (50/100)Shows points only when BOTH happen on the same candle:
1️⃣ Price breaks through Bollinger Bands
2️⃣ Price touches (or crosses) EMA 50 or EMA 100

Bollinger Bands (MTF) + Bandwidth & %BJBB MTF: Bollinger Bands (MTF) + Bandwidth & %B
This Pine v6 indicator overlays multi‑timeframe Bollinger Bands on the price chart and adds a lower panel with normalized Bandwidth (histogram) and %B (line), plus squeeze/bulge markers and alerts for volatility shifts.
Key idea: See higher‑timeframe BB context on your working chart while tracking volatility regimes and price position within bands.
Features
- Multi‑Timeframe BBs: Up to four TFs (TF1–TF4) via request.security, each with visibility, colors, line widths, and optional background fills.
- Configurable Inputs: Length, MA type (SMA/EMA/SMMA/WMA/VWMA), Source, StdDev multiplier, and Offset.
- Lower Panel Metrics: %B (line) shows price position in the band; Bandwidth (histogram) shows width relative to basis, normalized and color‑coded vs its SMA. Reference lines at 0, 0.5, 1.0; raw highest/lowest bandwidth lines for context.
- Squeeze/Bulge Detection: Alerts when bandwidth equals the rolling lowest (Squeeze) or highest (Bulge).
How It Works
- Per timeframe, BBs use the chosen MA basis and standard deviation × multiplier to form upper/lower bands.
- A selectable TF (TF1–TF4) drives %B/Bandwidth calculations, independent of overlay TFs.
Bandwidth is normalized to the rolling min–max window with safeguards against division by zero.
Use Cases
- Visualize higher‑timeframe context directly on your chart.
- Spot volatility squeezes and expansions with objective markers and alerts.
Combine %B momentum with Bandwidth regime changes to refine entries and exits.

XAUUSD Pro Setup Suite manuel_lnt.fx is an advanced Pine Script v6 indicator designed exclusively for XAUUSD, built to automatically detect the 5 highest-probability setups in gold day trading.
It combines institutional price action, volatility patterns, mean reversion logic, and momentum confirmation to generate clean, filtered, and actionable signals.
The indicator automatically detects:
⸻
1️⃣ Break & Retest Premium (BR)
Identifies valid breaks of key levels and signals the retest with rejection wick, EMA20 trend confirmation, and neutral RSI.
→ Excellent for trend continuation.
⸻
2️⃣ Fakeout Liquidity Trap (FO)
Detects liquidity grabs above highs or below lows with an opposite close + engulfing candle confirmation.
→ The strongest setup for fast and explosive reversals on gold.
⸻
3️⃣ MACD Zero-Line Shift (MACD)
Signals when the MACD crosses the zero line while price breaks micro-structure.
→ Perfect for spotting the start of a new trend.
⸻
4️⃣ Bollinger Squeeze → Breakout (BB)
Recognizes volatility compression and signals when a breakout is likely to explode.
→ Ideal for clean breakout trades.
⸻
5️⃣ Mean Reversion on EMA50 (MR)
Highlights price extensions far away from the EMA50 with ATR confirmation and a reversal candle.
→ Great for pullbacks back toward the mean value.

Squeeze Go Momentum Pro [KingThies] █ OVERVIEW
The Squeeze Momentum Pro indicator identifies volatility compression phases and breakout opportunities by comparing Bollinger Bands to Keltner Channels. When price consolidates (squeeze), the bands contract inside the channels, signaling an imminent breakout. The momentum histogram shows directional bias, helping traders anticipate which way price will move when the squeeze releases.
This indicator displays in a separate panel below the price chart, providing clear visual signals without cluttering price action.
█ KEY FEATURES
Momentum Histogram
The histogram is the primary visual element, displaying momentum strength and direction with four distinct color states:
• Dark Green (#00C853) — Strong bullish momentum that is increasing. This signals strengthening upward pressure and potential continuation.
• Light Green (#26A69A) — Bullish momentum that is decreasing. Price remains in bullish territory but upward force is weakening.
• Dark Red (#D32F2F) — Strong bearish momentum that is increasing. This signals strengthening downward pressure and potential continuation.
• Light Red (#EF5350) — Bearish momentum that is decreasing. Price remains in bearish territory but downward force is weakening.
The color intensity provides immediate feedback on momentum strength and trend health.
Squeeze State Indicator
Colored dots on the zero line communicate the current volatility state:
• Orange Dots — Squeeze is ON. Bollinger Bands have contracted inside Keltner Channels, indicating consolidation and low volatility.
A breakout is building and traders should prepare for directional movement.
• Green Dots — Squeeze is OFF. Bollinger Bands have expanded outside Keltner Channels, indicating active momentum and higher volatility.
Price is moving with conviction in the current direction.
• Gray Dots — Neutral state. The bands are transitioning between squeeze states.
Release Triangles
Triangle shapes mark the exact bar when a squeeze releases, providing precise entry timing:
• Green Triangle Up — Bullish squeeze release. The squeeze has ended with positive momentum, suggesting a long setup opportunity.
• Red Triangle Down — Bearish squeeze release. The squeeze has ended with negative momentum, suggesting a short setup opportunity.
Information Panel
A compact dashboard in the top-right corner displays real-time trading intelligence:
• Squeeze Status — Current state: ON, OFF, or NEUTRAL with color coding
• Momentum Direction — Current bias: BULL or BEAR
• Momentum Value — Precise numerical reading of momentum strength
• Trading Signal — Actionable status: LONG SETUP, SHORT SETUP, WAIT, or MONITOR
Configurable Parameters
All calculation inputs are adjustable to match your trading style and timeframe:
• BB Length — Bollinger Bands period (default: 20)
• BB StdDev — Bollinger Bands standard deviation multiplier (default: 2.0)
• KC Length — Keltner Channels period (default: 20)
• KC ATR Multiplier — Keltner Channels range multiplier (default: 1.5)
• Momentum Length — Linear regression period for momentum calculation (default: 20)
Alert System
Four alert conditions notify you of critical trading opportunities:
• Bullish Squeeze Release — Squeeze has released with bullish momentum, indicating a potential long entry
• Bearish Squeeze Release — Squeeze has released with bearish momentum, indicating a potential short entry
• Squeeze Started — Volatility compression detected, prepare for upcoming breakout
• Squeeze Ended — Volatility expansion confirmed, breakout is active
█ TRADING METHODOLOGY
The indicator follows a clear four-step process for identifying and trading squeeze breakouts:
1 - Wait for Orange Dots . When orange dots appear on the zero line, a squeeze is building. This indicates price consolidation and declining volatility.
Do not enter trades during this phase. Instead, prepare by identifying key support and resistance levels and potential breakout directions.
2 - Watch for Release Triangle . When a triangle appears, the squeeze has released and a breakout is beginning. This is your entry signal.
The triangle color (green up or red down) combined with the histogram direction indicates the breakout direction.
3 - Confirm with Histogram Direction . Check the momentum histogram for directional confirmation:
• Green histogram + green triangle up = Go long. Bullish momentum supports upward breakout.
• Red histogram + red triangle down = Go short. Bearish momentum supports downward breakout.
4 - Monitor Momentum Intensity . Stay in the trade while histogram bars maintain their dark, intense color.
When colors lighten (dark green to light green, or dark red to light red), momentum is weakening and you should consider taking profits or tightening stops.
█ INTERPRETATION GUIDE
Squeeze Detection Logic
A squeeze occurs when Bollinger Bands contract inside Keltner Channels. This happens when:
• Standard deviation of price decreases (BB narrows)
• Price consolidates within a tight range
• Volatility compresses to unsustainable levels
The orange dots signal this condition, warning traders that explosive movement is imminent.
Squeeze Release Logic
A squeeze releases when Bollinger Bands expand outside Keltner Channels. This happens when:
• Price volatility increases sharply
• Price breaks out of consolidation
• Volume typically expands (check volume separately)
The green dots and release triangles signal this condition, indicating the direction and timing of the breakout.
Momentum Reading
The histogram uses linear regression to calculate momentum relative to the midpoint of the recent range:
• Above Zero : Price is trading above the range midpoint with bullish pressure
• Below Zero : Price is trading below the range midpoint with bearish pressure
• Increasing Bars : Momentum is strengthening in the current direction (darker color)
• Decreasing Bars : Momentum is weakening in the current direction (lighter color)
█ BEST PRACTICES
• Timeframe Selection — The indicator works on all timeframes but performs best on 15-minute to daily charts.
Lower timeframes may produce more false signals due to noise.
• Confluence Trading — Combine squeeze releases with support/resistance levels, trend lines, or other indicators for higher probability setups.
• Volume Confirmation — Check that squeeze releases occur with increasing volume. Low volume breakouts are more likely to fail.
• Multiple Timeframe Analysis — Check higher timeframes for overall trend direction. Trade squeeze releases that align with the larger trend.
• Parameter Adjustment — Increase BB and KC lengths for smoother signals on higher timeframes. Decrease for more sensitive signals on lower timeframes.
█ LIMITATIONS
• The indicator does not predict breakout direction before the squeeze releases. The momentum histogram provides bias but is not definitive until the breakout occurs.
• False breakouts can occur, particularly in choppy or low-volume market conditions. Always use proper risk management and stop losses.
• The indicator works best in trending markets. In deeply ranging markets with no clear direction, squeeze signals may be less reliable.
• Momentum calculations use linear regression which can lag during extremely fast price movements. Confirm signals with price action.
█ NOTES
This implementation uses linear regression for momentum calculation rather than simple moving averages, providing more responsive and accurate directional signals. The four-color histogram system gives traders nuanced feedback on momentum strength that binary color schemes cannot provide.
The indicator automatically adjusts to any symbol and timeframe without modification, making it suitable for stocks, forex, crypto, and futures markets.
█ CREDITS
Squeeze methodology inspired by John Carter's TTM Squeeze indicator. Momentum calculation and visual design optimized for modern trading workflows.

Ultimate RSI Suite [BigBeluga]🔵 OVERVIEW
The Ultimate RSI Suite elevates the classic RSI into a full professional trading system.
It combines momentum analysis, advanced divergence detection, volatility-based RSI channels, multi-timeframe signals, deviation tracking, and reversal alerts into one powerful tool.
This is no ordinary RSI — it’s a complete momentum intelligence engine designed to identify trend strength, exhaustion, breakout conditions, and reliable reversal points with high precision.
⚠️ Note:
This suite enhances RSI with MTF dashboards, dynamic channels, deviation logic, and smart alerting — ideal for scalpers, swing traders, and institutional-style trend followers.
🔵 CONCEPTS
Measures market momentum to detect overbought/oversold zones and trend health
Tracks RSI behavior relative to dynamic channels (BB/Keltner/Donchian)
Identifies regular bullish & bearish divergences
Detects deviation moves after divergence to confirm trend continuation or exhaustion
Multi-timeframe RSI conditions reveal higher-timeframe confluence
Reversal triggers confirm early momentum shifts
Overbought/oversold gradients visually highlight exhaustion zones
🔵 FEATURES
Classic + Enhanced RSI with configurable lookback & price source
RSI-Channel System (Bollinger, Keltner, Donchian) for volatility-adaptive trend structure
RSI-Smoothing MA for trend direction filters
RSI Reversal Signals for early trend inflection detection
RSI Reversal Signals Deviation Levels +1 / +2 for advanced continuation confirmation
Overbought/Oversold Gradient Zones at 35/65 or user-defined levels
Divergence Engine for bullish & bearish momentum exhaustion signals
On-Chart Divergence & Signals (full overlay capability)
Divergence Engine Deviation Levels +1 / +2 for advanced continuation confirmation
Multi-Timeframe Dashboard (RSI OB/OS, signals, divergences, channel breaks)
• Hover your mouse over any signal cell to see how many bars ago it was triggered
• Signals automatically expire after 50 bars
Smart Alerts for divergence, reversals, channel breaks, and deviation triggers
🔵 HOW TO USE
Enter long when RSI reverses from oversold & prints bullish divergence or a ▲ signal
Enter short when RSI reverses from overbought & prints bearish divergence or ▼
Use channel breaks to confirm momentum expansions or trend shifts
Look for deviation crosses (+1 / +2) for strong confirmation after divergence
Track MTF table — more timeframe agreement = stronger conviction
Avoid trading against MTF RSI extremes (OB/OS stacked zones)
Combine with market structure or volume-based tools for maximum precision
🔵 ALERTS
Includes full automation suite:
Bullish / Bearish divergence
Reversal signals (▲ / ▼)
Channel breakouts (Up/Down)
Deviation +1 / +2 confirmation triggers
Extra RSI signal deviation alerts for precision continuation reads
Great for automated systems, confirmation models, and high-probability intraday/swing entries.
🔵 CONCLUSION
The Ultimate RSI Suite transforms RSI into a smart momentum-analysis system.
With multi-timeframe logic, dynamic channels, advanced divergence/deviation systems, and powerful visual cues, it offers institutional-grade trend, exhaustion, and reversal detection.
If you rely on RSI, this toolkit provides superior clarity, deeper context, and stronger execution timing — making it an elite upgrade for professional traders.
Script a pagamento

Liquidity & Momentum Master (LMM)💎 Liquidity & Momentum Master (LMM)
A professional dual-system indicator that combines:
📦 High-Volume Support/Resistance Zones and
📊 RSI + Bollinger Band Combo Signals — to visualize both smart money footprints and momentum reversals in one clean tool.
🧱 1. High-Volume Liquidity Zones (Support/Resistance Boxes)
Conditions
Visible only on 1H and higher timeframes (1H, 4H, 1D, etc.)
Detects candles with abnormally high volume and strong ATR-based range
Separates bullish (support) and bearish (resistance) zones
Visualization
All boxes are white, with adjustable transparency (alphaW, alphaBorder)
Each box extends to the right automatically
Only the most important (Top-N) zones are kept — weaker ones are removed automatically
Interpretation
White boxes = price areas with heavy liquidity and volume concentration
Price approaching these zones often leads to bounces or rejections
Narrow spacing = consolidation, wide spacing = potential large move
💎 2. RSI Exit + BB-RSI Combo Signals
RSI Exit (Overbought/Oversold Recovery)
RSI drops from overbought (>70) → plots red “RSI” above the candle
RSI rises from oversold (<30) → plots green “RSI” below the candle
Works on 15m, 30m, 1H, 4H, 1D
→ Indicates short-term exhaustion recovery
BB-RSI Combo (Momentum Reversal Confirmation)
Active on 1H and higher only
Requires both:
✅ RSI divergence (bullish or bearish)
✅ Bollinger Band re-entry (after temporary breakout)
Combo Buy (Green Diamond)
Bullish RSI divergence
Candle closes back above lower Bollinger Band
Combo Sell (Red Diamond)
Bearish RSI divergence
Candle closes back below upper Bollinger Band
→ Confirms stronger reversal momentum compared to standard RSI signals

RSI Exit + BB-RSI Combo📊 RSI Exit + BB-RSI Combo Indicator
This indicator combines RSI overbought/oversold exit signals with Bollinger Band re-entry conditions to highlight potential reversal or retracement zones.
1️⃣ RSI Exit Signal
- When RSI drops below 70 after being overbought → 🔴 "RSI" label
- When RSI rises above 30 after being oversold → 🟢 "RSI" label
- Works on 15m / 30m / 1h / 4h / 1D timeframes
2️⃣ BB-RSI Combo Signal
- When an RSI divergence forms and
- The candle body re-enters the Bollinger Band on 1H+ timeframe
→ Combo signal (💎 diamond) is shown
💡 How to Use
- Use RSI exit signals to spot overextension corrections
- Use combo signals to identify high-probability reversal or rebound setups
- Suitable for both swing and short-term trading

SFC Bollinger Band and Bandit概述 (Overview)
SFC 布林通道與海盜策略 (SFC Bollinger Band and Bandit Strategy) 是一個基於 Pine Script™ v6 的技術分析指標,結合布林通道 (Bollinger Bands)、移動平均線 (Moving Averages) 以及布林海盜 (Bollinger Bandit) 交易策略,旨在為交易者提供多時間框架的趨勢分析與進出場訊號。該腳本支援風險管理功能,並提供視覺化圖表與交易訊號提示,適用於多種金融市場。
This script, written in Pine Script™ v6, combines Bollinger Bands, Moving Averages, and the Bollinger Bandit strategy to provide traders with multi-timeframe trend analysis and entry/exit signals. It includes risk management features and visualizes data through charts and trading signals, suitable for various financial markets.
功能特點 (Key Features)
布林通道 (Bollinger Bands)
提供可調整的標準差參數 (σ1, σ2),支援多層布林通道顯示。
進場訊號基於價格穿越布林通道上下軌,並結合連續K線確認機制。
Provides adjustable standard deviation parameters (σ1, σ2) for multi-layer Bollinger Bands display.
Entry signals are based on price crossing the upper/lower bands, combined with a consecutive bar confirmation mechanism.
移動平均線 (Moving Averages)
支援簡單移動平均線 (SMA) 或指數移動平均線 (EMA),可自訂快、中、慢線週期。
Supports Simple Moving Average (SMA) or Exponential Moving Average (EMA) with customizable fast, medium, and slow line periods.
布林海盜策略 (Bollinger Bandit Strategy)
基於變動率 (ROC) 與布林通道動態止損,提供做多與做空訊號。
包含動態止損均線與平倉天數設定,增強交易靈活性。
Utilizes Rate of Change (ROC) and Bollinger Bands with dynamic stop-loss for long and short signals.
Includes dynamic stop-loss moving average and liquidation days for enhanced trading flexibility.
多時間框架分析 (Multi-Timeframe Analysis)
支援六個時間框架 (5分、15分、1小時、4小時、日線、週線) 的趨勢分析。
通過表格顯示各時間框架的連續上漲/下跌趨勢,輔助交易決策。
Supports trend analysis across six timeframes (5m, 15m, 1h, 4h, daily, weekly).
Displays consecutive up/down trends in a table to aid decision-making.
風險管理 (Risk Management)
提供基於 ATR 或布林通道的停利/停損設定。
自動計算交易手數,根據報價貨幣匯率調整風險敞口。
Offers take-profit/stop-loss settings based on ATR or Bollinger Bands.
Automatically calculates trading lots, adjusting risk exposure based on quote currency exchange rates.
視覺化與提示 (Visualization and Alerts)
繪製布林通道、移動平均線、海盜策略動態止損線及交易訊號。
提供多時間框架趨勢表格、交易手數標籤及浮水印。
支援交易訊號快訊,方便即時監控。
Plots Bollinger Bands, Moving Averages, Bandit strategy stop-loss lines, and trading signals.
Includes multi-timeframe trend tables, trading lot labels, and watermark.
Supports alert conditions for real-time trade monitoring.
使用說明 (Usage Instructions)
設置參數 (Parameter Setup)
布林通道 (Bollinger Bands): 可調整週期 (預設21)、標準差 (σ1=1, σ2=2) 及停利/停損依據 (ATR 或 BAND)。
移動平均線 (Moving Averages): 可選擇顯示快線 (10)、中線 (20)、慢線 (60),並切換 SMA/EMA。
布林海盜 (Bollinger Bandit): 調整通道週期 (50)、平倉均線週期 (50) 及 ROC 週期 (30)。
時間框架 (Timeframes): 自訂六個時間框架,預設為 5分、15分、1小時、4小時、日線、週線。
Adjust Bollinger Band period (default 21), standard deviations (σ1=1, σ2=2), and take-profit/stop-loss basis (ATR or BAND).
Configure Moving Averages (fast=10, medium=20, slow=60) and toggle SMA/EMA.
Set Bollinger Bandit parameters: channel period (50), liquidation MA period (50), ROC period (30).
Customize six timeframes (default: 5m, 15m, 1h, 4h, daily, weekly).
交易訊號 (Trading Signals)
買入訊號 (Buy): 價格穿越下軌且滿足連續K線條件。
賣出訊號 (Sell): 價格穿越上軌且滿足連續K線條件。
海盜策略訊號: 基於 ROC 與布林通道穿越,結合動態止損。
Buy signal: Price crosses below lower band with consecutive bar confirmation.
Sell signal: Price crosses above upper band with consecutive bar confirmation.
Bandit strategy signals: Based on ROC and band crossings with dynamic stop-loss.
視覺化 (Visualization)
布林通道以不同顏色顯示上下軌與中軌。
移動平均線以快、中、慢線區分顏色。
趨勢表格顯示各時間框架的趨勢狀態 (🔴上漲, 🟢下跌, ⚪中性)。
海盜策略顯示動態止損線與交易狀態。
Bollinger Bands display upper, lower, and middle bands in distinct colors.
Moving Averages use different colors for fast, medium, and slow lines.
Trend table shows timeframe trends (🔴 up, 🟢 down, ⚪ neutral).
Bandit strategy displays dynamic stop-loss and trading status.

Stocktech.in - MidasStocktech.in – Midas: All-in-one charting indicator featuring neutral candles, trend guide bands, StockTech info table, and high-volume markers (HVQ/HVY/HVE) for quick visual volume analysis. Fully customizable and toggleable.
Bollinger Bands Squeeze📈 Bollinger Bands Squeeze
This indicator enhances traditional Bollinger Bands by integrating Keltner Channel layers to visualize market compression and volatility expansion — allowing traders to easily identify when a squeeze is building or releasing.
🔍 Overview
This is a refined version of the classic Bollinger Bands, designed to detect volatility squeezes using multiple Keltner Channel thresholds.
The script plots standard Bollinger Bands and dynamically colors the bands according to the degree of compression relative to the Keltner Channels.
⚙️ How It Works
Bollinger Bands are calculated from a selected moving average (SMA, EMA, SMMA, WMA, or VWMA) and standard deviation multiplier.
Keltner Channels are derived from ATR (True Range) using three sensitivity levels (1.0, 1.5, and 2.0× multipliers).
When Bollinger Bands contract inside a Keltner Channel, the script marks a squeeze state:
🟠 High Compression (Orange): Very tight volatility — expect breakout soon.
🔴 Mid Compression (Red): Moderate contraction — volatility is building.
⚫ Low Compression (Gray/Black): Early compression phase.
🧩 Inputs & Customization
Length : Period for both Bollinger and Keltner calculations.
Basis MA Type: Choose from SMA, EMA, SMMA (RMA), WMA, or VWMA.
StdDev Multiplier : Controls Bollinger Bandwidth.
Keltner Multipliers (1.0 / 1.5 / 2.0) : Adjust compression thresholds.
Offset : Shifts the bands visually on the chart.
🕹️ Best Use Cases
Identify pre-breakout conditions before volatility expansion.
Combine with volume, momentum, or trend indicators (e.g., RSI) for confirmation.
Ideal for scalping, breakout trading, or volatility-based entries during session opens.