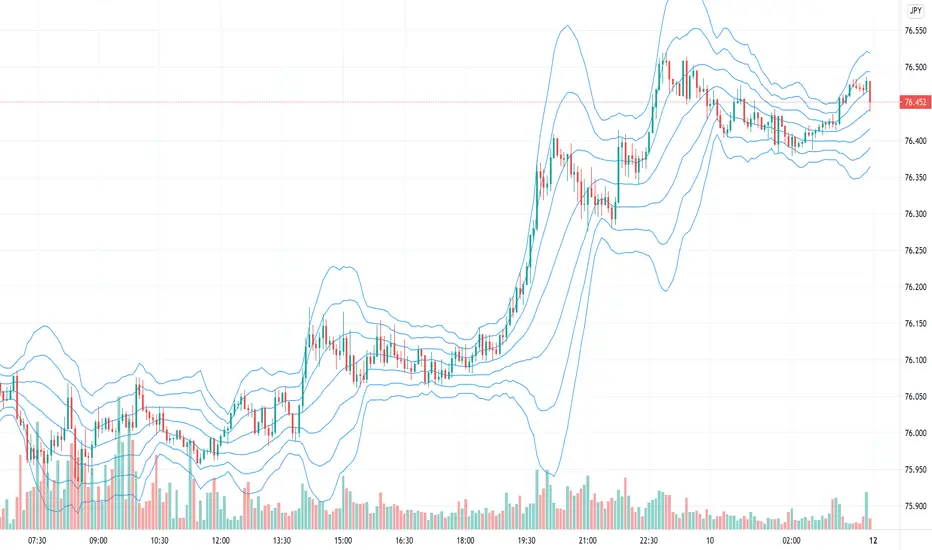
BBliciousStandard Bollinger Band with :
- BB with 1 Standard Dev
- BB with 1.5 Standard Dev
- BB with 2..5 Standard Dev
Top and Bottom Ribbon Color Area
- Fill Area between Standard Dev 1 and 1.5 ( Top & Bottom )
Cerca negli script per "bollingerband"

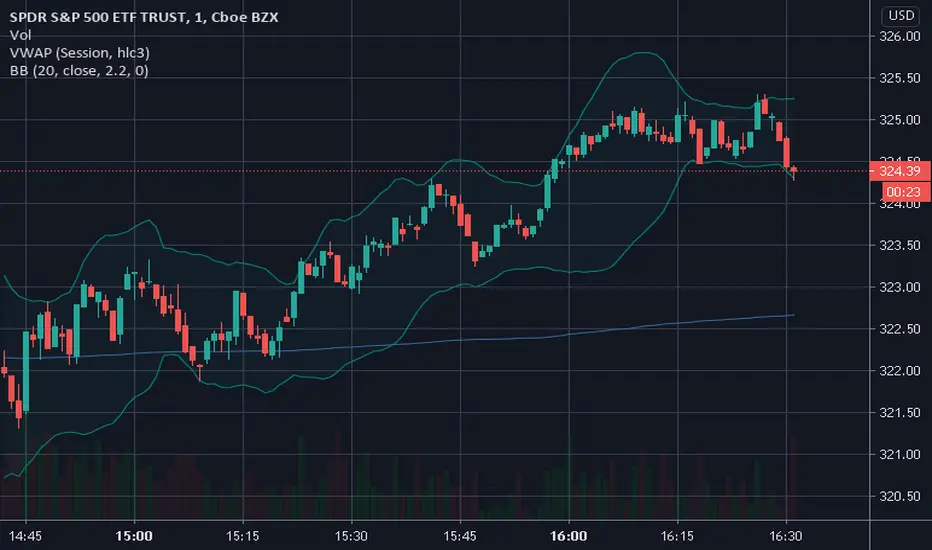
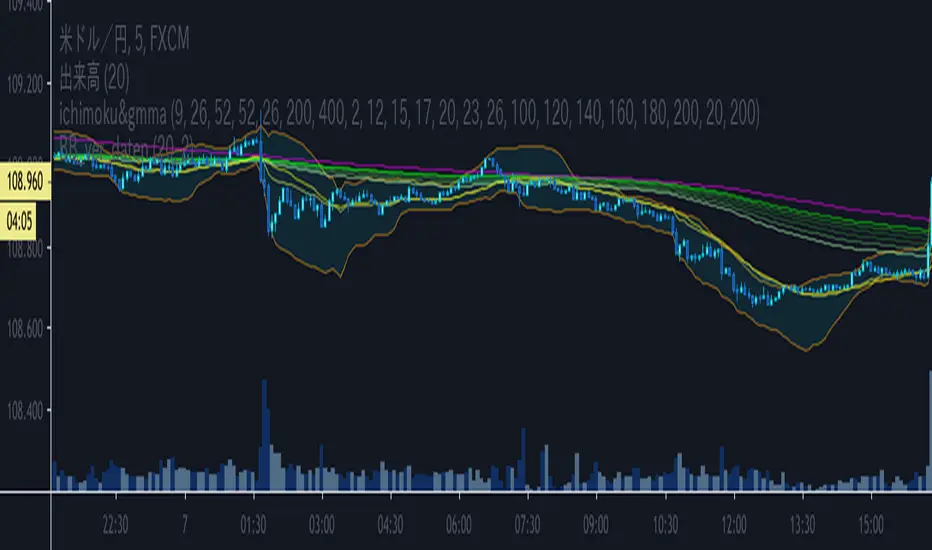
Bollinger bands on 1M/5M/15M chart onlyJapanese below. 日本語の説明は下記
This is Bollinger bands that is shown only on 1M, 5M and 15M charts only.
I Sometimes refer to Bollinger bands when I try to identify specific entry point on lower timeframe especially on 5M, whereas I do not want Bollinger bands to be shown up on other timeframes as they become noise...
This is why I removed Bollinger bands from 1 hour and upper timeframes.
——————————————————————————————
1分足、5分足、15分足のみに表示されるボリンジャーバンドのインジケーターです。
1分足や5分足でエントリーのタイミングを計るときにはボリンジャーバンドを使うことがあるのですが、1時間足以上では特に参照しないため、チャートに表示しないよう制御を加えました。
±1〜3シグマのバンド及びミドルラインとしてSMAを設定可能です。
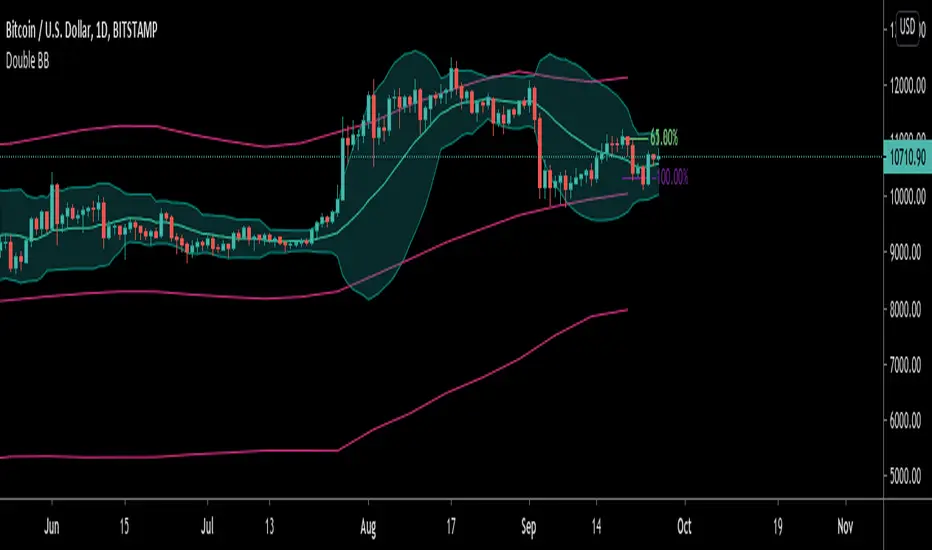
Bollinger Band x2Double BB with different deviation
bb1: 34, 2
bb2. 34. 2.5.
Las bb se pueden configurar

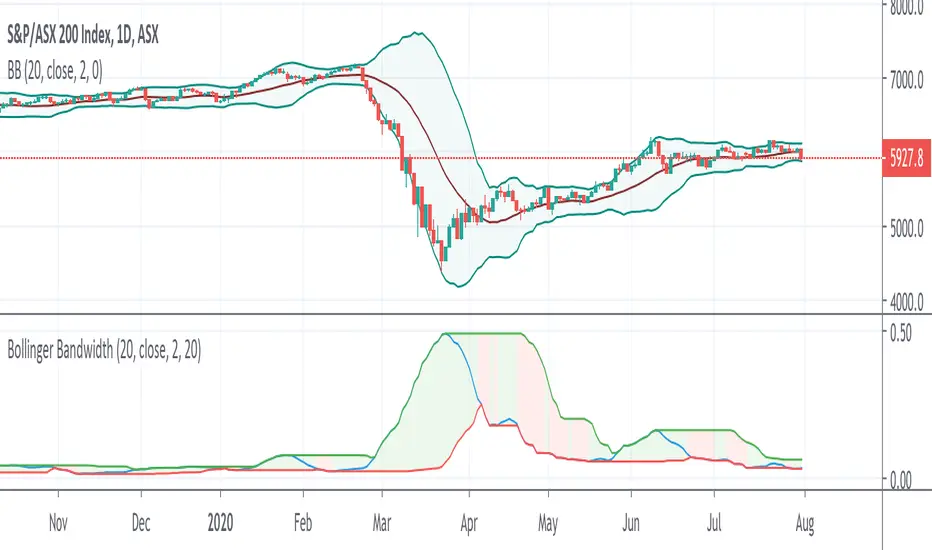
Bollinger Bandwidth - Bulge and squeezeThis is Bollinger bandwidth indicator:
Bandwidth = high-low/main
I have added lowest and highest of N periods to programmatically identify bulge and squeeze. When bandwidth at N periods low, it is in squeeze. If bandwidth at N periods high, it is in bulge.
Bollinger band 1+2Bollinger band with 1 and 2 standard deviation
Default with 21 SMA
Also count number of candlesticks of previous trend when crossing 1 standard deviation

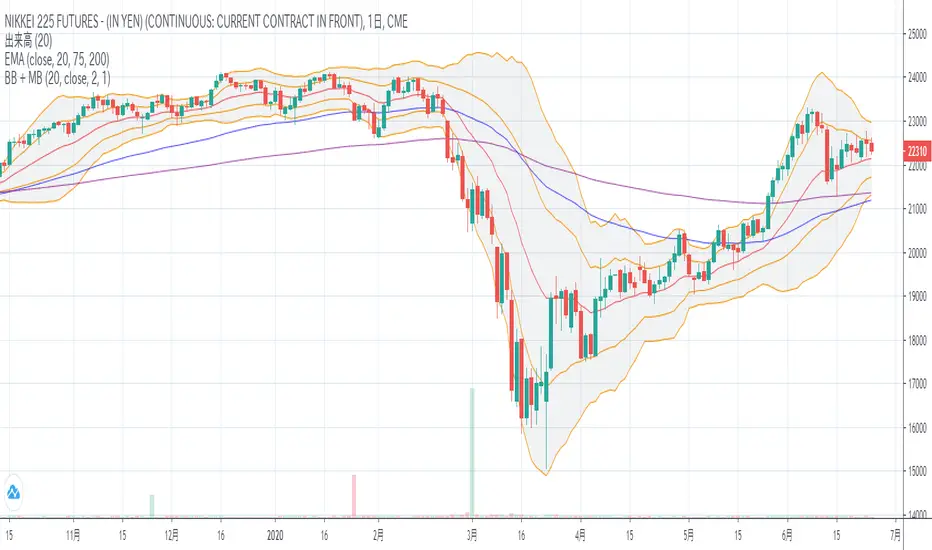
Bolinger Band + Mid Band using EMAEMA become more popular than SMA.
EMA reacts faster than SMA.
Mid Band helps you to find out trend.
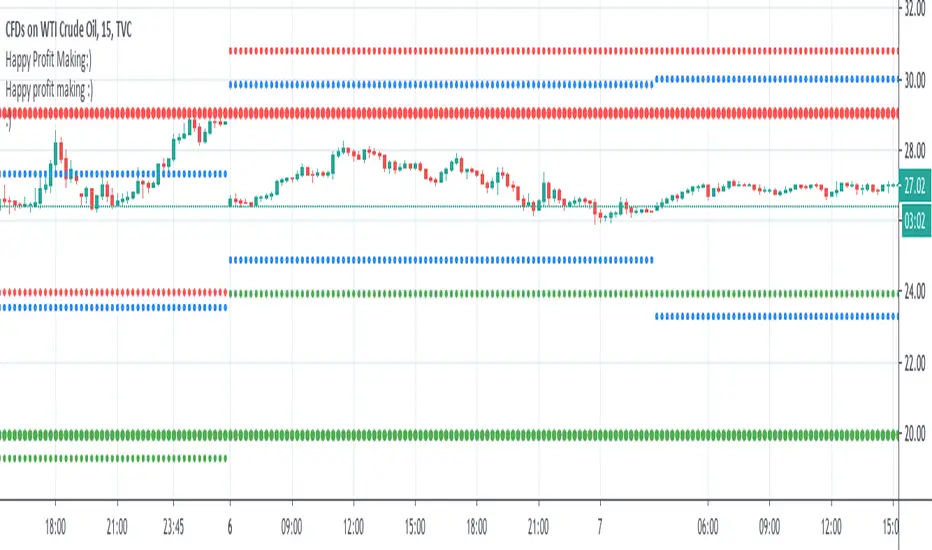
mtf b zonesThese zones helps to do intraday, short term & long term. The blue lines are for intraday. The small green and red dotted lines are for weekly. The large green and red dotted lines are for monthly. use this along with price action trading. Best wishes. Thank you....
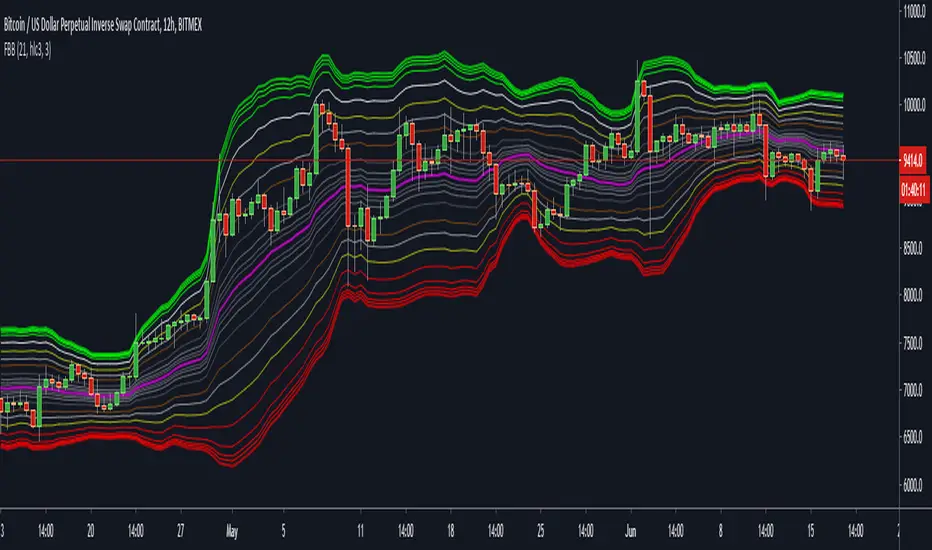
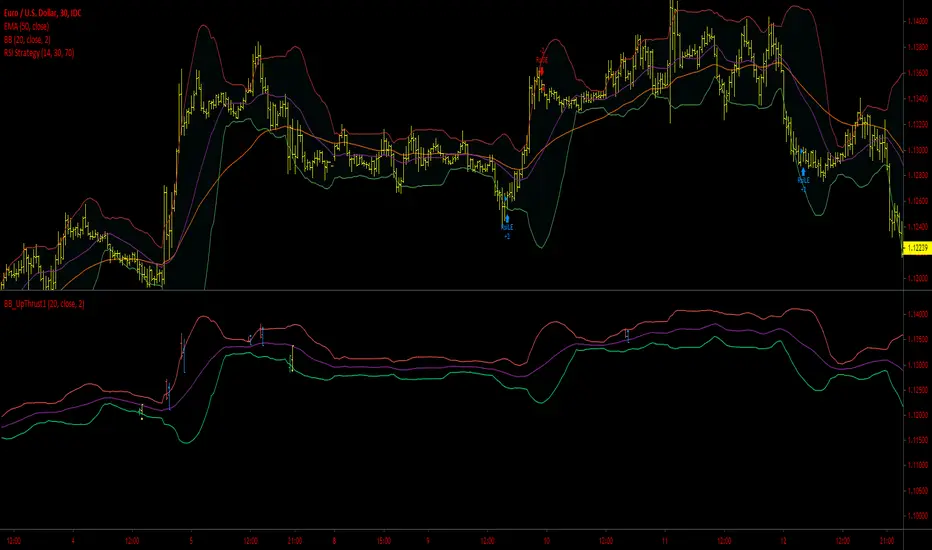
MTF Nested BB w/ Reversal SignalsNested BB with 1 Dev line and 2/3 Dev Cloud
Threshold signal indicating strong / extended move in direction ..
Reversal signal indicating potential reversal ..
Color / direction coated based on band that is extended .. band that price is reversing towards ..
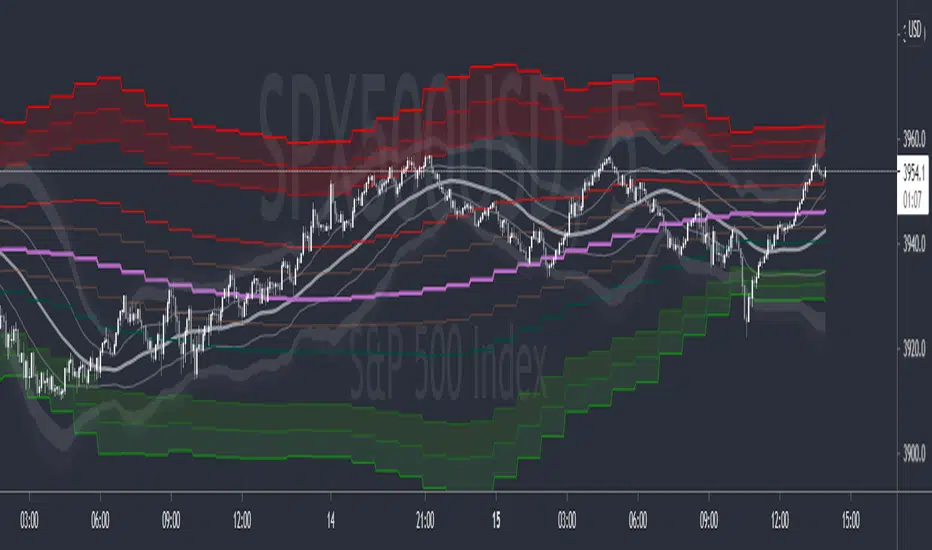
Better Bollinger Bands (now open source)General purpose Bollinger band indicator with a number of configuration options and some additional color-coded information. The main advantages of it over standard Bollinger bands are:
1) Better statistics:
* Uses volume weighted moving averages, variance, and standard deviation by default. The volume dependence can be disabled with a checkbox option, but generally makes it more responsive improves its ability to distinguish true outlier events from random variation.
* Lets you pick between different time windows (simple, sawtooth (WMA), exponential) in addition to the volume weighting, with appropriate Bessel corrections to make the estimators unbiased and to get consistent result for different weights.
* Has a checkbox option to use a linear regression in the band calculation if you don't want average momentum to be counted in the volatility. This turns the centerline into a last squares moving average, and the band width at each time step is given by the variance away from the regression line instead of from a moving average. Weights in the least squares regression are changed according to the other options. For tickers with a strong long-term trend this makes the bands track the price action more closely.
2) Geometric
* This does all calculations on log(price) instead of the prices themselves.
* Makes almost no difference in most cases, but gives better results on charts with strongly exponential behaviour that range between several orders of magnitude.
* Properly centered around price action on log plots.
* Will never annoy you by rescaling a log plot due to a negative lower band. The lower band is always positive for positive prices.
3) Some built in oscillators.
* This aims to reduce clutter by building in some other indicators into the band color scheme. You can pick between various momentum & RSI operators to color the center line and the bands, or leave the bands plain.
I've been using these bands myself for a few months & have been gradually adding functionality & polish. Feel free to comment, or to refer to me if you borrow any ideas.

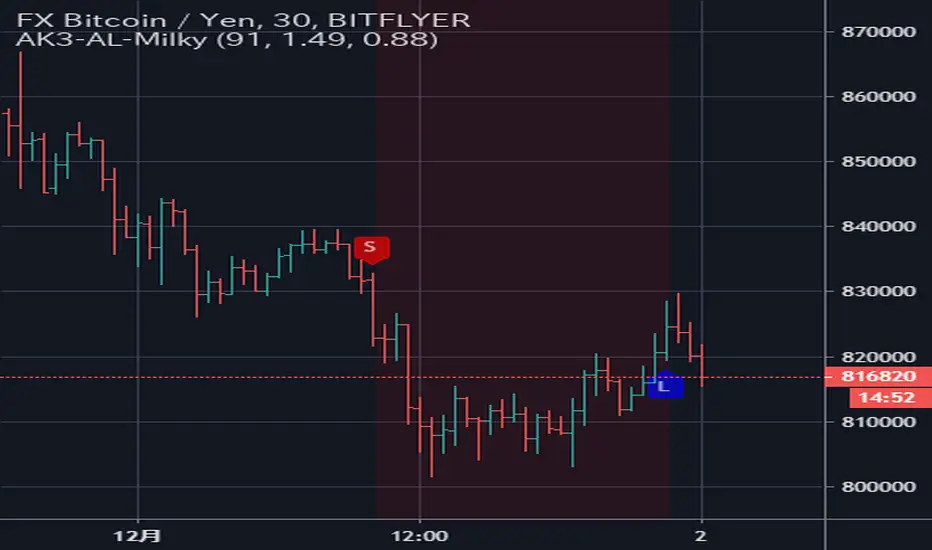
Trig's Law 2.0This script uses a combination of candlestick patterns and indicators to produce signals that indicate potential trade opportunities for binary options traders.
These signals are meant to serve as additional confirmation.
Best suited for EURNZD pair on the 5min and 3min timeframes.
In the settings menu, you will see a list of pattern-based signals you can choose to have displayed on the chart.
ideally should wait for the signal candle to close before entering any trade.

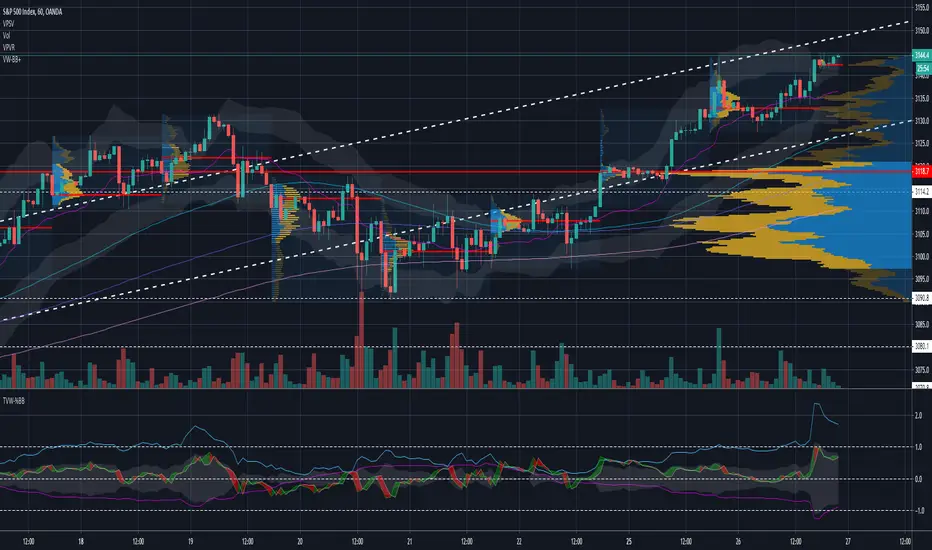
VW %BB +Volume weighted %BB Based on Closing price (green line)
%BB of 50 period ema of the 20 period volume weighted moving average at each point (blue)
difference of %BB green - %bb Blue shading around mid-band (ie width between two in band terms)
added an additional line which is the sum of the absolute distance from mid-band of the ema + top half of bandwidth difference
Better Bollinger bandsBollinger bands with volume-weighted statistics (volume weighted moving averages & variance/standard deviation) to give better results during high-volume events, and also aims to provide additional information without adding clutter by coloring the bands. Intended as the first basic indicator to be thrown on a chart.
Will never annoy you by rescaling log charts due to negative lower bands (much like my previous geometric bollinger bands) , and will almost always give more realistic bounds on price movement than standard bollinger bands, particularly during high-volume events such as broken supports, earnings reports, or squeezes.
The centerline is colored green or red by a volume-weighted momentum oscillator. The bands themselves let you select color schemes such as detected market type (confirmed bull market, confirmed bear market, or volatility-dominated), volatility change (to clearly show when bands are expanding or contracting), or the same color as the centerline oscillator.

Geometric Bollinger BandsAnalogous to Bollinger bands but performs all computations on the logarithms of the values.
Unlike the regular bollinger bands (or most other variations of them available on tradingview), these won't annoy you by rescaling the chart when you try to look at the Bitcoin weekly chart or any other chart with strongly exponential behaviour, and the moving average is perfectly centered between the two bands on your log chart. The lower band is guarenteed to be positive for positive inputs.


Bollinger Bands Candle Close Outside ImmediateThis study can be used to set alerts whenever a candle closes outside the BBand. This 1 can get a bit spammy since you will get an alert for multiple consecutive candles at times.
The signals are there to be used for manual trading as more of an alert of extreme price movement to an area of interest where a potential trade might be available.
My recommendation is to use this on HTFs only, 4H or higher.

Bollinger Bands Candle Close Outside Delayed IndicatorThis study can be used to set alerts when a candle closes outside the BBand and the following candle closes inside it. Alert will be generated on the inside candle. Consecutive outside BBand closes won't generate any alerts.
The signals are there to be used for manual trading as more of an alert of extreme price movement to an area of interest where a potential trade might be available.
My recommendation is to use this on HTFs only, 4H or higher.

HLC Bollinger BandsThis is just a Bollinger band indicator that uses the highs & lows in addition to the close in the calculation of volatility / deviations from average. These bands will be slightly wider than regular Bollingers as a result.
I've found it useful with very short lookback lengths (3 to 5) for identifying periods when the bands are contracted... usually leads to an expansion of volatilty, so good for scalps.
Enjoy.
