Bollinger Channels / EMA and SMAThis is written as a system to replace the BB strategy.
I think it will work well.
It looks pretty stylish.
Description / Usage:
Adjust the length and multiplier based on your location with Bollinger Bands.
The multiplier of 1 provides you with a basic channel with high and low-source EMA (or SMA).
And with the 8-day exponential moving average, you can observe short entries and exits.
I wish good luck to the friends who will use it.
You can support and track new indicators.
Bu, BB stratejisinin yerini alacak bir sistem olarak yazılmıştır.
Oldukça şık görünüyor.
Kullanım
Bollinger Bantları ile bulunduğunuz yere göre uzunluk ve çarpanı ayarlayın.
1 çarpanı size yüksek ve düşük kaynaklı EMA (veya SMA) içeren temel bir kanal sağlar.
Ve 8 günlük üstel hareketli ortalama ile kısa giriş ve çıkışları gözlemleyebilirsiniz.
Kullanacak arkadaşlara bol kazançlar diliyorum.
Yeni indikatör için destek olabilir ve takip edebilirsiniz.
Cerca negli script per "bollingerband"

Mean Absolute Deviation BandsThe other way to build bands around price that uses Mean Absolute Deviation instead of Standard Deviation.
MAD is also a measure of variability, but less frequently used. MAD is better for use with distributions other than the Gaussian.
MAD is always less than or equal to Standard Deviation and the resulting bands are more tighter for the same parameters if we compare it to Bollinger Bands.
If you use band stops this can be useful.

(JS) Squeeze Pro OverlaysSo this was something I planned on doing in the future, I knew it would take some time to put together but here it is, the Squeeze Pro 2 Overlays.
On my original Squeeze Pro, I had made several overlay indicators to go along with it, this time my goal was to combine all that stuff into a single indicator and allow the user to turn on and off the specific features they'd prefer to use. The version illustrated in the preview has everything turned on. What is "everything"? Here's the breakdown...
First of all - the color schemes in the Squeeze Pro match the color schemes in the Overlays indicator, so you can match them up (Color Scheme 3 in example). There are 6 schemes, option 1 is the original Squeeze colors.
There's also an option to make the light squeeze black, rather than white. This is for people who aren't using Dark Mode. It will flip all white to black, to make your charts better to read!
So there are 4 main overlays that can be switched on and off with this indicator, they include;
1. Early Signal Candles
2. BBMA Basis Line
3. Bollinger Bands/Keltner Channel Breaches
4. Signal Arrows
Early Signal Candles
The Early Signal Candles have two parameters, the entry smoothing period and the exit smoothing period.
There is a different type of early entry signal for each type of squeeze.
Low Squeeze generates white dots on the highs of the candles.
Mid Squeeze generates a lime green candle (or purple candle in color scheme 3).
High Squeeze generates a bigger purple circle on the high of the candle.
These three signals are made to mimic the original Early In/Out Candles from John Carter and represent the same thing (they work the same way).
As for the early exit, that would be determined by the color of the candle vs the color of the squeeze, works the same way as the original as well.
BBMA Basis Line
The BBMA (Bollinger Bands Momentum Average) was a moving average I had made to use with the squeeze on the previous version.
It is the basis line of the BB and KC used to make up the Squeeze (a 20 SMA). There are 4 different colors to it on this version.
1. Orange - This means no squeeze.
2. White/Black - Low Squeeze
3. Red - Mid Squeeze
4. Yellow - High Squeeze
You'll also notice these colors are light and dark in different spots - this is a representation of whether the Bollinger Bands are expanding or contracting. Dark means expanding, light means contracting.
Bollinger Bands/Keltner Channel Breaches
This is a pretty simple feature. If there is an ongoing squeeze, and a candle closes above or below the Bollinger Bands or Keltner Channels, a circle appears at the top or the bottom of the chart telling you which way the channel has been breached.
Signal Arrows
This is what makes up most of the overlay indicator. If you turn it on, the default is set to work just like the original. There are lots of options with this though.
First, you can turn each type of Squeeze Arrow on or off by checking/unchecking the boxes for them.
Now allow me to explain the "Signal Length", as there are several options.
The default is "6 Dots", this generates a signal when a particular type of Squeeze reaches the 6th dot ("12 Dots" works the same way).
"End of Squeeze" generates a signal once a type of Squeeze has concluded.
"End of Early Signal" generates a signal when the early dots (or candle) finishes.
"Custom" allows you to select your own dot duration to produce a signal, you select that number in the field below.
The other portion of this is the "Signal Type", this is where you select how each signal is generated once the selected amount of time takes place.
The default is the same as the original "+/-", this generates a signal based on whether Squeeze momentum is positive or negative.
"Rising/Falling" will only generate a signal if the Squeeze momentum maintains consistently over the last 6 bars.
"Crossed Zero" only generates a signal if the Squeeze momentum crosses above or below the zero line.
"Basis Line Momentum" is based on the BBMA. A signal is generated based on whether the current candle closes above or below the basis line.
"Divergence" only generates a signal if there is a divergence signal present at the time of the signal.
"Current Momentum" generates a signal based simply on the current direction of Squeeze momentum.
"Sum of Change" generates a signal based on the sum of the change in the Squeeze momentum being positive (long) or negative (short) over the length of time you select in the "Sum of Change Length" field.
Then "Combo" tries to take a look at everything and generates a score based on these parameters. Positive score = long, negative = short.
I hope I gave a detailed enough explanation on how everything works, let me know if you have any questions! Hope you like it!

Stochastic %BIt's a Stochastic indicator combined with Bollinger %B. This way you just need to check if it is above 1.0 or below 0.0 (Outside Bollinger Bands).

Rsi, Ema , Ma and Bollinger Bands for 1 min BtcusdtThis is for 1 min Btcusdt pair.
I am tring to find a way to catch %1 ups and downs.
Basicly it buys when rsi low and minute candle closes under ema,ma and lower bollinger band,
it sells when candle goes over upper bb,low ma, when rsi high.
It sells when rsi high ,candle closes over upper bb,over low ma and does the opposite when buying.
I know it's crowded but still tring to learn what to do ^^
I welcome any suggestions to improve.
It works better with shorts for now.
Don't buy with this !! You might lose big !

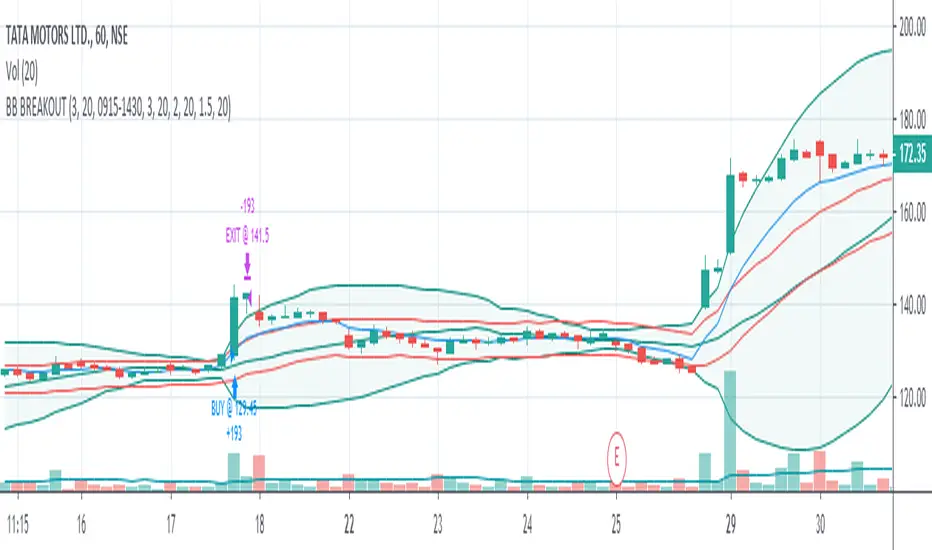
Full Candle Outside BB [Bishnu103]Bollinger band defines volatility range based on the current market condition. If a full candle is created outside BB then it is highly volatile and it may reverse to the mean, i.e. middle BB.
Buy - when a green candle is created below lower BB (alert candle) and price goes above high of it.
Buy SL - low of alert candle
Target 1 - middle band
Target 2- upper band
Sell - when a red candle is cerated above upper BB (alert candle) and price goes below low of it
Sell SL - high of alert candle
Target 1 - middle band
Target 2 - lower band
************************************************************************************************************************************************************************************
Disclaimer: This is in-progress strategy. I plan to work further and improve this. So please use this in the live market very carefully and based on your own risk factors.
************************************************************************************************************************************************************************************

RSI Bollinger %BIt's an RSI indicator combined with Bollinger %B. This way you just need to check if it is above 1.0 or below 0.0 (Outside Bollinger Bands). You can choose the moving average method used by RSI.

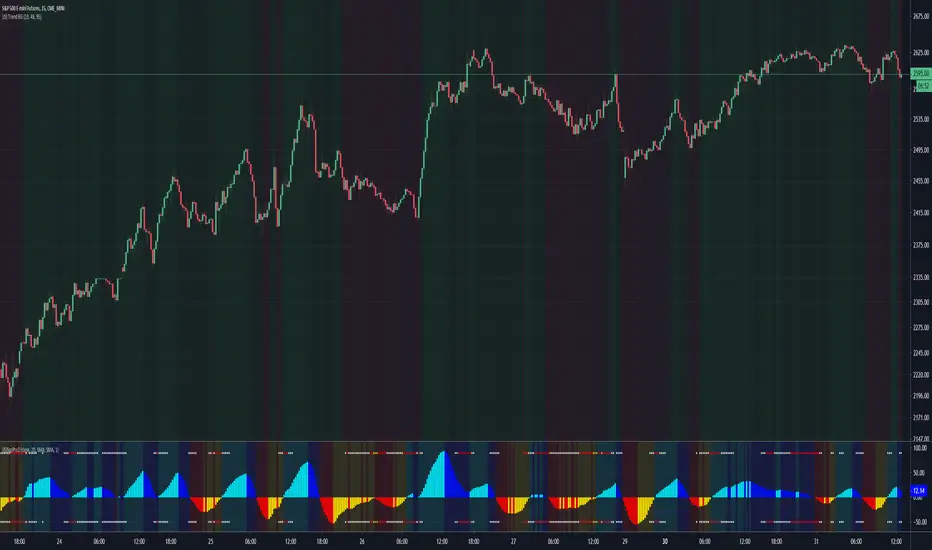
(JS) Squeeze Pro 2This is my version of the updated classic indicator created by John Carter. I plan on adding a Squeeze Overlay script in the future that will pair with this one as well for additional signals.
So to break down the Squeeze, what it is, how it works, etc - you have to look at the components that make it up.
1. Bollinger Bands
2. Keltner Channels
3. Momentum
The momentum in this indicator is smoothed out using linear regression (shout out to Lazy Bear, it's a much simpler way to do it, imo).
The momentum is what is displayed on the indicator as a histogram, its purpose is obvious (to show momentum).
Now what is a Squeeze? A squeeze occurs when Bollinger Bands tighten up enough to slip inside of Keltner Channels.
This is interpreted as price is compressing and building up energy before releasing it and making a big move.
Traditionally, John Carter's version uses 20 period SMAs as the basis lines on both the BB and the KC.
In my version, I've given the freedom to change this and try out different types of moving averages.
His original squeeze indicator had one Squeeze setting, though this new one has three .
The white dot Squeeze , call it a "low squeeze", an "early squeeze", whatever you'd like - this is the easiest Squeeze to form based on its settings.
The red dot Squeeze is the original from the first Squeeze indicator.
And finally, the yellow dot squeeze , call it a "high squeeze", "power squeeze", once again whatever you want - is the most difficult to form and suggests price is under extreme levels of compression.
From what I've witnessed John Carter say in the past, the squeeze is meant to be used for continuation.
Now to explain the parameters:
Squeeze Input - This is just the source for the Squeeze to use, default value is closing price.
Length - This is the length of time used to calculate the Bollinger Bands and Keltner Channels.
Bollinger Bands Calculation Type - Selects the type of moving average used to create the Bollinger Bands.
Keltner Channel Calculation Type - Selects the type of moving average used to create the Keltner Channel.
Color Format - I have created 5 different color schemes, this allows you to choose one.
Draw Divergence - Self explanatory here, this will auto-draw divergence on the indicator.
Gray Background for Dark Mode - This is something I put on all my indicators to make them more visually appealing.
Moving on to the alerts, I have made some basic alerts to notify certain indicator conditions (I had to revise it back from the prior version, as V4 of PineScript limits outputs).
6th Dot Alerts - This will inform you when a certain Squeeze makes it 6 dots in. Why 6 dots? That is what John Carter said to be his preference.
12th Dot Alerts - Think of this as a "prolonged Squeeze" alert. I feel like if they do run this long you likely need to go up in resolution, but some traders prefer certain time increments so this is for them.
End of Squeeze Alerts - Self explanatory again - once a Squeeze has concluded this will provide you with a notification.
Start of Squeeze Alerts - Opposite of the alert above, notifications come when a Squeeze begins.
Zero Line Alerts - This will inform you of when the momentum makes a bullish or bearish move across the zero line.
I hope that I've done well enough explaining the indicator and how it works, for any further information on it I suggest you check out Simpler Trading and get linked up with John Carter over there.
He does lots of videos, webinars, and of course you can always get the official indicator and his signals there too.
Bollinger Band - Keltner Squeeze - Failed Volatility BreakoutThis simple script provides Bollinger Band and Keltner Channel indicators, and will highlight areas where the Bollinger Bands enter into the Keltner Channel.
This script is based on the Failed Volatility Breakout (FVBO) System used by professional trader ChrisD_Macro. The default plot styles for the indicators in this script are based on Chris's setup, but visual styles as well as BB and Kelt settings (length, standard deviation, etc...) can all be easily customized with the user interface in the indicator settings.
You can also choose whether you want the condition to be triggered by just one Bollinger Band entering the Keltner Channel, or if it has to be both bands entering the channel.
This script is very useful when manually back testing the FVBO strategy, as it clearly highlights the BB-Kelt squeezes instead of having to constantly scroll in and out looking for them.
It can also be useful live as it has the ability to trigger TradingView alerts using the condition "BB-Kelt Squeeze".
Hope it's helpful
- JDC
Side Notes:
With Forex / Currencies this indicator I usually use this indicator on the 1 Day time frame.
Keep in mind that the script includes the Bollinger Bands and Keltner Channels, so if you already have your own version of these indicators on your chart, it will get really messy. (Just hide the other indicators while you get to know this one).


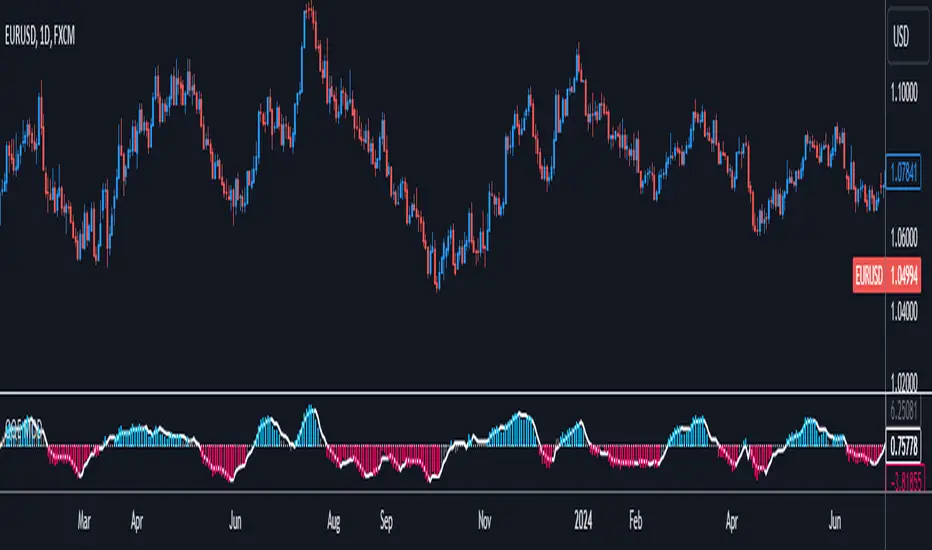
QQE MODSince there has been some demand for the QQE (Qualitative Quantitative Estimation ) figured I should upload my modified version of it as well.
The Orginal script is from Glaz, this is not my original idea - all I did was pretty much smash two QQEs together.
So there are Two QQEs in one script, right? One that is shown on the chart as columns, and the other "hidden" in the background which also has a 50 MA bollinger band acting as a zero line.
When both of them agree - you get a blue or a red bar.
[PX] MTF Standard Deviation LevelHello guys,
once again, I want to show you a different method for detecting support and resistance level. Today's approach is similar to the one I posted recently, but the way the level will be detected is different. I call it the multi-timeframe standard deviation level.
How does it work?
The method is similar to the way Bollinger Bands work. First, the indicator calculates the standard deviation, which can be influenced by the "Sensitivity"- and "Length"-setting.
Sensitiitiy - the higher the value, the fewer level will be shown
Length - simply the length for the standard deviation formula
Second, the detected value will be added (for resistance level) or substracted (for support level) from the current close. Once the upper or lower boundaries are crossed, a level will appear and keeps moving until the up- or downward movement finishes. Then the level will settle and stay in place.
Again, as seen in my previous indicator, you can control all the different styles and colors for the levels. The best part is, the whole thing works in a multi-timeframe fashion. In an example, you could select the "Daily" level and plot them on a 4-hour chart.
If you find this indicator useful, please leave a "like" and hit that "follow" button :)
Have fun, happy trading and once again Merry Christmas :)))

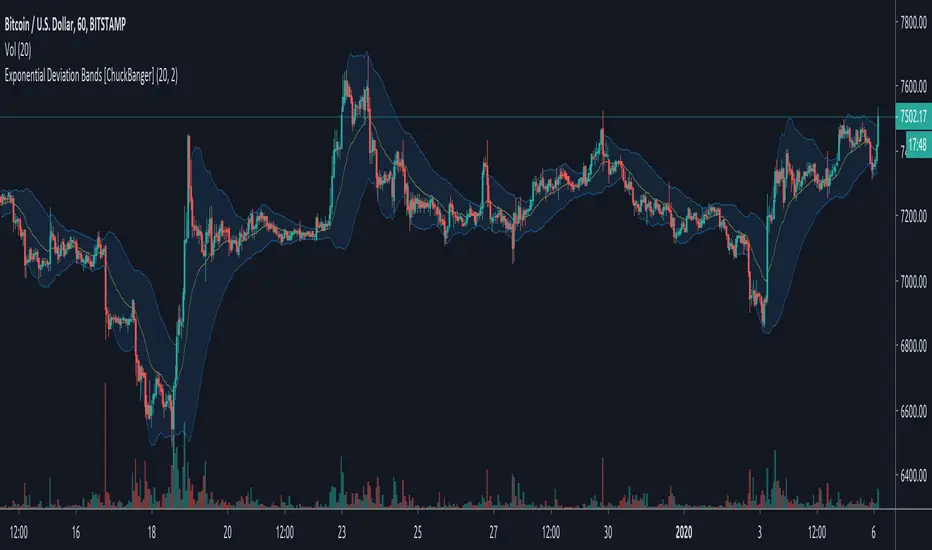
Exponential Deviation Bands [ChuckBanger]This is Exponential Deviation Bands. It is a price band indicator based on exponential deviation rather than the more traditional standard deviation, as you find in the well-known Bollinger Bands calculation. As compared to standard deviation bands, exponential deviation bands apply more weight to recent data and generate fewer breakouts. There fore it is a much better tool to identifying trends.
One strategy on the daily can be
Buy next bar if closing price crosses below the lower bands
Sell if price is equal to the current value of the upper bands
Ehlers Fractal Adaptive Moving Average with Bands [Bitcoinduke]FRAMA – What is it?
Fractal Adaptive Moving Average Technical Indicator ( FRAMA ) was developed by John Ehlers, code was implemented by TradingView user Shizaru. I've updated it to Pine Script 4 and added Bands Extension.
This indicator is constructed based on the algorithm of the Exponential Moving Average , in which the smoothing factor is calculated based on the current fractal dimension of the price series.
Advantages:
possibility to follow strong trend movements
determine moments of price consolidation ( FRAMA sufficiently slow down at these moments)
FRAMA + Bands
The FRAMA serves as a base for the Upper and Lower Bands which are used as a way to measure volatility by observing the relationship between the Bands and price. Typically the Upper and Lower Bands are set to two standard deviations away from the FRAMA ; however it should be adjusted depending on the task.

Eclub Multi IndicatorThis multi Indicator includes:
3 Moving Averages
2 Exponential Moving Averages
Bollinger Band
Ichimoku
Parabolic SAR
You can change the colors if you want. Go to setting to enable Ichimoku or SAR or disable others.
The color tolerance is by default zero which results in a very sensitive color change. You can change it to decrease the sensitivity. The value should be the last decimal of the price or the last two decimals of price etc.
If you like this indicator donate some BTC to the following address:
BTC address:
18NSD2xdJyYWoC4CSr4xg1hMk2q5cBbr8T
Combo Backtest 123 Reversal & DAPD This is combo strategies for get a cumulative signal.
First strategy
This System was created from the Book "How I Tripled My Money In The
Futures Market" by Ulf Jensen, Page 183. This is reverse type of strategies.
The strategy buys at market, if close price is higher than the previous close
during 2 days and the meaning of 9-days Stochastic Slow Oscillator is lower than 50.
The strategy sells at market, if close price is lower than the previous close price
during 2 days and the meaning of 9-days Stochastic Fast Oscillator is higher than 50.
Second strategy
This indicator is similar to Bollinger Bands. It based on DAPD - Daily
Average Price Delta. DAPD is based upon a summation for each of the
highs (hod) for the 21 days prior to today minus the summation for
each of the lows (lod) for the last 21 days prior to today. The result
of this calculation would then be divided by 21.
It will be buy when high above previos DAPD high and sell if low below previos DAPD low
WARNING:
- For purpose educate only
- This script to change bars colors.

Combo Strategy 123 Reversal & DAPD This is combo strategies for get a cumulative signal.
First strategy
This System was created from the Book "How I Tripled My Money In The
Futures Market" by Ulf Jensen, Page 183. This is reverse type of strategies.
The strategy buys at market, if close price is higher than the previous close
during 2 days and the meaning of 9-days Stochastic Slow Oscillator is lower than 50.
The strategy sells at market, if close price is lower than the previous close price
during 2 days and the meaning of 9-days Stochastic Fast Oscillator is higher than 50.
Second strategy
This indicator is similar to Bollinger Bands. It based on DAPD - Daily
Average Price Delta. DAPD is based upon a summation for each of the
highs (hod) for the 21 days prior to today minus the summation for
each of the lows (lod) for the last 21 days prior to today. The result
of this calculation would then be divided by 21.
It will be buy when high above previos DAPD high and sell if low below previos DAPD low
WARNING:
- For purpose educate only
- This script to change bars colors.

Bollinger Bands on MacdOnly longs when Macd line is above Bollinger Band and shorts when Macd line is above Bollinger Band, this will avoid many problems.
thumbs up!!!

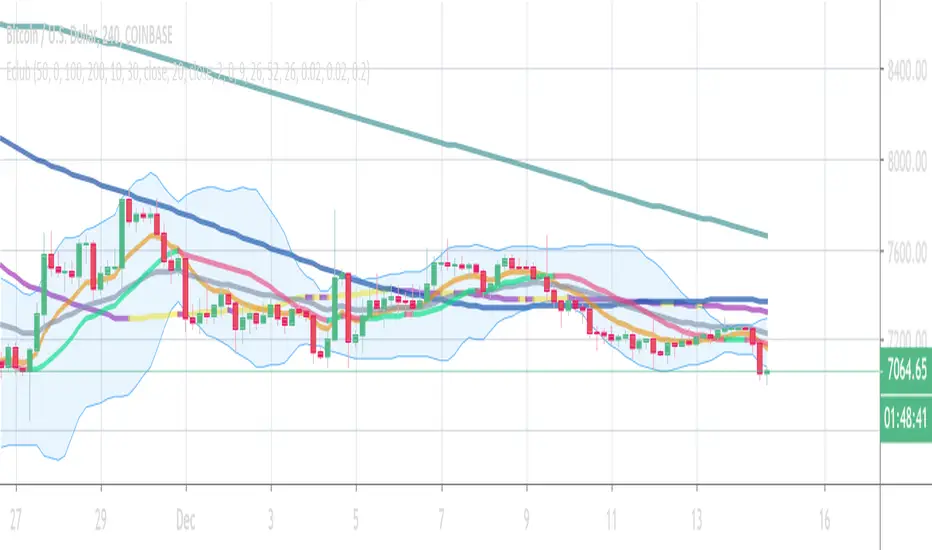
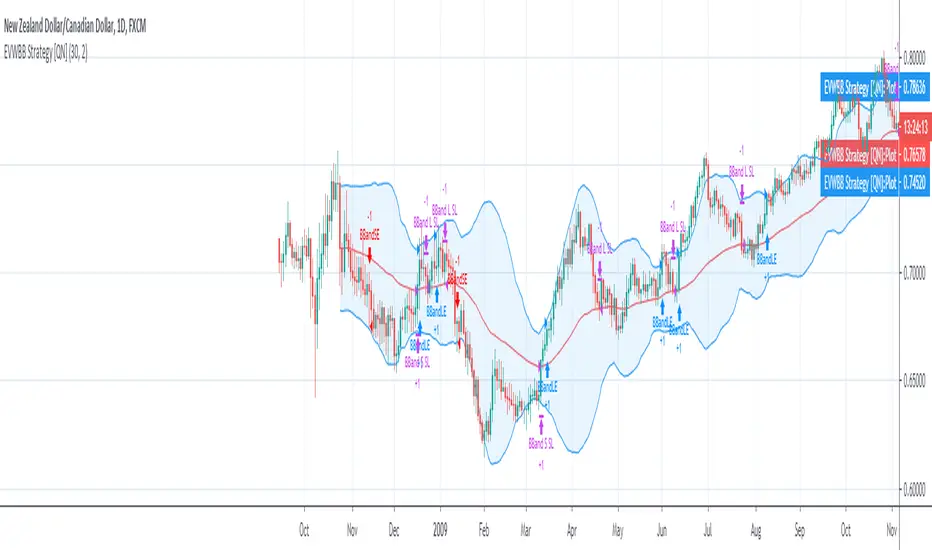
EVWBB Strategy [QuantNomad]It's my new strategy using EVWMA (Elastic Volume Weighted Moving Average).
Now I created a Bollinger Bands strategy where basis level is EVWMA.
It looks pretty interesting but you have to be careful with the entries/exits on the same bar, I'm using stop orders, so on big moves it happens pretty often.
In the next version, I will try to eliminate these issues.
Entry for this strategy happens when price crossover upper for long and lower for short. I exit both short and long on basis level.
Variable Index Dynamic Average (VIDYA) BandsThis adds volatility bands to the Variable Index Dynamic Average (VIDYA). The bands are calculated using the exponential moving average of the standard deviation of the VIDYA.
Thanks to everget for programming the VIDYA for tradingview.

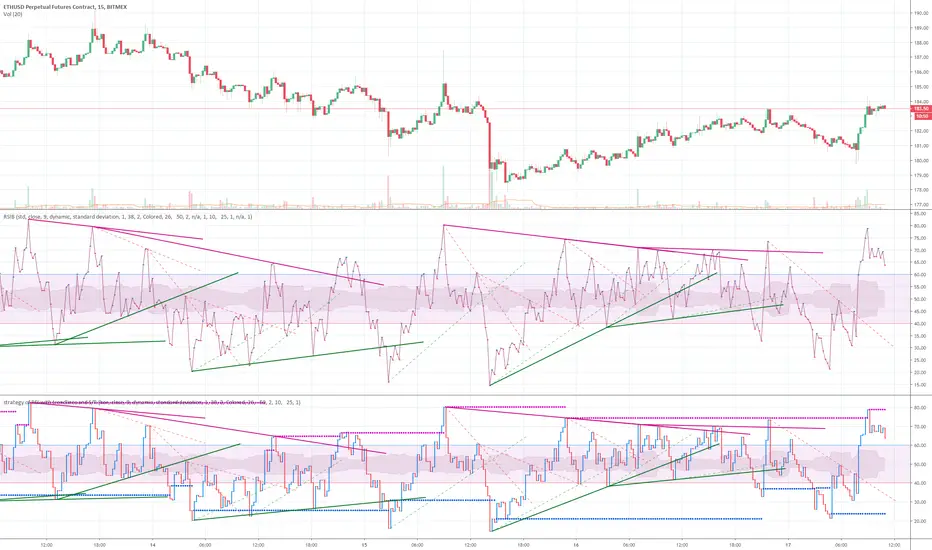
strategy of RSI with trendlines and S/RBefore I go through this chart I want to acknowledge the great programmers who spent much of their time and effort to assist many TV users and traders.
Thank you to LunaOwl for the RSI American lines her script made me realize the need to have trendlines, supports, and resistance on RSI charts.
Also, a copy of Lij_MC code from was taken which had been credited to Duyck. Thank you Duyck.
The BB was copied from morpheus747
As I researched different strategies one strategy seemed to assist the trader for entry and exits. It was the combination of Support and resistance on the RSI. In addition, diagonal lines (Recently introduced in pine script V4) assists in the direction and reversals that may occur. What is supplied is only a graphical representation and no trade entry or exit points are selected.
On the chart you can use;
• RSI line or bar;
• Bollinger High / Low support line;
• Diagonal trend lines. A primary and a secondary group of trendlines; and
• Trendline candle highlighter.
I am hoping people with great skills could assist to develop this to the next level.
I hope this graphical strategy may help until further development. Enjoy.
Bundle of various indicators, All-in-oneThis scripts compiles many indicators into one. It comes from many sources and i added all sources i used. If i forgot one, don't hesitate to message me.
This is useful if you need to setup your chart layout fast. The menu makes it easy to configure it.
You can configure and display:
- Various types of moving averages: RMA, SMA , EMA , WMA , VWMA , SMMA , HullMA, LSMA , DEMA , TEMA
- Stochastic RSI crosses from multi-timeframes directly on candle's close (1h, 4h, D, W)
- Bollinger bands with primary and secondary deviation
- SAR
- Color background using difference between Stochastic RSI K and D
- Support and resistance
- Open high low close from higher timeframes (D, W, M)
- Auto fibonacci levels (still a work in progress, i will add logarithmic fibonacci levels too later)
- "Alt season" for crypto users: if BTC dominance cross his SMA , display a pictogram on every chart
Stil working on:
- Auto fibonacci levels: i will add logarithmic fibonacci levels
- Stochastic crosses
- Alt season: use others types of moving averages
If you have any suggestions / improvements, feel free to message me or write it in the comments below.
