Kozlod - Simple BB Strategy - XBTUSD - 1 minuteReally nice performance for simple BB on XBTUSD Bitmex 1 minute chart.
BB length = 55, BB mult = 4.
No SL or PT used.
Amazingly performance for the last week, 92% profitable. Tested on entire May percent profitable become 80%, still not bad.
And remember:
Past performance does not guarantee future results.
Cerca negli script per "bollingerband"

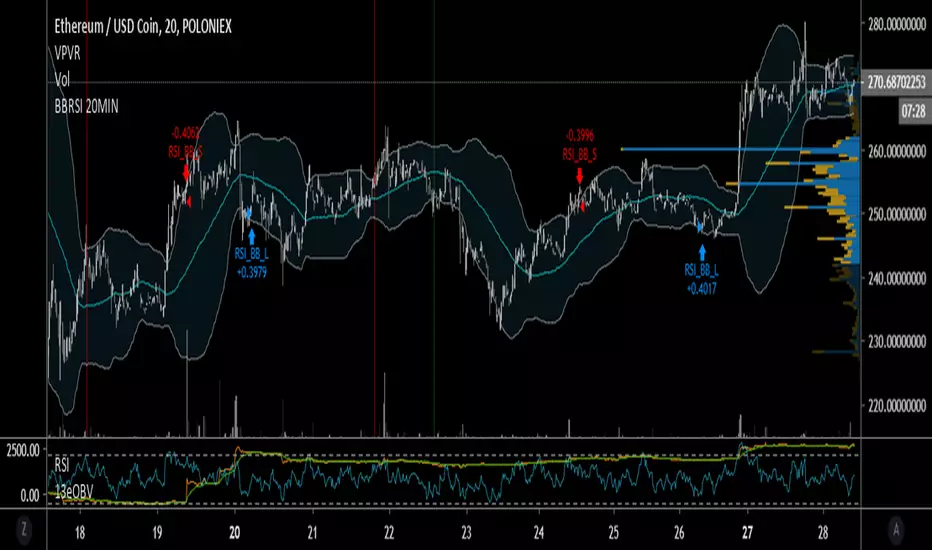
BB + RSI 20MIN, ETH/USDC Optimisé pour ETH USDC en 20MIN sur poloniex seulement,
pour les autres pairs a vous de jouer ;)
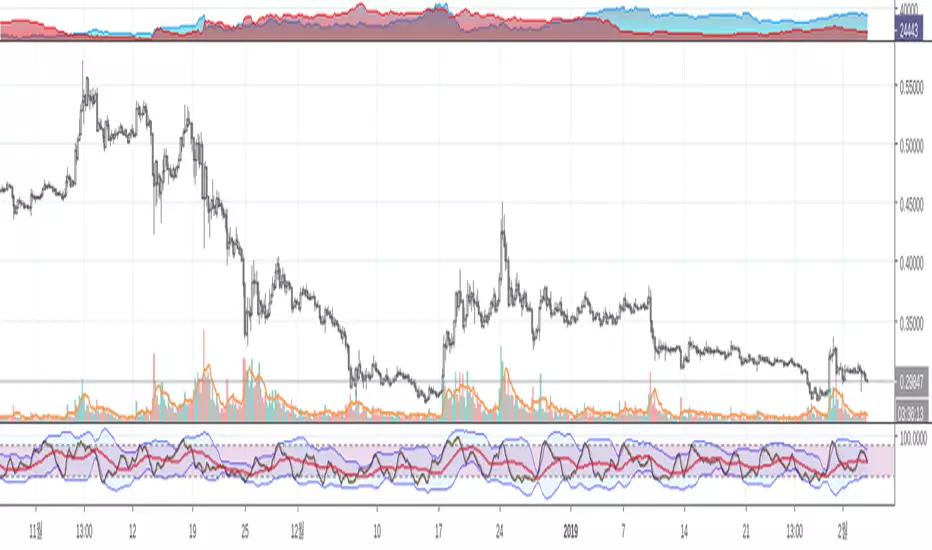
Kozlod - Simple BB Strategy - XRPBTC - 1 minutePretty good performance of simple BB on XRPBTC 1minute chart.
No SL or PT used.
And remember:
Past performance does not guarantee future results.

Bollinger and Tendencies (Bollinger e Tendências )The strategy consists of buying when the price breaks up (crossover) the bottom line of the Bollinger and selling when the price breaks down (crossunder) to your top line.
The chart still shows trends clearly, with the fill between the exponential average and the closing value of the canlestick, green at high, red at low (this part of the script is based on the code: "Pivot Daily Price Color" by Rimko).
It also places notes on the high and low candlesticks (based on the code: "Candlesticks Pattern Identified" by Repo32).
It is recommended to use it in conjunction with the "IFR and Storage" script (also available to me), and some volume script.
A estratégia consiste em comprar quando o preço rompe para cima (crossover) a linha inferior do Bollinger e vender quando o preço rompe para baixo (crossunder) a sua linha superior.
O gráfico ainda mostra as tendências de forma clara, com o preenchimento entre a média exponencial e o valor de fechamento do canlestick, verde em alta, vermelho em baixa (essa parte do script é baseada no código: "Pivot Daily Price Color" do usuário: Rimko).
Também, coloca apontamentos nos candlesticks de alta e de baixa (baseado no código: "Candlesticks Pattern Identified" do usuário Repo32).
Recomenda-se a utilização em conjunto com o script "IFR e Estocagem" (também por mim disponibilizado), e algum script de volume.

Multi SMA EMA WMA HMA BB (5x8 MAs Bollinger Bands) MAX MTF - RRBMulti SMA EMA WMA HMA 4x7 Moving Averages with Bollinger Bands MAX MTF by RagingRocketBull 2019
Version 1.0
All available MAX MTF versions are listed below (They are very similar and I don't want to publish them as separate indicators):
ver 1.0: 4x7 = 28 MTF MAs + 28 Levels + 3 BB = 59 < 64
ver 2.0: 5x6 = 30 MTF MAs + 30 Levels + 3 BB = 63 < 64
ver 3.0: 3x10 = 30 MTF MAs + 30 Levels + 3 BB = 63 < 64
ver 4.0: 5(4+1)x8 = 8 CurTF MAs + 32 MTF MAs + 20 Levels + 3 BB = 63 < 64
ver 5.0: 6(5+1)x6 = 6 CurTF MAs + 30 MTF MAs + 24 Levels + 3 BB = 63 < 64
ver 6.0: 4(3+1)x10 = 10 CurTF MAs + 30 MTF MAs + 20 Levels + 3 BB = 63 < 64
Fib numbers: 8, 13, 21, 34, 55, 89, 144, 233, 377
This indicator shows multiple MAs of any type SMA EMA WMA HMA etc with BB and MTF support, can show MAs as dynamically moving levels.
There are 4 MA groups + 1 BB group, a total of 4 TFs * 7 MAs = 28 MAs. You can assign any type/timeframe combo to a group, for example:
- EMAs 9,12,26,50,100,200,400 x H1, H4, D1, W1 (4 TFs x 7 MAs x 1 type)
- EMAs 8,13,21,30,34,50,55,89,100,144,200,233,377,400 x M15, H1 (2 TFs x 14 MAs x 1 type)
- D1 EMAs and SMAs 8,13,21,30,34,50,55,89,100,144,200,233,377,400 (1 TF x 14 MAs x 2 types)
- H1 WMAs 13,21,34,55,89,144,233; H4 HMAs 9,12,26,50,100,200,400; D1 EMAs 12,26,89,144,169,233,377; W1 SMAs 9,12,26,50,100,200,400 (4 TFs x 7 MAs x 4 types)
- +1 extra MA type/timeframe for BB
There are several versions: Simple, MTF, Pro MTF, Advanced MTF, MAX MTF and Ultimate MTF. This is the MAX MTF version. The Differences are listed below. All versions have BB
- Simple: you have 2 groups of MAs that can be assigned any type (5+5)
- MTF: +2 custom Timeframes for each group (2x5 MTF) +1 TF for BB, TF XY smoothing
- Pro MTF: 4 custom Timeframes for each group (4x3 MTF), 1 TF for BB, MA levels and show max bars back options
- Advanced MTF: +4 extra MAs/group (4x7 MTF), custom Ticker/Symbols, Timeframe <>= filter, Remove Duplicates Option
- MAX MTF: +2 subtypes/group, packed to the limit with max possible MAs/TFs: 4x7, 5x6, 3x10, 4(3+1)x10, 5(4+1)x8, 6(5+1)x6
- Ultimate MTF: +individual settings for each MA, custom Ticker/Symbols
MAX MTF version tests the limits of Pinescript trying to squeeze as many MAs/TFs as possible into a single indicator.
It's basically a maxed out Advanced version with subtypes allowing for mixed types within a group (i.e. both emas and smas in a single group/TF)
Pinescript has the following limits:
- max 40 security calls (6 calls are reserved for dupe checks and smoothing, 2 are used for BB, so only 32 calls are available)
- max 64 plot outputs (BB uses 3 outputs, so only 61 plot outputs are available)
- max 50000 (50kb) size of the compiled code
Based on those limits, you can only have the following MAs/TFs combos in a single script:
1. 4x7, 5x6, 3x10 - total number of MTF MAs must always be <= 32, and you can still have BB and Num Levels = total MAs, without any compromises
2. 5(4+1)x8, 6(5+1)x6, 4(3+1)x10 - you can use the Current Symbol/Timeframe as an extra (+1) fixed TF with the same number of MTF MAs
- you don't need to call security to display MAs on the Current Symbol/Timeframe, so the total number of MTF MAs remains the same and is still <= 32
- to fit that many MAs into the max 64 plot outputs limit you need to reduce the number of levels (not every MA Group will have corresponding levels)
Features:
- 4x7 = 28 MAs of any type
- 4x MTF groups with XY step line smoothing
- +1 extra TF/type for BB MAs
- 2 MA subtypes within each group/TF
- 4x7 = 28 MA levels with adjustable group offsets, indents and shift
- supports any existing type of MA: SMA, EMA, WMA, Hull Moving Average (HMA)
- custom tickers/symbols for each group
- show max bars back option
- show/hide both groups of MAs/levels/BB and individual MAs
- timeframe filter: show only MAs/Levels with TFs <>= Current TF
- hide MAs/Levels with duplicate TFs
- support for custom TFs that are not available in free accounts: 2D, 3D etc
- support for timeframes in H: H, 2H, 4H etc
Notes:
- Uses timeframe textbox instead of input resolution dropdown to allow for 240 120 and other custom TFs
- Uses symbol textbox instead of input symbol to avoid establishing multiple dummy security connections to the current ticker - otherwise empty symbols will prevent script from running
- Possible reasons for missing MAs on a chart:
- there may not be enough bars in history to start plotting it. For example, W1 EMA200 needs at least 200 bars on a weekly chart.
- for charts with low/fractional prices i.e. 0.00002 << 0.001 (default Y smoothing step) decrease Y smoothing as needed (set Y = 0.0000001) or disable it completely (set X,Y to 0,0)
- for charts with high price values i.e. 20000 >> 0.001 increase Y smoothing as needed (set Y = 10-20). Higher values exceeding MAs point density will cause it to disappear as there will be no points to plot. Different TFs may require diff adjustments
- TradingView Replay Mode UI and Pinescript security calls are limited to TFs >= D (D,2D,W,MN...) for free accounts
- attempting to plot any TF < D1 in Replay Mode will only result in straight lines, but all TFs will work properly in history and real-time modes. This is not a bug.
- Max Bars Back (num_bars) is limited to 5000 for free accounts (10000 for paid), will show error when exceeded. To plot on all available history set to 0 (default)
- Slow load/redraw times. This indicator becomes slower, its UI less responsive when:
- Pinescript Node.js graphics library is too slow and inefficient at plotting bars/objects in a browser window. Code optimization doesn't help much - the graphics engine is the main reason for general slowness.
- the chart has a long history (10000+ bars) in a browser's cache (you have scrolled back a couple of screens in a max zoom mode).
- Reload the page/Load a fresh chart and then apply the indicator or
- Switch to another Timeframe (old TF history will still remain in cache and that TF will be slow)
- in max possible zoom mode around 4500 bars can fit on 1 screen - this also slows down responsiveness. Reset Zoom level
- initial load and redraw times after a param change in UI also depend on TF. For example: D1/W1 - 2 sec, H1/H4 - 5-6 sec, M30 - 10 sec, M15/M5 - 4 sec, M1 - 5 sec. M30 usually has the longest history (up to 16000 bars) and W1 - the shortest (1000 bars).
- when indicator uses more MAs (plots) and timeframes it will redraw slower. Seems that up to 5 Timeframes is acceptable, but 6+ Timeframes can become very slow.
- show_last=last_bars plot limit doesn't affect load/redraw times, so it was removed from MA plot
- Max Bars Back (num_bars) default/custom set UI value doesn't seem to affect load/redraw times
- In max zoom mode all dynamic levels disappear (they behave like text)
- Dupe check includes symbol: symbol, tf, both subtypes - all must match for a duplicate group
- For the dupe check to work correctly a custom symbol must always include an exchange prefix. BB is not checked for dupes
Good Luck! Feel free to learn from/reuse the code to build your own indicators.


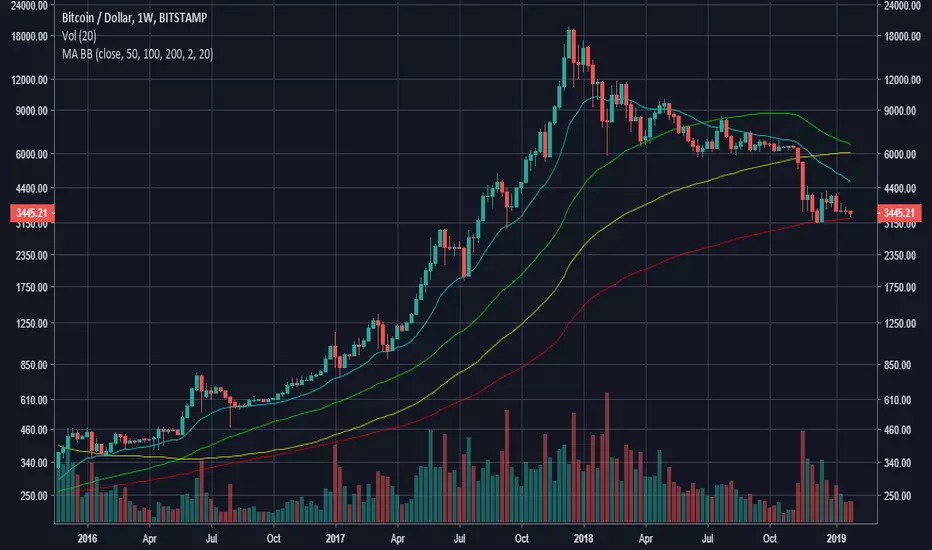
Triple Moving Averages & BBTriple SMAs (default 50 100 200) that turn green when trending up and red when trending down.
Includes standard bollinger bands which can be turned off.
Combines these 4 indicators into just 1.

Tangram Bot 2 - SmartbotPrimeira Versão do Script Tangram Bot 2 da Smartbot para tradingview.
A intenção é agilizar e fazer um teste prévio e rápido do setup.
O resultado indicado aqui jamais corresponderá a um resultado real. É apenas uma ferramenta de estudo.
Ainda falta fazer e melhorar a parte de gestão de risco.
Caso queria fazer alguma sugestão ao cógido para melhorar a gestão de risco ou caso tenha encontrado algum erro, favor comunicar.
O tangram bot 2 combina o uso de até dez Indicadores de Análise Técnica com Gerenciamento de Risco (stop gain, stop loss, stop móvel, realização parcial, bloqueio de reversões, lucro máximo por dia e prejuízo máximo por dia) e Filtros Diversos (sentido das operações, uso do after-market, bloqueio de nova entrada após saída, hora inicial e hora final para negociação). São utilizados os indicadores Médias Móveis, HiLo Activator, MACD, ADX, Estocástico, VWAP, IFR, Bandas de Bollinger, Stop ATR e SAR Parabólico

Moving Averages & Bollinger Bands3 Moving Averages and Bollinger Bands in 1 Indicator
SMA or EMA
Exponential Bollinger Bands available
Turn bands on or off
Customize period length and standard deviations

Stochastic Bollinger Strategy (Wicks)See 'Stochastic Bollinger Strategy' for details on how this works.
tips/donations are always appreciated venmo @rick-munoz

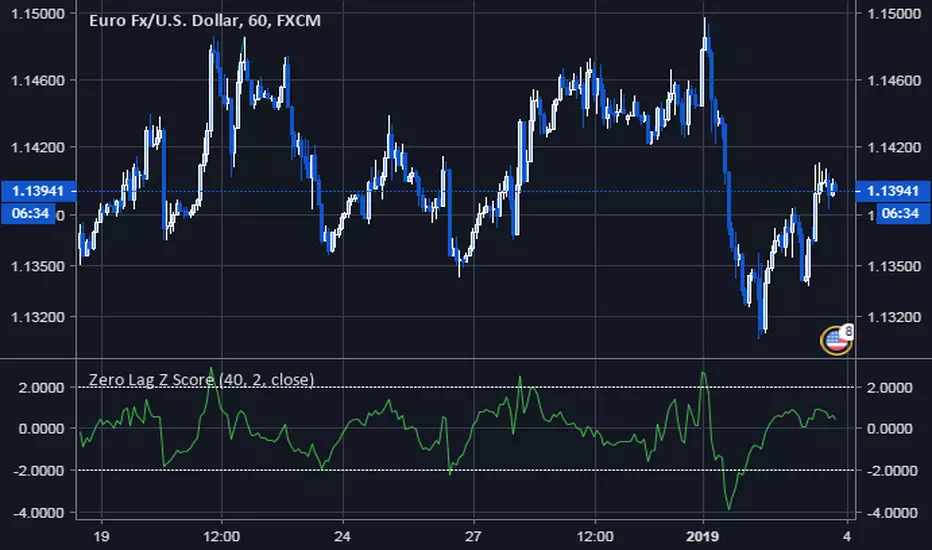
Zero Lag Z ScoreThis is a Zero Lag version of Z Score. It essentially uses ZEMA (Zero Lag EMA) as its moving average, and then plots how many deviations (positive or negative) input price is from the ZEMA. A Centered Oscillator version of Zero Lag Bollinger Bands
Trend Lines and MoreMulti-Indicator consisting of several useful indicators in a single package.
TREND LINES
-By default the 20 SMA and 50 SMA are shown.
-Use "MOVING AVERAGE TYPE" to select SMA, EMA, Double-EMA, Triple-EMA, or Hull.
-Use "50 MA TREND COLOR" to have the 50 turn green/red for uptrend/downtrend.
-Use "DAILY SOURCE ONLY" to always show daily averages regardless of timeframe.
-Use "SHOW LONG MA" to also include 100, 150, and 200 moving averages.
-Use "SHOW MARKERS" to show a small colored marker identifying which line is which.
OTHER INDICATORS
-You can show Bollinger Bands and Parabolic SAR.
-You can highlight key reversal times (9:50-10:10 and 14:40-15:00).
-You can show price offset markers, where was the price "n" periods ago.
That last one is useful to show the level of prices which are about to "fall off" the moving average
and be replaced with current price. So for example, if current price is significantly below the
200-days-ago price, you can gauge the difficulty for the 200 MA to start climbing again.

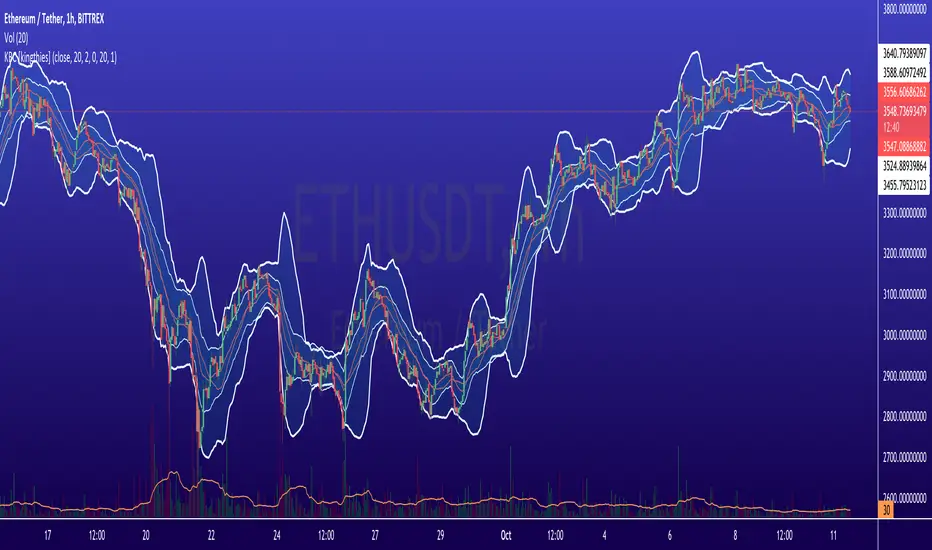
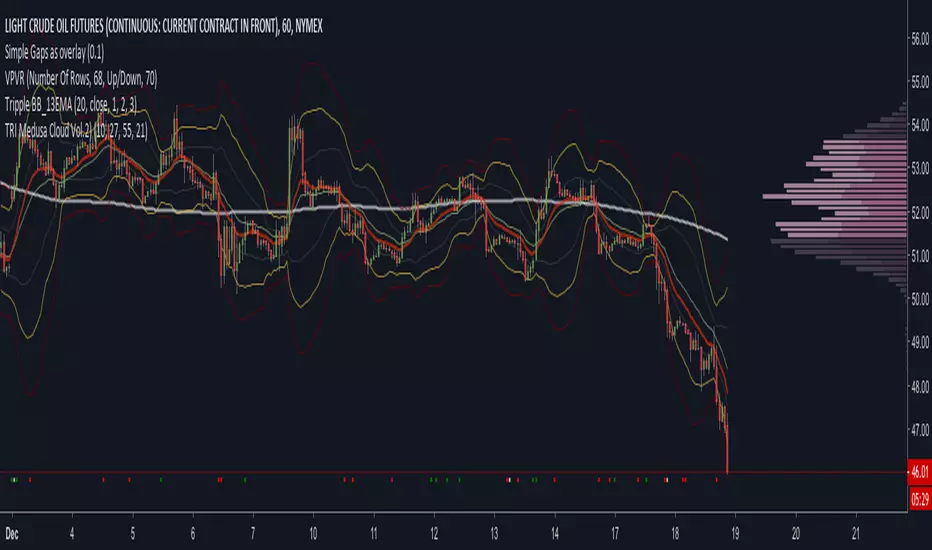
Tripple BB_13EMAHere is a script to use 3 types of Bollinger Bands.
It is like three resistances or ranges in wich the Chart generally likes to move. A 1, 2 and 3 Width BB. The Chart moves 90% between the yellow one.
As support for my study i use the 13 EMA. is the Chart over the 13 EMA and under the Yellow (2) BB the trend is bullish. Is t under the 13 EMA and over the Yellow BB the trend used to be bearish.
The opener the BB are the more Volatilaty and the more likely the Chart will not bounce against the Bands. It will more get stick to the yellow or red one (if it is between them it is a trend too) and will follow up or downwards.
Check it out
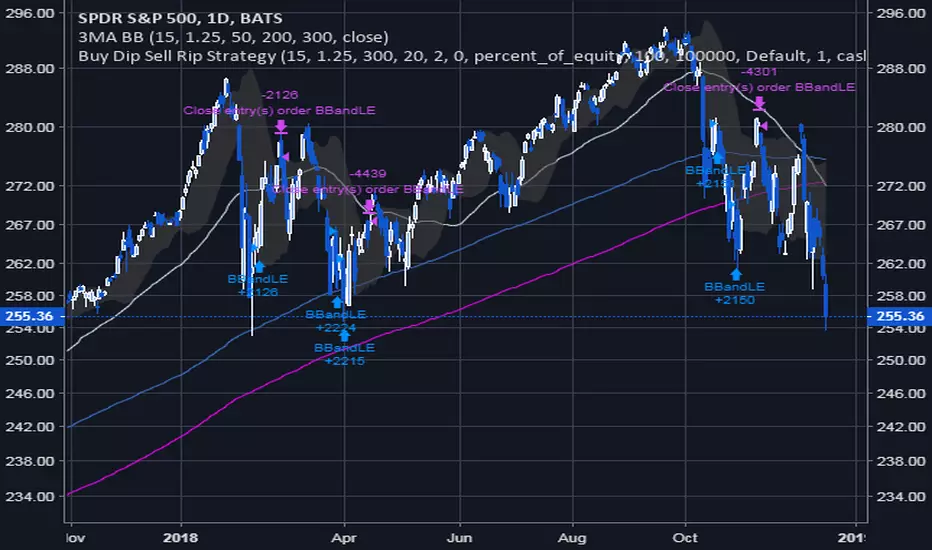
Buy Dip Sell Rip StrategyThis simple system buys the dip and sells the rip, depending on the trend of a long-term moving average. This strategy shows several interesting features. Applied to the S&P500, it still is a loser in a bear market, even though it achieves a 59% win rate. Overall, this shows the power of buying dips as an investment strategy, and shows promise as a base for other more short-term trading strategies.
Feel free to donate : )
Adaptive Bollinger Bands [jwammo12]This takes Ehler's work that dynamically finds the frequency of market cycles and applies it to the concept of Bollinger Bands.
First the dominant cycle length is found using Ehler's methods, this is then used as the length to the moving average and deviation.
I also ended up using an exponential average rather than a simple average for both the moving average center line and the sum of the squares when finding the deviation.
credit goes to LazyBear for coding Ehler's original ideas in pine, which I then used for this script.

Bollinger Breaks and Cycles Indicator - JDThe BBC indicator shows price in relation to the upper (in red) and lower (in green) Bollinger Bands
It highlights breaks in the Bands, where the 0-line represents a price equal to the band.
These breaks can either be used as take-profit points or as entry points, depending on trend direction.
Entries can be at the beginning of a break (eg. for impulse or continuation moves)
or at the end (mostly for expected trend reversals)
To find the best setups, the BBC should be accompanied by other indicators (preferably ones that focus on different aspects)
The oscilating line in the middle indicates market cycles
JD.
#NotTradingAdvice #DYOR

RSI Bollinger WaveTrend Cycle Multi Free TSPMulti indicator
Bollinger Band x RSI
Wave Trend
Cycles
Free users will like it :)
Fell free to like share comments... and check my other stuff :]