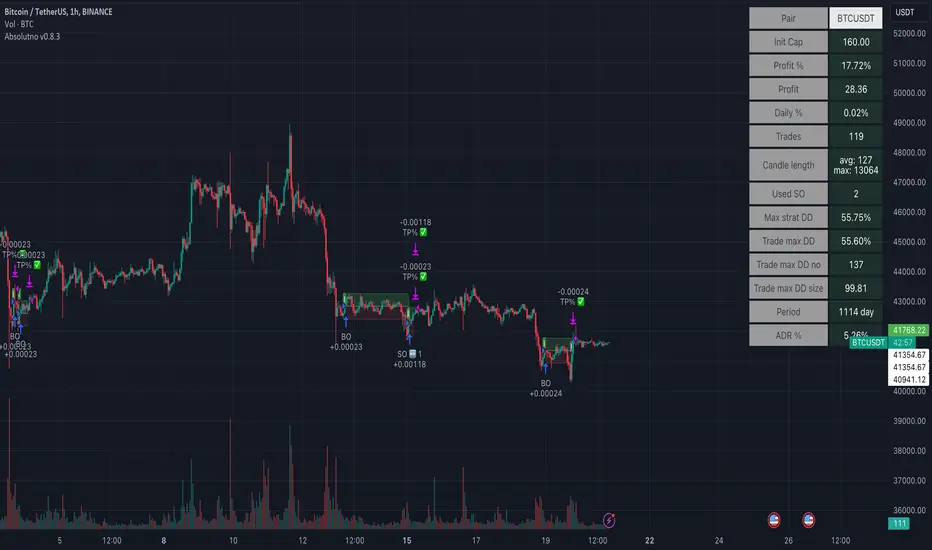
TTP AbsolutnoAbsolutno is a pine script strategy for backtesting DCA bots with a different approach for placing both safety orders and take profit levels.
Motivation
Using DCA bots with safety orders most of the time is great during bull markets but in bear markets and strong downtrends it can be really challenging to close your deals only relying on safety orders placed based on percentages: price scale and volume scale.
In the past we introduced a script called "add funds simulator" that people used for sending alerts to bots to add funds and help closing deals in red.
We want to cross the use of TA with the safety orders with the intention of getting better results than statically placed safety orders.
What does Absolutno do?
Absolutno uses TA for safety orders, both for opening new safety orders and also to define how low they should be placed based on the volatility of the asset.
Main features
- ATR SO mode: Safety orders can be placed dynamically based on the general volatility of the asset plus the current volatility.
- TA based SO entries: Safety orders are only placed when the deal start condition is true not only when the price pulls back below the next safety order price level. This acts like a hybrid between "add funds simulator" and a traditional DCA bot. Once a safety order is filled, the next SO level gets active waiting for a DSC to trigger below the new entry level.
- Take profit scale: Traditional DCA bots offer a percentage or TA based exit conditions. Absolutno offers a new mode when you can decide to increase or decrease the TP level with each SO getting filled. For example a value of 1.1 TP scale will cause that each SO getting filled makes the TP% grow 10%. A value of 0.9% will reduce each SO by 10%. The lower the price goes you can "lower your expectation", or if you are filling bullish you can actually increase it.
External signal
It comes with a built-in deal start condition that uses RSI cross over 30 which is used only for illustration purposes since Absolutno is designed to be used with external signals.
Use any external signal to enter a new deal and for adding new safety orders.
You can also activate external take profit signal.
When external TP is enabled, all TP features from the bot are disabled to only react to what the external signal instructs the bot.
Bot integration and alerts
Three type of alerts will be sent to the bot: open deal, add funds and close deal.
You will need to enter your bot id and email token in the settings.
Since this strategy uses add funds: you must be aware that the alerts sent from this strategy will contain the amount of funds to add and therefore the bot receiving these alerts will respect them EVEN if the bot was defined with different SO sizes.
Please make sure you fully understand this before using this signal.
The base order alerts don't contain funds information so the bot will always use the base order size as defined in its own settings.
Cerca negli script per "bot"
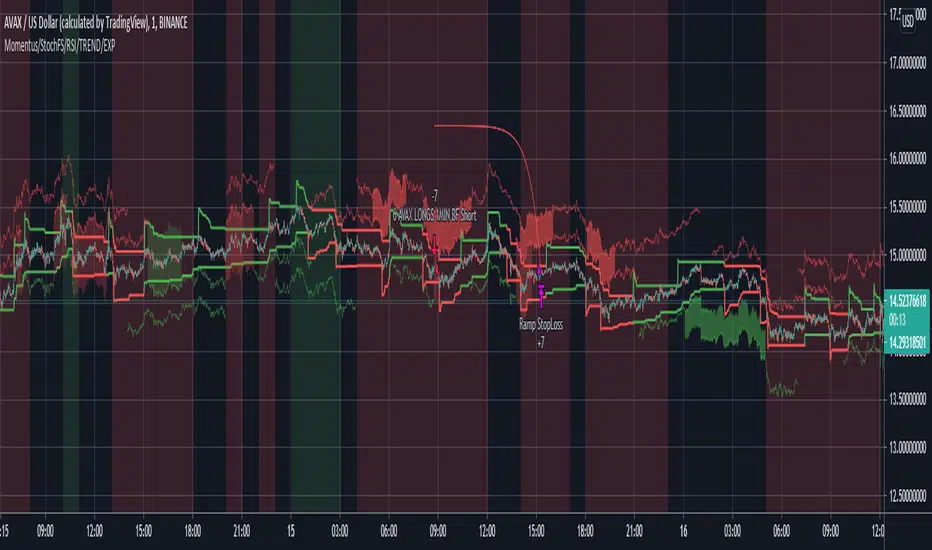
MACD/RVSI/Stoch/RSI/EXP(Drawdown)I have been trying for several months to get a script to work on the 1min and this one gives some good backtest results. This script will also work on higher timeframes however, I've not extensively tested on higher timeframes. My aim was to get results on about 20 crypto coins then run the 1min bots in parallel looking for small frequent profits across all the coins. If you would like me to try and fit backtest results to any coin or pair on any timeframe please do get in touch anytime.
It's based on several indicators which are combined and then a newish way for the stop loss to implement based on an exponential rising which limits the time in each trade unless the price moves in the direction of the trade. The other useful feature is drawdown minimization which previously made all of my 1minute bot attempts non-practical due to differences between backtesting and actually running the bot(s) live.
Its possible at the top to paste in strategy comments which can be used through web-hooks for auto trading bots. Leaving these blank just defaults to the pre-programmed comments that provide some indication of why a trade was exited.
It is possible to select for Short and/or Long trades. Note however, that there are exponential markers on the charts for both long and short trades in any setting. I found that this way the bot worked well with regards to timing.
The next part of the user interface settings gets a bit tricky so try and use the sample parameters provided below. For example, select a crypto coin then try some of the options below until a reasonable backtest result in obtained (or select the best from the parameter groups tested) then move down the settings interface to optimise with the remaining settings.
So 'Use MACD/RVSI', 'RSI clause' and 'Use Stochastic' are set to true for the below sample settings (1min timeframe).
MACD/RVSI Confluence Resolution (1min, 2min, 5min, 10min, 1hour)
Timeframe RSI (1min, 2min, 3min, 15min, 1hour)
FastStoch, SlowStoch (1min, 45min: 5min, 30min: 1min, 1hour: 5min, 1hour)
Eg. for FTX:ETHPERP (MACD/RVSI Confluence Resolution=1hour, Timeframe RSI= 1min, FastStoch = 1min, SlowStoch = 45min)
Setting the timings is tricky - there is a lot going on. Have a look at the chart and select/deselect the options. The MACD/RVSI Confluence Resolution shows red and green vertical regions on the chart background. The Timeframe RSI colors the candle bodies red and green. These go green if the RSI crossed over 31% or red in the RSI crossed under 69%. The MACD/RVSI Confluence Resolution is explained in more detail in one of my other scripts. Then the Slow Stoch colors above and below the price action with red or green lines depending if on an uptrend or downtrend (approximately). Where there is also an up/down trend on the faster timeframe stoch there are vertical shaded fill regions between the slow stop above/below lines.
With all the above conditions selected to represent the data (looking at strategy backtest results whilst adjusting) there is a reasonable approximation to a credible trade.
So once an ok backtest result is obtained by selecting timing settings. Its ontot the Stop Ramp Settings. This is an exponential line which rises rapidly after a period of time thus exiting the trade or going upwards with the trade. It kind of limits the maximum time a trade will stay in position which forms part of the timing aspect of this bot. Look at the chart exponential red lines and adjust the settings, along with the backtest results to select a good timing.
Then its the Drawdown Catcher and the Take Profit Setting. Start with the drawdown catcher disabled i.e. set to zero. Put in a conservative Take Profit, for example if a Take Profit at 6% gives the best backtest results, go for 4% to account for differences between backtest results and actual live bot performance.
Then start to increase the Drawdown Catcher. This shades a lime region where the bot will not enter a trade. I found that with most trades using this bot, if the price action moved in the direction of the trade (long or short) at the onset - this gave most of the good results (high probability of positive trade). Also if a trade entered at the start price and when south, the accumilated drawdown from these failing trades made all previous 1min bot attempt non=profitable in practice (even with good backtest results). The exp timing and also this drawdown reduction strategies seem to be the thing which makes this approach credible.
Try to go for settings that give a very high change of positive trade. For example, an 85% profitable trades will probably provide say 55% positive trades in practice as its always highly possible to just fit the parameters to the exact position/trade timings - and in reality going forwards these don't play out the same. Also a Profit Factor of 2 is about the minimum I would accept - again this provides for example a Profit Factor of 1.2 in practive.
However all being said - I think its possible with this bot on the 1min across lots of coins - with regularly updating settings - to make profits. (Not financial advice)
Please do get in touch if you would like me to fit this bot to anytimeframe to any trade.
MoonFlag PhD
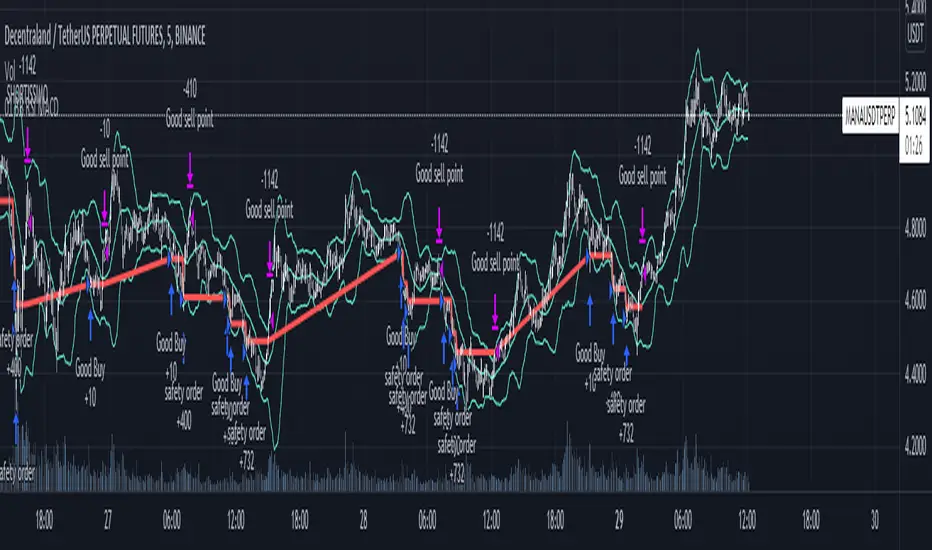
[laoowai]BNB_USDT_3m_3Commas_Bollinger_MACD_RSI_StrategyBNB_USDT _3m
Release Notes:
Time: 3min
Pair: BNB_USDT
Use: {{strategy.order.alert_message}}
What's the difference with 3Commas Bollinger Strategy by tedwardd:
1. Initial capital: 1210 USDT (10$ Base order / 400$*3 Safety order), if you will change, please change JUST safety order volume or number of safety orders 2-3
2. Using just 2(3) safety order (original script 4)
3. More high-performance strategy for BNB_USDT
4. Using MACD to sell order (original script take profit by scale), thanks Drun30 .
5. Using RSI to analyze the market conditions.
Need to change:
bot_id = input(title="3Commas Bot ID", defval=" YOUR DATA ")
email_token = input(title="Bot Email Token", defval=" YOUR DATA ")
---------------------------------------------------------------------------------------------------------------------------------------------------------------------------------------------------
FAQ copy from tedwardd
---------------------------------------------------------------------------------------------------------------------------------------------------------------------------------------------------
This strategy is intended for use as a way of backtesting various parameters available on 3commas.
The primary inputs for the strategy are:
---------------------------------------------------------------------------------------------------------------------------------------------------------------------------------------------------
// USER INPUTS
Short MA Window - The length of the Short moving average
Long MA Window - The length of the Long moving average
Upper Band Offset - The offset to use for the upper bollinger offset
Lower Band Offset - The offset to use for the lower bollinger offset
Long Stop Loss % - The stop loss percentage to test
Long Take Profit % - The Take profit percentage to test
Initial SO Deviation % - The price deviation percentage required to place to first safety order
Safety Order Vol Step % - The volume scale to test
3Commas Bot ID - (self-explanatory)
Bot Email Token - Found in the deal start message for your bot (see link in the previous section for details)
3Commas Bot Trading Pair - The pair to include for composite bot start deals (should match the format of 3commas, not TradingView IE. USDT_BTC not BTCUSDT )
---------------------------------------------------------------------------------------------------------------------------------------------------------------------------------------------------
Start Date, Month, Year and End Date, Month, and Year all apply to the backtesting window. By default, it will use as much data as it can give the current period select (there is less historical data available for periods below 1H) back as far as 2016 (there appears to be no historical data on Trading view much before this). If you would like to test a different period of time, just change these values accordingly.
---------------------------------------------------------------------------------------------------------------------------------------------------------------------------------------------------
Composite bot using a Bollinger band type trading strategy. While its primary intention is to provide users a way of backtesting bot parameters, it can also be used to trigger a deal start by either using the {{strategy.order.alert_message}} field in your alert and providing the bot details in the configuration screen for the strategy or by including the usual deal start message provided by 3commas.
---------------------------------------------------------------------------------------------------------------------------------------------------------------------------------------------------
Original script:
1. 3Commas Bollinger Strategy by tedwardd
2. Momentum Strategy ( BTC /USDT; 1h) - MACD (with source code) by Drun30

[3Commas] Turtle StrategyTurtle Strategy
🔷 What it does: This indicator implements a modernized version of the Turtle Trading Strategy, designed for trend-following and automated trading with webhook integration. It identifies breakout opportunities using Donchian channels, providing entry and exit signals.
Channel 1: Detects short-term breakouts using the highest highs and lowest lows over a set period (default 20).
Channel 2: Acts as a confirmation filter by applying an offset to the same period, reducing false signals.
Exit Channel: Functions as a dynamic stop-loss (wait for candle close), adjusting based on market structure (default 10 periods).
Additionally, traders can enable a fixed Take Profit level, ensuring a systematic approach to profit-taking.
🔷 Who is it for:
Trend Traders: Those looking to capture long-term market moves.
Bot Users: Traders seeking to automate entries and exits with bot integration.
Rule-Based Traders: Operators who prefer a structured, systematic trading approach.
🔷 How does it work: The strategy generates buy and sell signals using a dual-channel confirmation system.
Long Entry: A buy signal is generated when the close price crosses above the previous high of Channel 1 and is confirmed by Channel 2.
Short Entry: A sell signal occurs when the close price falls below the previous low of Channel 1, with confirmation from Channel 2.
Exit Management: The Exit Channel acts as a trailing stop, dynamically adjusting to price movements. To exit the trade, wait for a full bar close.
Optional Take Profit (%): Closes trades at a predefined %.
🔷 Why it’s unique:
Modern Adaptation: Updates the classic Turtle Trading Strategy, with the possibility of using a second channel with an offset to filter the signals.
Dynamic Risk Management: Utilizes a trailing Exit Channel to help protect gains as trades move favorably.
Bot Integration: Automates trade execution through direct JSON signal communication with your DCA Bots.
🔷 Considerations Before Using the Indicator:
Market & Timeframe: Best suited for trending markets; higher timeframes (e.g., H4, D1) are recommended to minimize noise.
Sideways Markets: In choppy conditions, breakouts may lead to false signals—consider using additional filters.
Backtesting & Demo Testing: It is crucial to thoroughly backtest the strategy and run it on a demo account before risking real capital.
Parameter Adjustments: Ensure that commissions, slippage, and position sizes are set accurately to reflect real trading conditions.
🔷 STRATEGY PROPERTIES
Symbol: BINANCE:ETHUSDT (Spot).
Timeframe: 4h.
Test Period: All historical data available.
Initial Capital: 10000 USDT.
Order Size per Trade: 1% of Capital, you can use a higher value e.g. 5%, be cautious that the Max Drawdown does not exceed 10%, as it would indicate a very risky trading approach.
Commission: Binance commission 0.1%, adjust according to the exchange being used, lower numbers will generate unrealistic results. By using low values e.g. 5%, it allows us to adapt over time and check the functioning of the strategy.
Slippage: 5 ticks, for pairs with low liquidity or very large orders, this number should be increased as the order may not be filled at the desired level.
Margin for Long and Short Positions: 100%.
Indicator Settings: Default Configuration.
Period Channel 1: 20.
Period Channel 2: 20.
Period Channel 2 Offset: 20.
Period Exit: 10.
Take Profit %: Disable.
Strategy: Long & Short.
🔷 STRATEGY RESULTS
⚠️Remember, past results do not guarantee future performance.
Net Profit: +516.87 USDT (+5.17%).
Max Drawdown: -100.28 USDT (-0.95%).
Total Closed Trades: 281.
Percent Profitable: 40.21%.
Profit Factor: 1.704.
Average Trade: +1.84 USDT (+1.80%).
Average # Bars in Trades: 29.
🔷 How to Use It:
🔸 Adjust Settings:
Select your asset and timeframe suited for trend trading.
Adjust the periods for Channel 1, Channel 2, and the Exit Channel to align with the asset’s historical behavior. You can visualize these channels by going to the Style tab and enabling them.
For example, if you set Channel 2 to 40 with an offset of 40, signals will take longer to appear but will aim for a more defined trend.
Experiment with different values, a possible exit configuration is using 20 as well. Compare the results and adjust accordingly.
Enable the Take Profit (%) option if needed.
🔸Results Review:
It is important to check the Max Drawdown. This value should ideally not exceed 10% of your capital. Consider adjusting the trade size to ensure this threshold is not surpassed.
Remember to include the correct values for commission and slippage according to the symbol and exchange where you are conducting the tests. Otherwise, the results will not be realistic.
If you are satisfied with the results, you may consider automating your trades. However, it is strongly recommended to use a small amount of capital or a demo account to test proper execution before committing real funds.
🔸Create alerts to trigger the DCA Bot:
Verify Messages: Ensure the message matches the one specified by the DCA Bot.
Multi-Pair Configuration: For multi-pair setups, enable the option to add the symbol in the correct format.
Signal Settings: Enable the option to receive long or short signals (Entry | TP | SL), copy and paste the messages for the DCA Bots configured.
Alert Setup:
When creating an alert, set the condition to the indicator and choose "alert() function call only".
Enter any desired Alert Name.
Open the Notifications tab, enable Webhook URL, and paste the Webhook URL.
For more details, refer to the section: "How to use TradingView Custom Signals".
Finalize Alerts: Click Create, you're done! Alerts will now be sent automatically in the correct format.
🔷 INDICATOR SETTINGS
Period Channel 1: Period of highs and lows to trigger signals
Period Channel 2: Period of highs and lows to filter signals
Offset: Move Channel 2 to the right x bars to try to filter out the favorable signals.
Period Exit: It is the period of the Donchian channel that is used as trailing for the exits.
Strategy: Order Type direction in which trades are executed.
Take Profit %: When activated, the entered value will be used as the Take Profit in percentage from the entry price level.
Use Custom Test Period: When enabled signals only works in the selected time window. If disabled it will use all historical data available on the chart.
Test Start and End: Once the Custom Test Period is enabled, here you select the start and end date that you want to analyze.
Check Messages: Check Messages: Enable this option to review the messages that will be sent to the bot.
Entry | TP | SL: Enable this options to send Buy Entry, Take Profit (TP), and Stop Loss (SL) signals.
Deal Entry and Deal Exit: Copy and paste the message for the deal start signal and close order at Market Price of the DCA Bot. This is the message that will be sent with the alert to the Bot, you must verify that it is the same as the bot so that it can process properly.
DCA Bot Multi-Pair: You must activate it if you want to use the signals in a DCA Bot Multi-pair in the text box you must enter (using the correct format) the symbol in which you are creating the alert, you can check the format of each symbol when you create the bot.
👨🏻💻💭 We hope this tool helps enhance your trading. Your feedback is invaluable, so feel free to share any suggestions for improvements or new features you'd like to see implemented.
__
The information and publications within the 3Commas TradingView account are not meant to be and do not constitute financial, investment, trading, or other types of advice or recommendations supplied or endorsed by 3Commas and any of the parties acting on behalf of 3Commas, including its employees, contractors, ambassadors, etc.

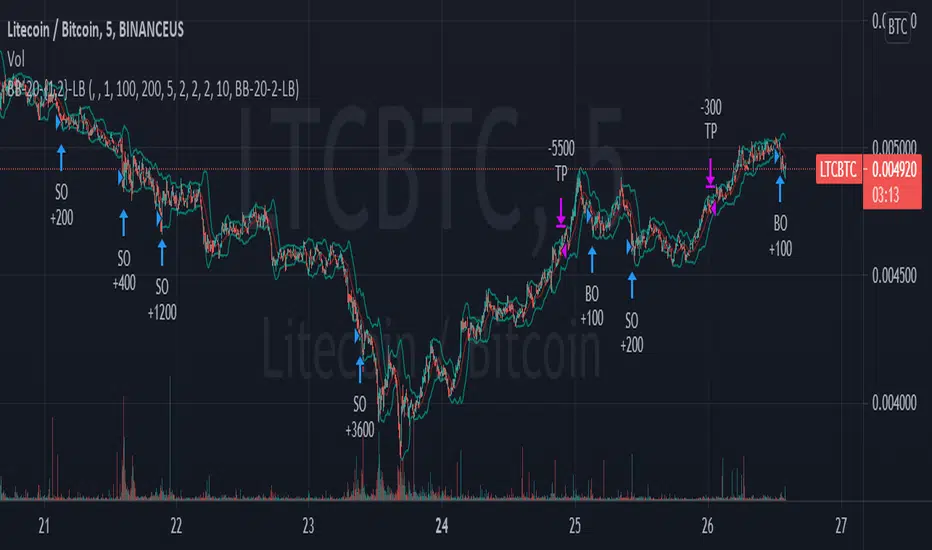
TA Presets - BB-20-1-LBThis is a near identical drop-in replacement for the 3commas TA Presets - BB-20-1-LB signal. Since you can not get this signal unless you are using Binance.com, I needed to produce my own for use with other exchanges. You are free to use this strategy yourself. It will always remain publicly available for free as there are no special tricks here, just your basic Bollinger Band strategy.
Known Issues and Limitations:
Trailing take profits are currently not supported for back testing -- You can still use them on a bot that uses this signal to trigger deal starts, just don't expect the performance of the bot to be the same as what's in the backtest if you do.
Only simple bots supported (no composite bot support yet)
Instructions
The options in the configuration screen are the same as they would be on the bot configuration screen. You can use the back testing screen to get a general idea of how the bot should perform on a given coin pair. Once you have the settings how you want, set the "Bot ID" and "Email Token" fields. to match those used in the deal start message for your bot. Do not include quotes around either of them. Your bot ID should just be a string of numbers and your email token will be a string of letters and numbers separated by hyphens. Once you enter these in to the settings, you can create your alert. Select "BB-20-1-LB" from the dropdown on the alert screen and type {{strategy.order.alert_message}} in the text box (NOTHING ELSE, NO QUOTES, NOTHING). That's it, the script will generate the rest of the deal start message for you automatically.
Important Notes
This may go without saying but make sure that you are using the chart for your exchange when setting this up to control a bot. While it may look like prices are the same across the different exchanges, subtle differences in volatility and trading volume WILL make a difference and your bot WILL NOT perform as shown on the back test.
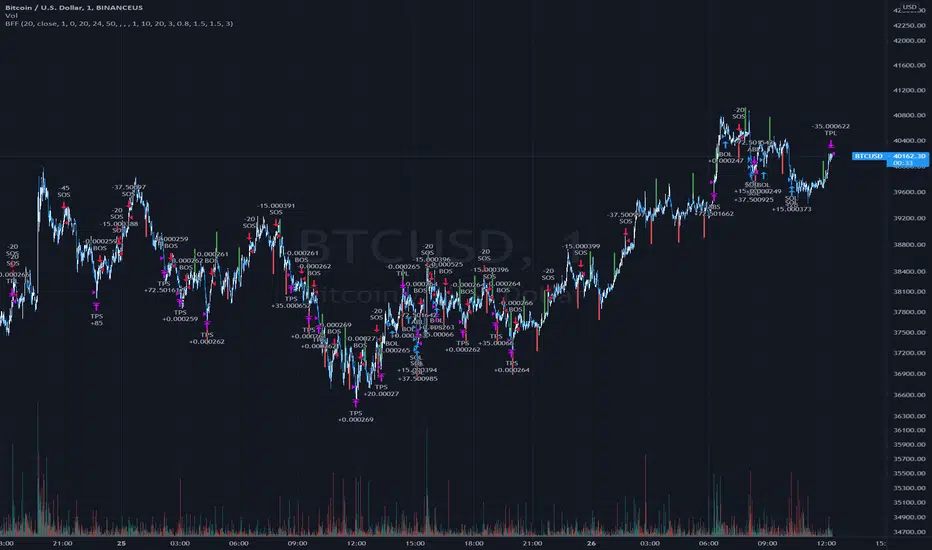
3Commas Bollinger StrategyThis strategy is intended for use as a way of backtesting various parameters available on 3commas.io composite bot using a bollinger band type trading strategy. While it's primary intention is to provide users a way of backtesting bot parameters, it can also be used to trigger a deal start by either using the {{strategy.open.alert_message}} field in your alert and providing the bot details in the configuration screen for the strategy or by including the usual deal start message provided by 3commas. You can find more information about how to do this from help.3commas.io
The primary inputs for the strategy are:
// USER INPUTS
Short MA Window - The length of the Short moving average
Long MA Window - The length of the Long moving average
Upper Band Offset - The offset to use for the upper bollinger offset
Lower Band Offset - The offset to use for the lower bollinger offset
Long Stop Loss % - The stop loss percentage to test
Long Take Profit % - The Take profit percentage to test
Initial SO Deviation % - The price deviation percentage required to place to first safety order
Safety Order Vol Step % - The volume scale to test
3Commas Bot ID - (self explanatory)
Bot Email Token - Found in the deal start message for your bot (see link in previous section for details)
3Commas Bot Trading Pair - The pair to include for composite bot start deals (should match format of 3commas, not TradingView IE. USDT_BTC not BTCUSDT)
Start Date, Month, Year and End Date, Month and Year all apply to the backtesting window. By default it will use as much data as it can given the current period select (there is less historical data available for periods below 1H) back as far as 2016 (there appears to be no historical data on Trading view much before this). If you would like to test a different period of time, just change these values accordingly.
Known Issues
Currently there are a couple of issues with this strategy that you should be aware of. I may fix them at some point in the future but they don't really bug me so this is more for informational purposes than a promise that they may one day be fixed.
Does not test trailing take profit
Number of safety orders and Safety Order Step Scale are currently not user configurable (must edit source code)
Using the user configuration to generate deal start message assumes you are triggering a composite bot, not a simple bot.

[3Commas] HA & MAHA & MA
🔷What it does: This tool is designed to test a trend-following strategy using Heikin Ashi candles and moving averages. It enters trades after pullbacks, aiming to let profits run once the risk-to-reward ratio reaches 1:1 while securing the position.
🔷Who is it for: It is ideal for traders looking to compare final results using fixed versus dynamic take profits by adjusting parameters and trade direction—a concept applicable to most trading strategies.
🔷How does it work: We use moving averages to define the market trend, then wait for opposite Heikin Ashi candles to form against it. Once these candles reverse in favor of the trend, we enter the trade, using the last swing created by the pullback as the stop loss. By applying the breakeven ratio, we protect the trade and let it run, using the slower moving average as a trailing stop.
A buy signal is generated when:
The previous candle is bearish (ha_bear ), indicating a pullback.
The fast moving average (ma1) is above the slow moving average (ma2), confirming an uptrend.
The current candle is bullish (ha_bull), showing trend continuation.
The Heikin Ashi close is above the fast moving average (ma1), reinforcing the bullish bias.
The real price close is above the open (close > open), ensuring bullish momentum in actual price data.
The signal is confirmed on the closed candle (barstate.isconfirmed) to avoid premature signals.
dir is undefined (na(dir)), preventing repeated signals in the same direction.
A sell signal is generated when:
The previous candle is bullish (ha_bull ), indicating a temporary upward move before a potential reversal.
The fast moving average (ma1) is below the slow moving average (ma2), confirming a downtrend.
The current candle is bearish (ha_bear), showing trend continuation to the downside.
The Heikin Ashi close is below the fast moving average (ma1), reinforcing bearish pressure.
The real price close is below the open (close < open), confirming bearish momentum in actual price data.
The signal is confirmed after the candle closes (barstate.isconfirmed), avoiding premature entries.
dir is undefined (na(dir)), preventing consecutive signals in the same direction.
In simple terms, this setup looks for trend continuation after a pullback, confirming entries with both Heikin Ashi and real price action, supported by moving average alignment to avoid false signals.
If the price reaches a 1:1 risk-to-reward ratio, the stop will be moved to the entry point. However, if the slow moving average surpasses this level, it will become the new exit point, acting as a trailing stop
🔷Why It’s Unique
Easily visualizes the benefits of using risk-to-reward ratios when trading instead of fixed percentages.
Provides a simple and straightforward approach to trading, embracing the "keep it simple" concept.
Offers clear visualization of DCA Bot entry and exit points based on user preferences.
Includes an option to review the message format before sending signals to bots, with compatibility for multi-pair and futures contract pairs.
🔷 Considerations Before Using the Indicator
⚠️Very important: The indicator must be used on charts with real price data, such as Japanese candlesticks, line charts, etc. Do not use it on Heikin Ashi charts, as this may lead to unrealistic results.
🔸Since this is a trend-following strategy, use it on timeframes above 4 hours, where market noise is reduced and trends are clearer. Also, carefully review the statistics before using it, focusing on pairs that tend to have long periods of well-defined trends.
🔸Disadvantages:
False Signals in Ranges: Consolidating markets can generate unreliable signals.
Lagging Indicator: Being based on moving averages, it may react late to sudden price movements.
🔸Advantages:
Trend Focused: Simplifies the identification of trending markets.
Noise Reduction: Uses Heikin Ashi candles to identify trend continuation after pullbacks.
Broad Applicability: Suitable for forex, crypto, stocks, and commodities.
🔸The strategy provides a systematic way to analyze markets but does not guarantee successful outcomes. Use it as an additional tool rather than relying solely on an automated system.
Trading results depend on various factors, including market conditions, trader discipline, and risk management. Past performance does not ensure future success, so always approach the market cautiously.
🔸Risk Management: Define stop-loss levels, position sizes, and profit targets before entering any trade. Be prepared for potential losses and ensure your approach aligns with your overall trading plan.
🔷 STRATEGY PROPERTIES
Symbol: BINANCE:BTCUSDT (Spot).
Timeframe: 4h.
Test Period: All historical data available.
Initial Capital: 10000 USDT.
Order Size per Trade: 1% of Capital, you can use a higher value e.g. 5%, be cautious that the Max Drawdown does not exceed 10%, as it would indicate a very risky trading approach.
Commission: Binance commission 0.1%, adjust according to the exchange being used, lower numbers will generate unrealistic results. By using low values e.g. 5%, it allows us to adapt over time and check the functioning of the strategy.
Slippage: 5 ticks, for pairs with low liquidity or very large orders, this number should be increased as the order may not be filled at the desired level.
Margin for Long and Short Positions: 100%.
Indicator Settings: Default Configuration.
MA1 Length: 9.
MA2 Length: 18.
MA Calculations: EMA.
Take Profit Ratio: Disable. Ratio 1:4.
Breakeven Ratio: Enable, Ratio 1:1.
Strategy: Long & Short.
🔷 STRATEGY RESULTS
⚠️Remember, past results do not guarantee future performance.
Net Profit: +324.88 USDT (+3.25%).
Max Drawdown: -81.18 USDT (-0.78%).
Total Closed Trades: 672.
Percent Profitable: 35.57%.
Profit Factor: 1.347.
Average Trade: +0.48 USDT (+0.48%).
Average # Bars in Trades: 13.
🔷 HOW TO USE
🔸 Adjust Settings:
The default values—MA1 (9) and MA2 (18) with EMA calculation—generally work well. However, you can increase these values, such as 20 and 40, to better identify stronger trends.
🔸 Choose a Symbol that Typically Trends:
Select an asset that tends to form clear trends. Keep in mind that the Strategy Tester results may show poor performance for certain assets, making them less suitable for sending signals to bots.
🔸 Experiment with Ratios:
Test different take profit and breakeven ratios to compare various scenarios—especially to observe how the strategy performs when only the trade is protected.
🔸This is an example of how protecting the trade works: once the price moves in favor of the position with a 1:1 risk-to-reward ratio, the stop loss is moved to the entry price. If the Slow MA surpasses this level, it will act as a trailing stop, aiming to follow the trend and maximize potential gains.
🔸In contrast, in this example, for the same trade, if we set a take profit at a 1:3 risk-to-reward ratio—which is generally considered a good risk-reward relationship—we can see how a significant portion of the upward move is left on the table.
🔸Results Review:
It is important to check the Max Drawdown. This value should ideally not exceed 10% of your capital. Consider adjusting the trade size to ensure this threshold is not surpassed.
Remember to include the correct values for commission and slippage according to the symbol and exchange where you are conducting the tests. Otherwise, the results will not be realistic.
If you are satisfied with the results, you may consider automating your trades. However, it is strongly recommended to use a small amount of capital or a demo account to test proper execution before committing real funds.
🔸Create alerts to trigger the DCA Bot:
Verify Messages: Ensure the message matches the one specified by the DCA Bot.
Multi-Pair Configuration: For multi-pair setups, enable the option to add the symbol in the correct format.
Signal Settings: Enable whether you want to receive long or short signals (Entry | TP | SL), copy and paste the the messages for the DCA Bots configured.
Alert Setup:
When creating an alert, set the condition to the indicator and choose "alert() function call only.
Enter any desired Alert Name.
Open the Notifications tab, enable Webhook URL, and paste the Webhook URL.
For more details, refer to the section: "How to use TradingView Custom Signals".
Finalize Alerts: Click Create, you're done! Alerts will now be sent automatically in the correct format.
🔷 INDICATOR SETTINGS
MA 1: Fast MA Length
MA 2: Slow MA Length
MA Calc: MA's Calculations (SMA,EMA, RMA,WMA)
TP Ratio: This is the take profit ratio relative to the stop loss, where the trade will be closed in profit.
BE Ratio: This is the breakeven ratio relative to the stop loss, where the stop loss will be updated to breakeven or if the MA2 is greater than this level.
Strategy: Order Type direction in which trades are executed.
Use Custom Test Period: When enabled signals only works in the selected time window. If disabled it will use all historical data available on the chart.
Test Start and End: Once the Custom Test Period is enabled, here you select the start and end date that you want to analyze.
Check Messages: Enable the table to review the messages to be sent to the bot.
Entry | TP | SL: Enable this options to send Buy Entry, Take Profit (TP), and Stop Loss (SL) signals.
Deal Entry and Deal Exit : Copy and paste the message for the deal start signal and close order at Market Price of the DCA Bot. This is the message that will be sent with the alert to the Bot, you must verify that it is the same as the bot so that it can process properly so that it executes and starts the trade.
DCA Bot Multi-Pair: You must activate it if you want to use the signals in a DCA Bot Multi-pair in the text box you must enter (using the correct format) the symbol in which you are creating the alert, you can check the format of each symbol when you create the bot.
👨🏻💻💭 We hope this tool helps enhance your trading. Your feedback is invaluable, so feel free to share any suggestions for improvements or new features you'd like to see implemented.
__
The information and publications within the 3Commas TradingView account are not meant to be and do not constitute financial, investment, trading, or other types of advice or recommendations supplied or endorsed by 3Commas and any of the parties acting on behalf of 3Commas, including its employees, contractors, ambassadors, etc.

Bollinger Flip Flop StrategyThis strategy combines both long and short Bollinger band strategies with a signal to determine to determine when it's appropriate to use each. Additionally, the strategy has protections in place for market conditions which would normally cause a trade to be stuck due to a long market trend change. Think of it like a stop loss but instead of basing the stop on a percentage from entry, it's based on prevailing market conditions.
This strategy is ideal for controlling trading bots on the 3commas.io platform. To do this, you will need to set up two "simple" bots, one for short trades and one for long trades. Other than their direction, they should be configured identically. Set the parameters for the bot the same as you have them set in the strategy preferences. Once you've done this, set the "Short Bot ID" and "Long Bot ID" fields to the ID numbers for each bot, respectively. Next, set the Email Token parameter (this will be the same for both bots). Once you've done this, you need only configure a single alert per coin pair with the alert message set to {{strategy.order.alert_message}}. Make sure you have all of the strategy settings, including bot IDs and email tokens set correctly before creating the alert . These parameters are saved in the alert and can be safely changed on the active chart once the alert is created without affecting the alert.
High Low Reversal This bot makes use of an algorithm which detects new highs and lows. When doing long trades, the bot will trigger a buy order on a newly made low. When making shorts, the bot will trigger a short trade on new highs.
Currently, the bot is optimized for cryptocurrencies on the M15 time frame. With the right amount of leverage and portfolio optimization this bot can obtain very strong results.
Feel free to optimize it to your own liking on different assets and/or time frames.
This bot performs exceptionally well in trending markets. Currently, it's only making long trades, but you can make it do short trades in the control panel.
The settings of the back test as follows:
starting capital = 100k
leverage = 1
commission = 0.2%
Equity per trade = 50%. Since the bot only makes one trade at a time you can allow it to use a bigger portion of your balance per trade.
I've also made a study-script for easy implementation on the exchange. You get that script once you get access to this bot.

TitanEdge Algo Suite — 4H BTC & ETH (Delta Exchange Ready)TitanEdge Algo Suite — 4H BTC & ETH (Delta Exchange Ready)
TitanEdge Algo Suite is a next-generation trading system that fuses volatility-adaptive logic, order-block structure, SuperTrend direction filtering, and ATR-based exits into a single modular framework.
It’s engineered for 4-hour BTC and ETH swing trading, delivering institutional-grade entries, dynamic risk control, and precise exits.
⚙️ Core Features
1. Volatility Oscillator (0–100)
• Filters trades by volatility intensity.
• Uses ATR, Range, or Bollinger Band Width normalization.
• Trades trigger only when market volatility is high — filtering out sideways or weak trends.
• Ensures trades occur during real momentum expansions.
2. Breakout + Order Block Engine
• Detects pivot highs/lows to confirm authentic breakout levels.
• Identifies “smart money” gaps — institutional imbalance zones often leading to strong reversals or continuations.
• Captures both breakout continuations and order-block reversals.
• Works as a hybrid structure detector combining price action and volatility alignment.
3. SuperTrend Directional Filter
• Optional filter that only allows trades in the direction of the SuperTrend.
• Can automatically close trades when a SuperTrend flip occurs.
• Provides strong trend-following bias and helps avoid countertrend traps.
4. ATR-Based Stop & Trailing System
• Adaptive stop-loss and trailing logic that expands or tightens based on volatility.
• Supports three modes: StopOnly, TrailOnly, and StopAndTrail.
• Works in both ATR-based distance or percentage-based configuration.
• Keeps losing trades small and lets winning trades extend dynamically.
5. Volume-Based Exit Logic
• Detects low-volume exhaustion to identify momentum loss.
• Detects opposite-volume spikes as early reversal signals.
• Optional hybrid “Both” mode combines both detection methods for stronger reliability.
• Ideal for markets where volume surges indicate smart money exits or trap formations.
6. Session Filter & Anti-Churn Control
• Restrict trading hours (optional; not required for crypto).
• Prevents repeated signals and noise-based entries through minimum bars between trades.
• Cooldown logic ensures disciplined trading and avoids strategy overlap.
• Prevents multiple entries in a single bar and filters unconfirmed breakouts.
7. SmartMoney Preset Mode
• Institutional-grade configuration automatically adjusting volatility, ATR, and structural logic.
• Mimics smart money behavior by prioritizing clean structure and high liquidity volatility zones.
• Great for traders who want simplified institutional logic without manual tuning.
Optimized for 4H BTC & ETH
TitanEdge performs best on BTCUSDT and ETHUSDT pairs in the 4-hour timeframe.
The 4H chart captures high-volatility institutional swings, eliminates intraday noise, and provides clear order-block setups.
This timeframe aligns with BTC/ETH volatility cycles, providing consistent signals and cleaner trend confirmation.
Recommended settings for 4H charts:
• Levels Period: 25
• Volatility Filter: 20
• volatility oscillator Auto: disable ( it depend upon your plan test with Disable/enable)
• Volatility Method: BBWidth
• ATR Multiplier: 1.8
• ATR Stop %: 5
• SuperTrend ATR Length: 10
• SuperTrend Factor: 3
• ATR Mode: StopAndTrail
• Hold Bars: 1
• Volume Exit: Disable (Both)
• Session Filter: Off (Crypto runs 24/7)
Entry Logic
• Long Entry: Price breaks above resistance (pivot high), volatility above threshold, and optional SuperTrend confirmation.
• Short Entry: Price breaks below support (pivot low), volatility above threshold, and optional bearish SuperTrend confirmation.
• Additional Entry: Triggered by order-block gaps (smart money imbalances) in volatility expansion phases.
• Trades only when both direction and volatility align to ensure precision entries.
Exit Logic
• ATR Stop and Trail dynamically manage open trades.
• SuperTrend Flip forces exit on trend reversal.
• Volume Exit triggers when volume momentum drops or opposite spike occurs.
• Optional session close exit to flatten trades outside hours.
• Logic prevents premature exits with “Hold Bars” delay after entry.
Why You Need TitanEdge Algo Suite
• Trades only during high-volatility, strong-momentum phases — no false breakouts or choppy trades.
• ATR risk control automatically adjusts to each market’s volatility conditions.
• Identifies institutional order-blocks and clean breakouts for precise entries.
• SuperTrend filter adds directional bias, boosting win-rate consistency.
• Volume exit logic ensures profits are protected when market momentum fades.
• Works 24/7 across all major crypto pairs — fully automated and customizable.
• Built for 4H swing trades — fewer but higher-quality setups.
• Fully compatible with TradingView alerts and bot integration for hands-free execution.
How TitanEdge Makes Profit
• TitanEdge only trades during volatility expansion, when breakout continuation probability is statistically high.
• ATR dynamic stops prevent large losses by scaling protection according to real volatility.
• Trend filtering keeps positions aligned with major market flows.
• Order-block detection ensures entries are based on price structure rather than random signals.
• Volume-based exits secure profits early when momentum weakens.
• SmartMoney Preset provides optimal balance between trade frequency, accuracy, and drawdown control.
• The system compounds edge by maintaining trade discipline — fewer but stronger trades over time.
Delta Exchange Integration (TradingView Bot Ready)
TitanEdge is fully compatible with TradingView alert webhooks and can connect to Delta Exchange or any bot-supported broker.
Alert JSON message format:
{"symbol":"{{ticker}}","side":"{{strategy.order.action}}","qty":1,"trigger_time":"{{timenow}}","strategy_id":"code"}
qty 1 represent 1 lot so if you want to take trade with 5 lots or 0.05eth and write
{"symbol":"{{ticker}}","side":"{{strategy.order.action}}","qty":5,"trigger_time":"{{timenow}}","strategy_id":"code"}
Steps to automate:
Create an alert on TradingView using “Once Per Bar Close”.
Paste your bot or automation webhook URL.
Paste the JSON above as the message.
Configure your bot or API bridge (like PineConnector, AutoView, or WunderTrading) to route signals to Delta Exchange.
On Delta, use BTCUSD or ETHUSD Perpetual pairs with moderate leverage (3x–5x).
Enable Cross Margin for smooth drawdown handling.
Test first on Delta Testnet for safety.
Why 4H BTC & ETH Works Best
• 4H candles capture true volatility swings and filter lower-timeframe noise.
• Aligns with institutional liquidity cycles in BTC and ETH.
• ATR and volume-based stops perform optimally on larger bars.
• Smoother equity curve and less drawdown compared to intraday trading.
• Ideal for traders seeking structured, medium-term trades with high reward-to-risk.
Unique Edge
• Combines breakout, order-block, and volatility principles into one adaptive model.
• Incorporates volatility normalization (ATR/BBWidth) for multi-market adaptability.
• Dynamic ATR stops and trailing protect capital during unstable phases.
• Volume and trend exits create layered protection systems.
• 4H optimization eliminates noise and provides clear institutional alignment.
• SmartMoney preset auto-configures settings to mimic large-player behavior.
• Fully automated via webhooks — no manual execution required.
• Modular design lets you customize each component for different trading styles.
TradingView Bot Integration
TitanEdge is fully plug-and-play with all TradingView-compatible bots.
Each alert sends structured JSON data containing direction, symbol, and quantity, ready for execution on your connected broker.
You can route the data to:
• PineConnector (MT4/MT5 bridge)
• WunderTrading
• AutoView
• Custom Node/REST API handler
This makes TitanEdge a professional-grade strategy suitable for semi-automatic or fully automated crypto trading setups.
Professional Recommendations
• Timeframe: 4H
• Instruments: BTCUSDT, ETHUSDT
• Exchange: Delta Exchange (Perpetual Futures)
• Leverage: 3x–5x
• Session Filter: Off (crypto 24/7)
• Risk per trade: 0.5%–1% of total equity
• Alert Type: Once Per Bar Close
• Volatility Filter: 25–35 depending on market activity
• Always use realistic slippage and fees for backtests.
Summary
TitanEdge Algo Suite is a complete trading framework built to deliver institutional-quality precision with full automation support.
It captures powerful volatility expansions on 4H BTC and ETH charts using clean structure, adaptive stops, and directional trend filters.
Every feature — from entry logic to exits — is designed to protect capital and amplify performance through disciplined, volatility-aware execution.
TitanEdge is not just another script — it’s a professional-grade algorithm that combines volatility intelligence, structural precision, and adaptive risk control.
TitanEdge Algo Suite = Smart Logic × Trend Discipline × Adaptive Risk Control
Optimized for BTC & ETH on 4H charts. Built for traders who demand precision, control, and consistency.

01 BB RSI MACD with built-in webhookThis strategy is intended for use as a way of backtesting various parameters available on 3commas.
Using MACD to sell order (original script take profit by scale)
Using RSI to analyze the market conditions.
.
.
// USER INPUTS
Short MA Window - The length of the Short moving average
Long MA Window - The length of the Long moving average
Upper Band Offset - The offset to use for the upper bollinger offset
Lower Band Offset - The offset to use for the lower bollinger offset
Long Stop Loss % - The stop loss percentage to test
Long Take Profit % - The Take profit percentage to test
Initial SO Deviation % - The price deviation percentage required to place to first safety order
Safety Order Vol Step % - The volume scale to test
Input to link with 3comma to automate your bot
3Commas Bot ID -
Bot Email Token - Found in the deal start message for your bot
3Commas Bot Trading Pair - The pair to include for composite bot start deals
when you create alert you need to write {{strategy.order.alert_message}} in the message box.
.
.
Original script:
1. 3Commas Bollinger Strategy by tedwardd
.
.
Suggestion use with trending pair, SAND, MANA and many altcoin in low tf
Fibonacci DCA TrendThis bot makes use of an algorithm which detects new heights and places limit orders according to the Fibonacci retracement theory. By placing limit orders under the current price, the bot allows itself to catch smaller and larger dips. This is also known as “Dollar-Cost-Averaging”, DCA in short. This bot is ideal for bull markets, both on crypto and stock indices.
The green lines are the limit orders. As soon as the price touches the limit order, a position is entered.
The settings of the back test as follows:
starting capital = 100k
leverage = 1
commission = 0.2%
Equity per trade = 5%, a realistic investment strategy when trading 2-3 assets with this bot.
It’s advised to trade this bot with futures for potential leverage. On time frames lower than H1 I’d use 2x-3x leverage for better results, especially in trending markets. On larger time frames I wouldn’t use any leverage.
This bot has very strong results on a multitude of assets. The best results are on the M15 time frame.
To give you a few ideas, this bot is tested on the assets below. All the results are very similar. You can contact me for a back-test on a specific asset. You can find the back-test results on my website.
BTC
ETH
SPX500
NAS100
The standard inputs are generally the best all-round inputs. Feel free to change the inputs to your liking.
I've also made a study-script for easy implementation on the exchange. You get that script once you get access to this bot.

RSI Trend CryptoDear community,
Today I want to present you one of my favorite and simple trading bots: The RSI Trend.
This bot is based on the RSI, which normally is used as a trend reversal indicator. However, here it’s used as a trend finding indicator, often with great success. This bot making long-only trades, which is quite successful in bull-markets like the one we’re currently in.
In case you want to use an emergency exit for your trade, toggle the Emergency Exit parameter. During bull-markets it’s better in the long term to keep this option off.
Currently the bot only makes one trade at a time (pyramiding = 1), for higher risk and higher rewards you can increase this parameter. More than 5 is not advised.
I’ve optimized this bot on 15min time frame. It has some decent results for most cryptos on this TF, feel free to test this out.
In case you want to hook this bot up to your exchange, feel free to edit the ALERT messages in the code.
Default Trading Rules:
Long: RSI crosses over 35
Close Long: RSI crosses under 75
Emergency Exit: RSI crosses under 10

Ruckard TradingLatinoThis strategy tries to mimic TradingLatino strategy.
The current implementation is beta.
Si hablas castellano o espanyol por favor consulta MENSAJE EN CASTELLANO más abajo.
It's aimed at BTCUSDT pair and 4h timeframe.
STRATEGY DEFAULT SETTINGS EXPLANATION
max_bars_back=5000 : This is a random number of bars so that the strategy test lasts for one or two years
calc_on_order_fills=false : To wait for the 4h closing is too much. Try to check if it's worth entering a position after closing one. I finally decided not to recheck if it's worth entering after an order is closed. So it is false.
calc_on_every_tick=false
pyramiding=0 : We only want one entry allowed in the same direction. And we don't want the order to scale by error.
initial_capital=1000 : These are 1000 USDT. By using 1% maximum loss per trade and 7% as a default stop loss by using 1000 USDT at 12000 USDT per BTC price you would entry with around 142 USDT which are converted into: 0.010 BTC . The maximum number of decimal for contracts on this BTCUSDT market is 3 decimals. E.g. the minimum might be: 0.001 BTC . So, this minimal 1000 amount ensures us not to entry with less than 0.001 entries which might have happened when using 100 USDT as an initial capital.
slippage=1 : Binance BTCUSDT mintick is: 0.01. Binance slippage: 0.1 % (Let's assume). TV has an integer slippage. It does not have a percentage based slippage. If we assume a 1000 initial capital, the recommended equity is 142 which at 11996 USDT per BTC price means: 0.011 BTC. The 0.1% slippage of: 0.011 BTC would be: 0.000011 . This is way smaller than the mintick. So our slippage is going to be 1. E.g. 1 (slippage) * 0.01 (mintick)
commission_type=strategy.commission.percent and commission_value=0.1 : According to: binance . com / en / fee / schedule in VIP 0 level both maker and taker fees are: 0.1 %.
BACKGROUND
Jaime Merino is a well known Youtuber focused on crypto trading
His channel TradingLatino
features monday to friday videos where he explains his strategy.
JAIME MERINO STANCE ON BOTS
Jaime Merino stance on bots (taken from memory out of a 2020 June video from him):
'~
You know. They can program you a bot and it might work.
But, there are some special situations that the bot would not be able to handle.
And, I, as a human, I would handle it. And the bot wouldn't do it.
~'
My long term target with this strategy script is add as many
special situations as I can to the script
so that it can match Jaime Merino behaviour even in non normal circumstances.
My alternate target is learn Pine script
and enjoy programming with it.
WARNING
This script might be bigger than other TradingView scripts.
However, please, do not be confused because the current status is beta.
This script has not been tested with real money.
This is NOT an official strategy from Jaime Merino.
This is NOT an official strategy from TradingLatino . net .
HOW IT WORKS
It basically uses ADX slope and LazyBear's Squeeze Momentum Indicator
to make its buy and sell decisions.
Fast paced EMA being bigger than slow paced EMA
(on higher timeframe) advices going long.
Fast paced EMA being smaller than slow paced EMA
(on higher timeframe) advices going short.
It finally add many substrats that TradingLatino uses.
SETTINGS
__ SETTINGS - Basics
____ SETTINGS - Basics - ADX
(ADX) Smoothing {14}
(ADX) DI Length {14}
(ADX) key level {23}
____ SETTINGS - Basics - LazyBear Squeeze Momentum
(SQZMOM) BB Length {20}
(SQZMOM) BB MultFactor {2.0}
(SQZMOM) KC Length {20}
(SQZMOM) KC MultFactor {1.5}
(SQZMOM) Use TrueRange (KC) {True}
____ SETTINGS - Basics - EMAs
(EMAS) EMA10 - Length {10}
(EMAS) EMA10 - Source {close}
(EMAS) EMA55 - Length {55}
(EMAS) EMA55 - Source {close}
____ SETTINGS - Volume Profile
Lowest and highest VPoC from last three days
is used to know if an entry has a support
VPVR of last 100 4h bars
is also taken into account
(VP) Use number of bars (not VP timeframe): Uses 'Number of bars {100}' setting instead of 'Volume Profile timeframe' setting for calculating session VPoC
(VP) Show tick difference from current price {False}: BETA . Might be useful for actions some day.
(VP) Number of bars {100}: If 'Use number of bars (not VP timeframe)' is turned on this setting is used to calculate session VPoC.
(VP) Volume Profile timeframe {1 day}: If 'Use number of bars (not VP timeframe)' is turned off this setting is used to calculate session VPoC.
(VP) Row width multiplier {0.6}: Adjust how the extra Volume Profile bars are shown in the chart.
(VP) Resistances prices number of decimal digits : Round Volume Profile bars label numbers so that they don't have so many decimals.
(VP) Number of bars for bottom VPOC {18}: 18 bars equals 3 days in suggested timeframe of 4 hours. It's used to calculate lowest session VPoC from previous three days. It's also used as a top VPOC for sells.
(VP) Ignore VPOC bottom advice on long {False}: If turned on it ignores bottom VPOC (or top VPOC on sells) when evaluating if a buy entry is worth it.
(VP) Number of bars for VPVR VPOC {100}: Number of bars to calculate the VPVR VPoC. We use 100 as Jaime once used. When the price bounces back to the EMA55 it might just bounce to this VPVR VPoC if its price it's lower than the EMA55 (Sells have inverse algorithm).
____ SETTINGS - ADX Slope
ADX Slope
help us to understand if ADX
has a positive slope, negative slope
or it is rather still.
(ADXSLOPE) ADX cut {23}: If ADX value is greater than this cut (23) then ADX has strength
(ADXSLOPE) ADX minimum steepness entry {45}: ADX slope needs to be 45 degrees to be considered as a positive one.
(ADXSLOPE) ADX minimum steepness exit {45}: ADX slope needs to be -45 degrees to be considered as a negative one.
(ADXSLOPE) ADX steepness periods {3}: In order to avoid false detection the slope is calculated along 3 periods.
____ SETTINGS - Next to EMA55
(NEXTEMA55) EMA10 to EMA55 bounce back percentage {80}: EMA10 might bounce back to EMA55 or maybe to 80% of its complete way to EMA55
(NEXTEMA55) Next to EMA55 percentage {15}: How much next to the EMA55 you need to be to consider it's going to bounce back upwards again.
____ SETTINGS - Stop Loss and Take Profit
You can set a default stop loss or a default take profit.
(STOPTAKE) Stop Loss % {7.0}
(STOPTAKE) Take Profit % {2.0}
____ SETTINGS - Trailing Take Profit
You can customize the default trailing take profit values
(TRAILING) Trailing Take Profit (%) {1.0}: Trailing take profit offset in percentage
(TRAILING) Trailing Take Profit Trigger (%) {2.0}: When 2.0% of benefit is reached then activate the trailing take profit.
____ SETTINGS - MAIN TURN ON/OFF OPTIONS
(EMAS) Ignore advice based on emas {false}.
(EMAS) Ignore advice based on emas (On closing long signal) {False}: Ignore advice based on emas but only when deciding to close a buy entry.
(SQZMOM) Ignore advice based on SQZMOM {false}: Ignores advice based on SQZMOM indicator.
(ADXSLOPE) Ignore advice based on ADX positive slope {false}
(ADXSLOPE) Ignore advice based on ADX cut (23) {true}
(STOPTAKE) Take Profit? {false}: Enables simple Take Profit.
(STOPTAKE) Stop Loss? {True}: Enables simple Stop Loss.
(TRAILING) Enable Trailing Take Profit (%) {True}: Enables Trailing Take Profit.
____ SETTINGS - Strategy mode
(STRAT) Type Strategy: 'Long and Short', 'Long Only' or 'Short Only'. Default: 'Long and Short'.
____ SETTINGS - Risk Management
(RISKM) Risk Management Type: 'Safe', 'Somewhat safe compound' or 'Unsafe compound'. ' Safe ': Calculations are always done with the initial capital (1000) in mind. The maximum losses per trade/day/week/month are taken into account. ' Somewhat safe compound ': Calculations are done with initial capital (1000) or a higher capital if it increases. The maximum losses per trade/day/week/month are taken into account. ' Unsafe compound ': In each order all the current capital is gambled and only the default stop loss per order is taken into account. That means that the maximum losses per trade/day/week/month are not taken into account. Default : 'Somewhat safe compound'.
(RISKM) Maximum loss per trade % {1.0}.
(RISKM) Maximum loss per day % {6.0}.
(RISKM) Maximum loss per week % {8.0}.
(RISKM) Maximum loss per month % {10.0}.
____ SETTINGS - Decimals
(DECIMAL) Maximum number of decimal for contracts {3}: How small (3 decimals means 0.001) an entry position might be in your exchange.
EXTRA 1 - PRICE IS IN RANGE indicator
(PRANGE) Print price is in range {False}: Enable a bottom label that indicates if the price is in range or not.
(PRANGE) Price range periods {5}: How many previous periods are used to calculate the medians
(PRANGE) Price range maximum desviation (%) {0.6} ( > 0 ): Maximum positive desviation for range detection
(PRANGE) Price range minimum desviation (%) {0.6} ( > 0 ): Mininum negative desviation for range detection
EXTRA 2 - SQUEEZE MOMENTUM Desviation indicator
(SQZDIVER) Show degrees {False}: Show degrees of each Squeeze Momentum Divergence lines to the x-axis.
(SQZDIVER) Show desviation labels {False}: Whether to show or not desviation labels for the Squeeze Momentum Divergences.
(SQZDIVER) Show desviation lines {False}: Whether to show or not desviation lines for the Squeeze Momentum Divergences.
EXTRA 3 - VOLUME PROFILE indicator
WARNING: This indicator works not on current bar but on previous bar. So in the worst case it might be VP from 4 hours ago. Don't worry, inside the strategy calculus the correct values are used. It's just that I cannot show the most recent one in the chart.
(VP) Print recent profile {False}: Show Volume Profile indicator
(VP) Avoid label price overlaps {False}: Avoid label prices to overlap on the chart.
EXTRA 4 - ZIGNALY SUPPORT
(ZIG) Zignaly Alert Type {Email}: 'Email', 'Webhook'. ' Email ': Prepare alert_message variable content to be compatible with zignaly expected email content format. ' Webhook ': Prepare alert_message variable content to be compatible with zignaly expected json content format.
EXTRA 5 - DEBUG
(DEBUG) Enable debug on order comments {False}: If set to true it prepares the order message to match the alert_message variable. It makes easier to debug what would have been sent by email or webhook on each of the times an order is triggered.
HOW TO USE THIS STRATEGY
BOT MODE: This is the default setting.
PROPER VOLUME PROFILE VIEWING: Click on this strategy settings. Properties tab. Make sure Recalculate 'each time the order was run' is turned off.
NEWBIE USER: (Check PROPER VOLUME PROFILE VIEWING above!) You might want to turn on the 'Print recent profile {False}' setting. Alternatively you can use my alternate realtime study: 'Resistances and supports based on simplified Volume Profile' but, be aware, it might consume one indicator.
ADVANCED USER 1: Turn on the 'Print price is in range {False}' setting and help us to debug this subindicator. Also help us to figure out how to include this value in the strategy.
ADVANCED USER 2: Turn on the all the (SQZDIVER) settings and help us to figure out how to include this value in the strategy.
ADVANCED USER 3: (Check PROPER VOLUME PROFILE VIEWING above!) Turn on the 'Print recent profile {False}' setting and report any problem with it.
JAIME MERINO: Just use the indicator as it comes by default. It should only show BUY signals, SELL signals and their associated closing signals. From time to time you might want to check 'ADVANCED USER 2' instructions to check that there's actually a divergence. Check also 'ADVANCED USER 1' instructions for your amusement.
EXTRA ADVICE
It's advised that you use this strategy in addition to these two other indicators:
* Squeeze Momentum Indicator
* ADX
so that your chart matches as close as possible to TradingLatino chart.
ZIGNALY INTEGRATION
This strategy supports Zignaly email integration by default. It also supports Zignaly Webhook integration.
ZIGNALY INTEGRATION - Email integration example
What you would write in your alert message:
||{{strategy.order.alert_message}}||key=MYSECRETKEY||
ZIGNALY INTEGRATION - Webhook integration example
What you would write in your alert message:
{ {{strategy.order.alert_message}} , "key" : "MYSECRETKEY" }
CREDITS
I have reused and adapted some code from
'Directional Movement Index + ADX & Keylevel Support' study
which it's from TradingView console user.
I have reused and adapted some code from
'3ema' study
which it's from TradingView hunganhnguyen1193 user.
I have reused and adapted some code from
'Squeeze Momentum Indicator ' study
which it's from TradingView LazyBear user.
I have reused and adapted some code from
'Strategy Tester EMA-SMA-RSI-MACD' study
which it's from TradingView fikira user.
I have reused and adapted some code from
'Support Resistance MTF' study
which it's from TradingView LonesomeTheBlue user.
I have reused and adapted some code from
'TF Segmented Linear Regression' study
which it's from TradingView alexgrover user.
I have reused and adapted some code from
"Poor man's volume profile" study
which it's from TradingView IldarAkhmetgaleev user.
FEEDBACK
Please check the strategy source code for more detailed information
where, among others, I explain all of the substrats
and if they are implemented or not.
Q1. Did I understand wrong any of the Jaime substrats (which I have implemented)?
Q2. The strategy yields quite profit when we should long (EMA10 from 1d timeframe is higher than EMA55 from 1d timeframe.
Why the strategy yields much less profit when we should short (EMA10 from 1d timeframe is lower than EMA55 from 1d timeframe)?
Any idea if you need to do something else rather than just reverse what Jaime does when longing?
FREQUENTLY ASKED QUESTIONS
FAQ1. Why are you giving this strategy for free?
TradingLatino and his fellow enthusiasts taught me this strategy. Now I'm giving back to them.
FAQ2. Seriously! Why are you giving this strategy for free?
I'm confident his strategy might be improved a lot. By keeping it to myself I would avoid other people contributions to improve it.
Now that everyone can contribute this is a win-win.
FAQ3. How can I connect this strategy to my Exchange account?
It seems that you can attach alerts to strategies.
You might want to combine it with a paying account which enable Webhook URLs to work.
I don't know how all of this works right now so I cannot give you advice on it.
You will have to do your own research on this subject. But, be careful. Automating trades, if not done properly,
might end on you automating losses.
FAQ4. I have just found that this strategy by default gives more than 3.97% of 'maximum series of losses'. That's unacceptable according to my risk management policy.
You might want to reduce default stop loss setting from 7% to something like 5% till you are ok with the 'maximum series of losses'.
FAQ5. Where can I learn more about your work on this strategy?
Check the source code. You might find unused strategies. Either because there's not a substantial increases on earnings. Or maybe because they have not been implemented yet.
FAQ6. How much leverage is applied in this strategy?
No leverage.
FAQ7. Any difference with original Jaime Merino strategy?
Most of the times Jaime defines an stop loss at the price entry. That's not the case here. The default stop loss is 7% (but, don't be confused it only means losing 1% of your investment thanks to risk management). There's also a trailing take profit that triggers at 2% profit with a 1% trailing.
FAQ8. Why this strategy return is so small?
The strategy should be improved a lot. And, well, backtesting in this platform is not guaranteed to return theoric results comparable to real-life returns. That's why I'm personally forward testing this strategy to verify it.
MENSAJE EN CASTELLANO
En primer lugar se agradece feedback para mejorar la estrategia.
Si eres un usuario avanzado y quieres colaborar en mejorar el script no dudes en comentar abajo.
Ten en cuenta que aunque toda esta descripción tenga que estar en inglés no es obligatorio que el comentario esté en inglés.
CHISTE - CASTELLANO
¡Pero Jaime!
¡400.000!
¡Tu da mun!

ALT Risk Metric StrategyHere's a professional write-up for your ALT Risk Strategy script:
ALT/BTC Risk Strategy - Multi-Crypto DCA with Bitcoin Correlation Analysis
Overview
This strategy uses Bitcoin correlation as a risk indicator to time entries and exits for altcoins. By analyzing how your chosen altcoin performs relative to Bitcoin, the strategy identifies optimal accumulation periods (when alt/BTC is oversold) and profit-taking opportunities (when alt/BTC is overbought). Perfect for traders who want to outperform Bitcoin by strategically timing altcoin positions.
Key Innovation: Why Alt/BTC Matters
Most traders focus solely on USD price, but Alt/BTC ratios reveal true altcoin strength:
When Alt/BTC is low → Altcoin is undervalued relative to Bitcoin (buy opportunity)
When Alt/BTC is high → Altcoin has outperformed Bitcoin (take profits)
This approach captures the rotation between BTC and alts that drives crypto cycles
Key Features
📊 Advanced Technical Analysis
RSI (60% weight): Primary momentum indicator on weekly timeframe
Long-term MA Deviation (35% weight): Measures distance from 150-period baseline
MACD (5% weight): Minor confirmation signal
EMA Smoothing: Filters noise while maintaining responsiveness
All calculations performed on Alt/BTC pairs for superior market timing
💰 3-Tier DCA System
Level 1 (Risk ≤ 70): Conservative entry, base allocation
Level 2 (Risk ≤ 50): Increased allocation, strong opportunity
Level 3 (Risk ≤ 30): Maximum allocation, extreme undervaluation
Continuous buying: Executes every bar while below threshold for true DCA behavior
Cumulative sizing: L3 triggers = L1 + L2 + L3 amounts combined
📈 Smart Profit Management
Sequential selling: Must complete L1 before L2, L2 before L3
Percentage-based exits: Sell portions of position, not fixed amounts
Auto-reset on re-entry: New buy signals reset sell progression
Prevents premature full exits during volatile conditions
🤖 3Commas Automation
Pre-configured JSON webhooks for Custom Signal Bots
Multi-exchange support: Binance, Coinbase, Kraken, Bitfinex, Bybit
Flexible quote currency: USD, USDT, or BUSD
Dynamic order sizing: Automatically adjusts to your tier thresholds
Full webhook documentation compliance
🎨 Multi-Asset Support
Pre-configured for popular altcoins:
ETH (Ethereum)
SOL (Solana)
ADA (Cardano)
LINK (Chainlink)
UNI (Uniswap)
XRP (Ripple)
DOGE
RENDER
Custom option for any other crypto
How It Works
Risk Metric Calculation (0-100 scale):
Fetches weekly Alt/BTC price data for stability
Calculates RSI, MACD, and deviation from 150-period MA
Normalizes MACD to 0-100 range using 500-bar lookback
Combines weighted components: (MACD × 0.05) + (RSI × 0.60) + (Deviation × 0.35)
Applies 5-period EMA smoothing for cleaner signals
Color-Coded Risk Zones:
Green (0-30): Extreme buying opportunity - Alt heavily oversold vs BTC
Lime/Yellow (30-70): Accumulation range - favorable risk/reward
Orange (70-85): Caution zone - consider taking initial profits
Red/Maroon (85-100+): Euphoria zone - aggressive profit-taking
Entry Logic:
Buys execute every candle when risk is below threshold
As risk decreases, position sizing automatically scales up
Example: If risk drops from 60→25, you'll be buying at L1 rate until it hits 50, then L2 rate, then L3 rate
Exit Logic:
Sells only trigger when in profit AND risk exceeds thresholds
Sequential execution ensures partial profit-taking
If new buy signal occurs before all sells complete, sell levels reset to L1
Configuration Guide
Choosing Your Altcoin:
Select crypto from dropdown (or use CUSTOM for unlisted coins)
Pick your exchange
Choose quote currency (USD, USDT, BUSD)
Risk Metric Tuning:
Long Term MA (default 150): Higher = more extreme signals, Lower = more frequent
RSI Length (default 10): Lower = more volatile, Higher = smoother
Smoothing (default 5): Increase for less noise, decrease for faster reaction
Buy Settings (Aggressive DCA Example):
L1 Threshold: 70 | Amount: $5
L2 Threshold: 50 | Amount: $6
L3 Threshold: 30 | Amount: $7
Total L3 buy = $18 per candle when deeply oversold
Sell Settings (Balanced Exit Example):
L1: 70 threshold, 25% position
L2: 85 threshold, 35% position
L3: 100 threshold, 40% position (final exit)
3Commas Setup
Bot Configuration:
Create Custom Signal Bot in 3Commas
Set trading pair to your altcoin/USD (e.g., ETH/USD, SOL/USDT)
Order size: Select "Send in webhook, quote" to use strategy's dollar amounts
Copy Bot UUID and Secret Token
Script Configuration:
Paste credentials into 3Commas section inputs
Check "Enable 3Commas Alerts"
Save and apply to chart
TradingView Alert:
Create Alert → Condition: "alert() function calls only"
Webhook URL: api.3commas.io
Enable "Webhook URL" checkbox
Expiration: Open-ended
Strategy Advantages
✅ Outperform Bitcoin: Designed specifically to beat BTC by timing alt rotations
✅ Capture Alt Seasons: Automatically accumulates when alts lag, sells when they pump
✅ Risk-Adjusted Sizing: Buys more when cheaper (better risk/reward)
✅ Emotional Discipline: Systematic approach removes fear and FOMO
✅ Multi-Asset: Run same strategy across multiple altcoins simultaneously
✅ Proven Indicators: Combines RSI, MACD, and MA deviation - battle-tested tools
Backtesting Insights
Optimal Timeframes:
Daily chart: Best for backtesting and signal generation
Weekly data is fetched internally regardless of display timeframe
Historical Performance Characteristics:
Accumulates heavily during bear markets and BTC dominance periods
Captures explosive altcoin rallies when BTC stagnates
Sequential selling preserves capital during extended downtrends
Works best on established altcoins with multi-year history
Risk Considerations:
Requires capital reserves for extended accumulation periods
Some altcoins may never recover if fundamentals deteriorate
Past correlation patterns may not predict future performance
Always size positions according to personal risk tolerance
Visual Interface
Indicator Panel Displays:
Dynamic color line: Green→Lime→Yellow→Orange→Red as risk increases
Horizontal threshold lines: Dashed lines mark your buy/sell levels
Entry/Exit labels: Green labels for buys, Orange/Red/Maroon for sells
Real-time risk value: Numerical display on price scale
Customization:
All threshold lines are adjustable via inputs
Color scheme clearly differentiates buy zones (green spectrum) from sell zones (red spectrum)
Line weights emphasize most extreme thresholds (L3 buy and L3 sell)
Strategy Philosophy
This strategy is built on the principle that altcoins move in cycles relative to Bitcoin. During Bitcoin rallies, alts often bleed against BTC (high sell, accumulate). When Bitcoin consolidates, alts pump (take profits). By measuring risk on the Alt/BTC chart instead of USD price, we time these rotations with precision.
The 3-tier system ensures you're always averaging in at better prices and scaling out at better prices, maximizing your Bitcoin-denominated returns.
Advanced Tips
Multi-Bot Strategy:
Run this on 5-10 different altcoins simultaneously to:
Diversify correlation risk
Capture whichever alt is pumping
Smooth equity curve through rotation
Pairing with BTC Strategy:
Use alongside the BTC DCA Risk Strategy for complete portfolio coverage:
BTC strategy for core holdings
ALT strategies for alpha generation
Rebalance between them based on BTC dominance
Threshold Calibration:
Check 2-3 years of historical data for your chosen alt
Note where risk metric sat during major bottoms (set buy thresholds)
Note where it peaked during euphoria (set sell thresholds)
Adjust for your risk tolerance and holding period
Credits
Strategy Development & 3Commas Integration: Claude AI (Anthropic)
Technical Analysis Framework: RSI, MACD, Moving Average theory
Implementation: pommesUNDwurst
Disclaimer
This strategy is for educational purposes only. Cryptocurrency trading involves substantial risk of loss. Altcoins are especially volatile and many fail completely. The strategy assumes liquid markets and reliable Alt/BTC price data. Always do your own research, understand the fundamentals of any asset you trade, and never risk more than you can afford to lose. Past performance does not guarantee future results. The authors are not financial advisors and assume no liability for trading decisions.
Additional Warning: Using leverage or trading illiquid altcoins amplifies risk significantly. This strategy is designed for spot trading of established cryptocurrencies with deep liquidity.
Tags: Altcoin, Alt/BTC, DCA, Risk Metric, Dollar Cost Averaging, 3Commas, ETH, SOL, Crypto Rotation, Bitcoin Correlation, Automated Trading, Alt Season
Feel free to modify any sections to better match your style or add specific backtesting results you've observed! 🚀Claude is AI and can make mistakes. Please double-check responses. Sonnet 4.5

Golden Btc Formula🏆 Golden BTC Formula Bot
Introducing the Golden BTC Formula Bot — a smart trading strategy built specifically for Bitcoin on TradingView, designed to combine algorithmic precision with solid risk management.
📊 Backtest Overview:
The backtest shows that starting with a $10,000 balance and using a position size of 50% of equity per trade, the bot has delivered impressive, consistent returns over the tested period. The equity curve illustrates steady growth, minimal drawdowns, and controlled risk exposure — proving its robustness even in volatile market conditions.
⚙️ How It Works:
The bot automatically detects high-probability entries based on carefully tuned indicators and price action logic.
Targets and stop-loss levels are dynamically calculated to adapt to market volatility.
Built entirely in Pine Script for TradingView, so you can watch trades live or backtest historically.
🛡️ Risk Management Tips:
Even with a strong backtest, real trading always involves risk. Here’s how to use the Golden BTC Formula Bot responsibly:
✅ Use only part of your capital (e.g., 30–50%) for the bot.
✅ Set reasonable leverage (or stick to spot trading).
✅ Withdraw profits periodically instead of letting them fully compound forever.
✅ Always backtest and forward-test before going live, and consider running it in paper trading mode at first.
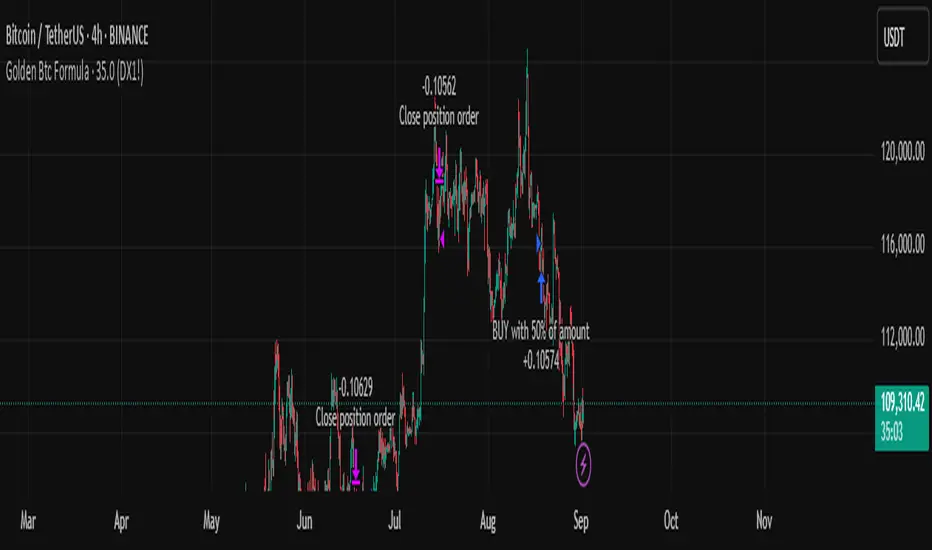
Price Action Pattern Breakout Strategy: Wedge,Triangle,ChannelIntroducing the Price Action Pattern Breakout Strategy: Wedge,Triangle,Channel 💹🚀
The "Price Action Pattern Breakout Strategy: Wedge, Triangle, Channel" is a dynamic and automated trading strategy that excels in recognizing and capitalizing on breakout opportunities within the realm of powerful price action patterns. It is finely tuned to achieve exceptional precision in detecting three distinct pattern types: Wedge, Triangle, and Channel. This diversity equips you to confidently navigate a wide range of market scenarios and opportunities.
This strategy automates trade entries and exits upon confirmed pattern breakouts, this eliminates human errors in correctly recognizing patterns and prevents emotional decisions. This strategy is designed to work across different time frames, making it suitable for both short-term and long-term traders. Whether you're a day trader, swing trader, or investor, this strategy provides the flexibility you need to thrive in diverse market conditions.
💎 How it Works:
▶️ In this strategy, three price action patterns have been utilized, one of which is the "Wedge" pattern. The Wedge pattern has consistently demonstrated a high level of credibility, typically resulting in sharp and rapid price movements following a confirmed breakout from this pattern. This characteristic makes the Wedge pattern highly noteworthy in our strategy. The second pattern is the "Triangle" pattern, which, depending on its formation, whether ascending or descending, can indicate a strong continuation or reversal of the trend. The last pattern is the "Channel" pattern. The reason for using the Channel pattern is its versatility in various market conditions and its tendency to produce reliable results.
In the snapshot below, you can observe the types of patterns that this strategy is capable of identifying at a glance:
▶️ This strategy employs two types of targeting systems: Fixed Targets and Trailing Targets.
Fixed Targets is the default targeting system of the strategy, incorporating two primary targets: TP1 (Target Point 1) and TP2 (Target Point 2). These targets are thoughtfully adjusted in alignment with specific rules for each pattern. With Fixed Targets, you have the flexibility to designate the position size percentage for your exits at TP1 and TP2. For instance, should you opt to allocate 60% of your position size to TP1, as soon as the price triggers the first take profit level, 60% of your initial position is gracefully closed, leaving the remaining 40% to exit the trade upon reaching TP2.
Trailing Targets represent the strategy's alternative targeting system. With this system, the trailing stop becomes active once the price reaches the specified trigger point. The strategy then exits the trade based on the defined offset percentage and price retracement from the trailing limit.
▶️ This strategy relies on a single type of stop loss, determined by previous pivot points and adjusted based on the trade's direction, whether long or short, placing the stop loss above or below the prior pivot. This stop loss approach has demonstrated reliability when used alongside price action patterns.
In addition to this fixed stop loss, you can specify a percentage buffer, offering protection against potential stop hunting due to market fluctuations. This buffer helps protect your positions from sudden price swings. For example, selecting a 1% buffer means your stop loss will be positioned 1% higher or lower concerning the last pivot, depending on your trade's direction. This added layer of security ensures your trades remain resilient and less vulnerable to market volatility.
▶️ A practical feature of this strategy is the "Risk-Free" option. Once activated, it continuously monitors price movements, and as soon as the price progresses in the trade's direction and surpasses the designated Risk-Free Trigger Point in percentage, the stop loss is dynamically shifted from its initial position to the entry price, effectively making the trade "risk-free." This means that if the trade doesn't go as expected, we exit at the entry point, incurring neither profit nor loss from the trade.
Additionally, you have the flexibility to fine-tune the modified stop loss, positioning it slightly above or below the entry price through the configuration of a specified percentage. This allows for effective consideration of commission fees in your trading strategy.
▶️ Risk management is a crucial concept in trading, playing a significant role in a trader's long-term success. This strategy introduces a unique feature called "Fixed Loss Position Sizing", where upon activation, you can limit the risk exposure to a specified percentage of your capital per trade. Set your preferred risk percentage along with the intended leverage. The strategy independently considers your available capital and designated leverage, determining the position size before executing any trade.
In the case of a stop loss, your loss is limited to the specified risk percentage. For instance, with a $1000 account and a 1% risk set, the strategy adjusts each trade's size to ensure a maximum loss of $10 if the stop loss is triggered. Enabling this feature will ensure disciplined risk management, aligning potential losses precisely with your predetermined risk percentage, contingent upon your total available capital.
▶️ Another feature of this strategy is a sophisticated mechanism called "Loss Compensation". When enabled, Loss Compensation dynamically adjusts the position size after a loss, aiming to recover from previous losses in subsequent trades. This adaptive mechanism continually modifies the position size to mitigate the impact of consecutive losses until reaching a user-defined limit for consecutive loss compensations.
The feature's configurability allows users to set the maximum number of consecutive losses to compensate for and also includes an option to factor in trading fees from prior trades into the compensation calculation. Loss Compensation operates in conjunction with the 'Fixed Loss Position Sizing' setting, ensuring that once losses are sufficiently compensated, subsequent entries revert to the predefined configurations within the 'Fixed Loss Position Sizing' settings.
This advanced tool ensures a stable risk management approach by changing trade sizes dynamically according to past results during consecutive loss periods.
▶️ This strategy incorporates a feature known as the "Counter-Pattern Breakout", altering its approach to wedge, triangle, and channel pattern breakouts. Normally, the strategy relies on standard pattern signals to determine whether to enter long or short positions based on breakout directions.
For example, in an ascending channel or a rising wedge pattern, the strategy typically seeks a short position opportunity upon a confirmed breakout in the lower line, and breakouts from the upper line are disregarded by the strategy. But with this feature enabled, strategy disregards the conventional pattern signals, seizing breakouts from upper or lower lines to open corresponding positions. For instance, in the ascending channel or the rising wedge pattern example, the strategy might enter a long position if the upper line breaks or a short position if the lower line breaks.
This introduces a more adaptive and opportunistic trading style, allowing you to capitalize on price movements, irrespective of the typical signal direction indicated by the pattern.
▶️ This strategy is fully compatible with third-party trading bots, allowing for easy connectivity to popular trading platforms. By leveraging the TradingView webhook functionality, you can effortlessly link the strategy to your preferred bot and receive accurate signals for position entry and exit. The strategy provides all the necessary alert message fields, ensuring a smooth and user-friendly trading experience. With this integration, you can automate the execution of trades, saving time and effort while enjoying the benefits of this powerful strategy.
⚙️ How to Use & Configure User Settings:
To fully utilize the "Price Action Pattern Breakout Strategy: Wedge, Triangle, Channel," it's essential to consider and comprehend the following steps. They play a crucial role in enhancing its functionality and achieving its utmost potential outcomes:
1. General Strategy Settings:
Enable Dark Mode if using a dark TradingView theme for improved chart visibility.
Select the Strategy's Trade Direction: Long, Short, or Both.
Choose Pattern Recognition Accuracy: High for precise recognition but fewer positions, Low for more positions with slightly less accuracy.
Enable 'Prevent New Entry on Opposite Signal While In Position' to avoid new trades if the opposite signal occurs.
Switch to Indicator Mode if solely using the strategy as an indicator or in combination with other strategies.
2. Pattern and Pivot Configuration:
Consider configuring the Number of Patterns and Pivot Lookback Lengths. Here, you can personalize the pivot lookback lengths for wedge, triangle, and channel patterns across eight different settings on your chart. For lower time frames, consider larger lengths to reduce chart noise. Alternatively, to maintain clarity on your chart, you can disable multiple patterns with different lengths while ensuring at least one pattern remains enabled.
Note that enabling more patterns doesn't always equate to increased potential profit. Sometimes, fewer patterns result in greater profit potential, and vice versa. Experiment with lengths and the number of patterns to determine the most profitable and optimal outcome for your trading symbol and timeframe.
3. Targeting System Selection:
Choose between 'Fixed Targets' or 'Trailing Targets' for your targeting system.
'Fixed Targets' is the default setting, operational when 'Trailing Targets' are turned off.
Set the TP1 Position Size as a percentage, defining the size for TP1, and the rest exits at TP2.
Optionally activate 'Skip Entry if TP1 is Passed' to bypass entering positions if the price has exceeded TP1.
Alternatively, opt for the 'Trailing Target' for dynamic exits based on trigger points and offsets. Note that this option disables fixed targets.
4. Stop Loss Configuration:
Determine the number of candles to consider for stop loss placement based on the last pivot.
Optionally add a percentage to the stop loss to create a buffer against market fluctuations, guarding your positions from sudden price swings.
5. Risk Management Configuration:
You can activate the 'Risk-Free' feature, making your trades risk-free by moving the stop loss to the entry price upon reaching a specified trigger point.
You have the possibility to enable 'Fixed Loss Position Sizing' to limit risk to a percentage of total capital per trade, ensuring prudent risk management.
You can employ 'Use Real-Time Balance for Each Entry' to precisely calculate fixed loss position sizing according to the real-time balance for every entry.
The 'Loss Compensation' feature can be activated to automatically adjust trade sizes during consecutive losses and compensate for prior incurred losses.
Loss compensation continues adjusting trade sizes until it reaches the defined limit of consecutive losses specified in the 'Maximum Consecutive Losses To Compensate' field.
You can factor in commission fees by specifying a percentage in the 'Include Trading Fees in Compensation (%)' field, providing an option for more accurate loss compensation calculations.
You have the option to enable 'Limit Compensation to Real-Time Balance' to prevent consecutive loss compensation from exceeding your current real-time account balance.
It's important to note that for the 'Loss Compensation' feature to operate, the 'Fixed Loss Position Sizing' must be enabled.
6. Counter-Pattern Breakout Configuration:
In this section you have the option to enable the "Counter-Pattern Breakout" feature to adjust the strategy's approach to wedge, triangle, and channel pattern breakouts. Once enabled, the strategy disregards traditional pattern signals and capitalizes on breakouts from either the upper or lower lines, initiating corresponding positions accordingly.
Choose between 'Fixed Target' or 'Trailing Target' for your targeting system. If you opt for the 'Fixed Target', set a specific target point as a percentage, serving as the default target for counter-pattern breakouts. Alternatively, choose the 'Trailing Target' for dynamic exits based on trigger points and offsets. Do keep in mind that selecting the 'Trailing Target' option disables the fixed target setting.
Keep in mind that for standard, non-counter-pattern breakouts, the target point settings in their respective sections remain applicable, distinct from the settings configured for targeting within this section.
Note that the stop loss configurations are shared across standard pattern and counter-pattern breakouts and can be adjusted within the stop loss section.
7. Info Tables:
In the info tables section, you can show or hide different tables on the charts. This includes the backtest table, the current balance table displaying available funds, and a table showcasing Maximum Consecutive Wins or Losses. Choose which to display according to your preferences and specific needs.
8.Date & Time Range Filter:
Utilize the Date & Time Range filter feature to precisely select a start and end date, including time, to filter data within the chosen range.
When connecting this strategy to a trading bot for automated trades, ensure to set the start date and time to the intended initiation moment to avoid undesired outcomes as this directly affects the real-time balance calculations of the strategy.
8. Integration with Third-Party Bots:
To automate trading, leverage the strategy's compatibility with third-party trading bots. Seamlessly integrate the strategy into well-known trading platforms by using alert message fields to input commands from third-party trading bots, enabling automated trade execution for both long and short positions.
By furnishing these adjustable settings, the strategy empowers you to personalize it according to your unique requirements, thereby bolstering the adaptability and efficacy of your trading approach.
🔐 Source Code Protection:
The 'Price Action Pattern Breakout Strategy: Wedge, Triangle, Channel' source code is engineered for precision, reliability, and effectiveness. Its original and innovative design warrants protection and restricted access, preserving the strategy's exclusivity. Safeguarding the code maintains the strategy's integrity and distinctiveness, providing users with a competitive advantage in their trading endeavors.

USD Liquidity Conditions Index Swing Stock Strategy Original credits goes to @ElDoggo22 www.tradingview.com
I looked in the post created by him, of USD liquidity and I have noticed that if you are going to apply a percentile top and bottom to it, can become an interesting swing strategy for US Stocks.
So in this case I decided to create a 99th percentile for top and 4th percentile for bot with a big length, preferably 100+ candles, for this example i took 150.
Rules for entry :
Long : either bot or top lines are ascending
We exit long either the top line is descending, or we have sudden cross of the moving average with both top and bot within the same candle
Short: we enter short when we have a sudden cross down of the moving average with both top and bot within the same candle
We exit short when we have a cross over of the moving average with both top and bot within the same candle ( or we have a long entry condition)
If there are qny questions, please let me know !

X48 - Strategy | MA Type Cross + TPSL | Future&Spot | V.2Thank You For Open Source Code, This Strategy Ref. By 1.Simple Strategy Like MA Crossover For Long/Short or Spot Trade, 2. CDC Action Zone V.2 for BarPaint
This Strategy Mixing With MA Crossover Strategy and BarPaint By CDC Action Zone and TP/SL by Varbara
### How To Use Strategy : Setting EMA/SMA Crossover EMA/SMA, Any Value If You Want
For Long Position : Cross Up
For Short Position : Cross Down
Can Use With Spot Trade : Cross Up = Buy, Cross Down = Sell
TP/SL When Your OrderSize Change From any % Of Your TP/SL Value
### In Strategy Setting
Intitial Capital = Ex. 200
Order Size = Should Be Money Management Not Use 100% of Capital Ex. 10% of Capital (200$) = Order Size 20$
StopLoss and Take Profit = If You Run Trend TF 4H+ or 1D+ You Can Change TP% = 1,000% for nonlimit and Stop Loss 5 - 20% from your order size
Ex. Stoploss 15% = OrderSize / 100 x %SL = 20$/100 x 15% = 3$ Loss from order size 20$ (if you not set stop loss.)
Base Currency = (Your Currency) # Ex. USD
Commission = (Your Trading Fee) # Ex. Future Fee Can Check At Binance Fee Rate > www.binance.com > Choose Your Fee Type, Ex. USD M Future (Regular User) = 0.02 (Maker), 0.04 (Taker)
Commission Symbol Type = % # (Ref. By Binance Fee Rate)
### Notice ####
Default Setting It's Realistic From Normal Life Ex. Capital 200$ / Ordersize 20$ (10%)/ Commission 0.1% (Buy+Sell) / Slippage = 2 / TP = 1000% (nonlimit) / SL = 15%/OrderSize
Low Risk But High Return, Good Luck
### Bot Auto Trade by X4815162342 ###
if you wanna try my bot auto trade X48-3in1-bot : Contact My Line ID : x4815x
Full Command Alert For This Strategy If You Wanna See It's
'{"ex":"'+markettype+'","side": "'+longcommand+'", "amount": "@{{strategy.order.contracts}}", "symbol": "{{ticker}}", "passphrase": "'+passphrase+'","leverage":"'+str.tostring(leveragex)+'"}'
'{"ex":"'+markettype+'","side": "'+shortcommand+'", "amount": "@{{strategy.order.contracts}}", "symbol": "{{ticker}}", "passphrase": "'+passphrase+'","leverage":"'+str.tostring(leveragex)+'"}'
But Easy Than Full Command Just Use Thisssssss !! Strategy Be Manage Auto Long and Short or TPSL Position
You Don't Do Anything Just Use This Message to Alerts Message
{{strategy.order.alert_message}}
### If you don't use bot but just looking for strategy test ####
Just Pass Bot Setting Function It's Nothing Effect For Strategy !!!!!!
Let's Enjoy With Your Strategy BackTest 😁
Remember Beware Max drawdown%. I'm Recommend Lower Than 10% It's Very Good.

3C Crossover with TTP & TSLThis is not a set and forget strategy. It needs constant tweaking to maintain a high winrate. Also what works on one pair can be horrible on another.
This strategy works best on the 1 min or 5 min TF but also works well on the 15 min. Haven't done any testing in higher TF's as im only interested in scalping.
If enabled you can retrive data for the filters on any TF.
The strategy do not repaint.
You do not need a 3c subscription to run this strategy as the bot turns on and off the bot itself.
Instructions for the 3commas connector:
1. First, you need to prepare 3commas Long/Short bots that will only listen to custom TV signals.
2. Inputs for the 3commas bot can be found at the end of the user inputs.
3. Once you have entered the required details into the inputs, turn on 3commas comments. They should appear on the chart (looks messy).
4. Now you can add the alert where you should paste the 3commas Webhook URL: 3commas.io
5. For the alert message text insert the placeholder {{strategy.order.comment}} and delete the rest. 6. Once the alert is saved, you can turn off those 3commas comments to have a clearer chart.
7. With a new alert, the bot and trade should launch.
Long or Short trades are determined with a crossing of the fast MA over the slow MA for Long and the opposite for Short. By checking Close position on MA cross the deal will close on a crossover/under of the 2 MA's
You can select from various different MA's and of course lenghts. You can add both EMA filter on any lenght aswell as ATR to determine to go long or short.
Using the MA gap can help you to not enter trades in a low volatile ranging market.
The RSI filter, sets the maximum RSI threshold for a long position and the minimum for a short. By default and what i recomend is that you enter Longs when RSI is above 50 and shorts when RSI are below 50.
-You can set confirmation of the trade direction with RSI , i.e. for Long the RSI must rise a specified number of bars back, vice versa for Short.
Enabling the pullback filter is great to avoid Longing tops and Shorting bottoms.
Stop loss can be set be either a fixed percentage or by using ATR
Take profit can be set by using percentage, ATR or RiskReward ratio(RR). if you use ATR as a stoploss i recomend using RR as the TP.
Yu can choose to trail the TP with either Percentage or ATR
Whats ahead. I really want to incorporate RSI divergencies, but haven't figured out how yet. Any other ideas would be greatly appreciated.
Have a look at my other strategies. They are similar to this but works abit differently.

5min Williams Fractals scalping (3commas)Another strategy I'm learning Pine Script on. It is inspired by a MoneyZG youtube strategy called "Easy 5 Minute Scalping Strategy (Simple to Follow Scalping Trading Strategy)".
Again this is a one order per trade strategy compatible with the 3commas bot (works also with the free 3commas subscription). This strategy is based on the signals from Williams Fractals, taking the signals in reverse - red triangle indicates a bottom and hence we go long. The green triangle indicates a top so we go short. By default these signals are only accepted if they occur between the two Emas. However, you can also turn this off and when a WF signal comes in, only the current price has to be between the Emas. Stop loss is set to the current Ema slow and the take profit is a multiple of the distance to the slow ema.
Like previously I have added different filters as well as the ability to view essential things like the WF signal and Emas. I hope the script will help you to be more successful and if so it would be great if you could share here your setups, or tips on what would be good to refine to make it an even a more profitable strategy. Kind of a community approach so that we help each other out :).
Instructions for the 3commas connector:
1. First, you need to prepare 3commas Long/Short bots that will only listen to custom TV signals.
2. Inputs for the 3commas bot can be found at the end of the user inputs.
3. Once you have entered the required details into the inputs, turn on 3commas comments. They should appear on the chart (looks messy).
4. Now you can add the alert where you should paste the 3commas Webhook URL: 3commas.io
5. For the alert message text insert the placeholder {{strategy.order.comment}} and delete the rest.
6. Once the alert is saved, you can turn off those 3commas comments to have a clearer chart.
7. With a new alert, the bot and trade should launch.
In the near future I would like to publish more scripts that will carry similar elements as the first two, incl. compatibility with 3commas (I don't have access to another bot system). I will choose some strategies myself, but I will also be glad for some tips on what strategy would be good to do and is still missing here on Tradingview (short youtube videos or brief strategy manuals would be great).
Thanks and keep it up
PS: My screen values starting at Long Target Profit and ending at Pullback NOT greater than: 1.5; 1.5; 0; ON; 1; 2; OFF; 17; 36; ON; 0.05; ON; Chart; 14; 46; 50; 48.5; 51; OFF; 1; ON; 4; 2.

Strategy - Bobo PAPATRHi I've revamped this bot mentioned in the linked idea to make it work with v4 of pine. In doing so there are some very significant changes to how it works. The main one is that it no longer uses traditional daily pivot calculations to calculate the bands. It creates a more dynamic intraday set of pivot points based on recent price action rather than yesterday's ohlc. As published, the bot is tuned for a 15 min time frame. But it actually works well on lower time frames you just need to adjust the lookback periods in settings a bit to re tune it. It's also tuned to ES really but will need tweaking for a different instrument at the very least.
The basic concept is recent price action is used to calculate a 'middle' around which red and green bands are located. Their position or width is largely determined by recent volatility. The middle line is again calculated from recent price action. The three lines from that form a tradeable range with green at the top and red at the bottom. The strategy is simple enough, it shorts as it sinks from outside red, and longs when rising above green. The basic principle being that once you enter that range you have a high probability of hitting the middle before you hit your stop loss. So the basic principle is you are trying to capture the inherent ranginess of liquid indices like S&P 500. That back and forth movement that happens. The bot is capturing this by fading extremes of a recent range but the problem with that is you'dd get murdered in a strong trend. To mitigate that there is a trend calculation running in the background the will prevent trading against firm trends mostly. So the bot should trade mostly in rangy conditions because that is what it is trying to do.
Bot will close issue close signals automatically upon crossing the middle, it also will close automatically at predefined stops or limits. These values are denominated in market mintick values. For example the CFD SPX500 has a mintick of 0.1. Therefore a stop value of 100 will equate to 10 points on the index. If trading the same market via ES1! the mintick value is different - 0.25. So in this case a value of 40 is required to set the stop at 10 points.
Anyway shout if you have questions. Hope it's useful.
TVC:SPX OANDA:SPX500USD

Kairos [Backtester]Kairos bot looks for the opportune time to buy low and sell high at targets
It provides signals to open and close trades, and indicates favorable positions for a stop loss and profit taking
The Kairos bot can be used on any chart and on any time frame
---BACKTESTER---
Using the backtester script the user can look at a chart's history between selected dates to find optimal bot settings and optimal time frames
The backtester is based on general percentages for profit taking as indicated below:
-------------T1 T2 T3 T4 T5 T6 CLOSE
1 Target: 50% 50%
2 Targets: 50% 25% 25%
3 Targets: 40% 30% 20% 10%
4 Targets: 40% 25% 20% 10% 5%
5 Targets: 35% 25% 20% 10% 5% 5%
6 Targets: 30% 25% 20% 10% 5% 5% 5%
ie: If 2 targets are selected:
- 50% of investment will be taken at target 1
- 25% of investment will be taken at target 2
- and the remainder 25% will be taken when the trade is closed on a close signal
However, it is up to the user's own risk appetite to determine where and how much profit to take
Note that the backtester does not have any on screen indicators other than OPEN and CLOSE, however profit taking can be indicated by ticking the Style -> Trades on Chart tick box on the settings userform
---SIGNALS---
The signals script can be used for automation and can indicate up to 6 potential Profit Targets, as well as a Stop Loss based on how many bars back needs to be taken into consideration
The signals (Open/Close) can be automated using TradingView alerts, however the Stop Loss and Profit Taking are only indicators and are for the users own interpretation
The user does not have to place a Stop Loss or take profit at the Targets if so wished, the bot can be used to simply buy on an OPEN signal and sell on a CLOSE signal, however, the backtester will indicate that it is far more profitable to take profits.
It is advised to take profits just below indicated Targets as these are potentially high selling zones and price action can sometimes turn down just short of these targets.
---INVITE-ONLY SCRIPT---
This is an invite-only script, so if you would like to try out Kairos Bot, send me a message
