ZynAlgo TrendlinePurpose
ZynAlgo Trendline V2.0 is a trend-following indicator designed to help traders visually identify market direction, momentum alignment, and dynamic risk zones.
It combines multiple moving averages, multi-timeframe analysis, and slope validation to show when a market is trending, ranging, or reversing.
How It Works — Conceptual Breakdown
🔹 1. Trendline Framework (Three-Layer MA System)
The indicator plots three moving-average layers:
Type 1 Line – Fast MA for early trend detection
Type 2 Line – Medium MA as a stability filter
Trendline (200-period) – Long-term structural baseline
When all three are properly stacked and sloped, a directional bias is confirmed:
Bullish → Type 1 > Type 2 > Trendline
Bearish → Type 1 < Type 2 < Trendline
Sideways → Misaligned or flat
Users can select from SMA, EMA, WMA, RMA, SWMA, ALMA, VWAP, fully adjustable to match their style.
🔹 2. Touch-and-Confirm Entry Logic
Entries are visualized only when:
Price touches the selected confirmation line (Trendline, Type 1 or Type 2), and
The direction is re-confirmed within a given number of candles (confirmation window).
You can choose between:
Fixed Mode — confirmation only on the exact N-th candle after touch.
Interval Mode — confirmation allowed anytime within N candles after touch.
This method ensures signals only appear when structure and timing both align — reducing false momentum entries.
🔹 3. Multi-Timeframe Trend Filter (MTF Filter)
The indicator checks trend direction across up to 8 higher timeframes (5 min → Daily).
A signal is valid only if a chosen minimum number of those timeframes confirm the same direction.
This feature creates cross-timeframe confluence, helping users avoid counter-trend setups.
🔹 4. Slope-Based Market Filter
To prevent entries in sideways or choppy markets, the system verifies:
Each MA’s slope is above a user-defined threshold.
MAs are sufficiently spaced apart (using percentage-of-price separation).
When conditions are met, candles are color-coded:
🟩 Uptrend 🟥 Downtrend ⬜ Sideways/No-trade zone.
This gives immediate visual feedback about current market structure.
🔹 5. Dynamic Risk Management System
Choose among three Stop-Loss modes:
Structure-Based – Swing high/low referencing market structure.
MA-Based – Uses the selected moving-average line as a dynamic stop.
ATR-Based – Volatility-adaptive stop (default).
Each entry automatically projects up to three Take-Profit (TP1-TP3) levels using user-defined Risk-to-Reward ratios.
Lines and labels are plotted for Entry, SL, and each TP with optional persistence control (“keep old lines” setting).
🔹 6. Anti-Martingale / Cooldown Logic
A built-in cooldown timer ensures only one trade setup per cycle — new signals pause until the prior trade has reached either TP or SL.
This mechanism prevents overlapping trades and unwanted martingale-style stacking.
🔹 7. Compact On-Chart Dashboard
A small table (top-right corner) summarizes:
Current position (LONG / SHORT / FLAT)
SL mode in use
Confirmation source
Touch/confirmation mode
Cooldown state and remaining bars
This helps monitor settings without opening the menu.
🔹 8. Smart Alerts (Telegram / Discord / Both)
When a new BUY ↗ or SELL ↘ confirmation occurs, the script can send structured alerts containing:
Symbol
Entry price
TP1 – TP3 values
Stop Loss
Timestamp
You can select the preferred platform (Telegram / Discord / Both).
These alerts are optional and serve as notifications, not trade instructions.
Usage Guide
Trendline Length: Period of the main long-term moving average (default = 200). Higher = smoother, slower trendline.
Trendline Type / Type 1 / Type 2 Type: Choose from SMA, EMA, WMA, RMA, SWMA, ALMA, VWAP depending on your preference for responsiveness or smoothness.
Confirmation Source: Which MA must be touched by price to start a confirmation window (Trendline = conservative, Type 1 = frequent, Type 2 = balanced).
Confirmation Window: Number of bars allowed for price to confirm direction after touch.
Stop Loss Mode: Select ATR-based, structure-based, or MA-based stop visualization.
R:R Ratios (TP1-TP3) Adjust distances for visual target levels based on risk-to-reward multiples.
Enable MTF Filter: Require trend alignment across higher timeframes before showing a signal.
Enable Slope Filter: Prevents signals when MAs are flat or overlapping (sideways market).
Enable Candle Coloring: Colors candles by trend state for quick visual confirmation.
How to Use
Apply the indicator to a clean chart with no other overlays for clarity.
Check candle color:
Green → Uptrend; Red → Downtrend; Gray → Sideways.
Wait for a “BUY ↗” or “SELL ↘” label to appear after a valid touch + confirmation sequence.
Observe drawn lines: Entry = blue, SL = red, TP = green.
Use displayed levels as visual references only. You may combine them with your own entry rules or strategy.
Optional: enable the dashboard (top-right) to monitor trend filter states and settings in real time.
⛔ False-Signal Reduction
Combining slope validation with multi-timeframe agreement filters out low-probability entries — useful for traders who prefer quality over quantity.
🧩 Professional Execution Layer
Integrated Stop Loss / Take Profit projection, cooldown logic, and anti-martingale control give it a disciplined, rule-based behavior — a hallmark of algorithmic consistency.
📡 Automation-Ready Alerts
The built-in Telegram / Discord alert module (JSON-formatted payloads) allows direct bot integration for remote monitoring — no additional coding required.
Unlike public MA crossover scripts, ZynAlgo Trendline includes proprietary logic for slope-weighted alignment, MTF aggregation, and confirmation-window entry detection.
🔶 RISK DISCLAIMER
Trading is risky & most day traders lose money. All content, tools, scripts, articles, & education provided by ZynAlgo are purely for informational & educational purposes only. Past performance does not guarantee future results.
Cerca negli script per "bot"

coinbot_ICT_Unicorn(AUTOTRADE)1. 🎯 핵심 기능: 자동매매 신호 전송 (Webhook)
이 스크립트는 매매 신호가 발생할 때마다, 사용자가 '자동매매 설정(Autotrade Settings)'에 입력한 값들을 조합하여 구체적인 JSON 메시지를 생성하고 alert() 함수를 통해 웹훅으로 전송합니다.
입력 설정: user_id, exchange(거래소), leverage(레버리지), capital_percent(투입 시드 %), sl_percent(손절 %), 그리고 3단계 분할 익절(tp1_price_percent, tp1_qty_percent 등) 설정을 입력받습니다.
신호 종류:
ENTRY (진입): 매수(buy) 또는 매도(sell) 신호가 발생하면, 위 모든 설정값을 포함한 진입 명령을 보냅니다.
CLOSE (손절): 전략의 내부 로직에 의해 손절가에 도달하면(slAlertTick), 포지션을 종료하라는 신호를 보냅니다.
TAKE_PROFIT (익절): 목표가에 도달하면(tpAlertTick), 설정된 물량만큼 익절하라는 신호를 보냅니다.
2. 📈 작동 원리: "ICT 유니콘" 매매 전략
이 스크립트의 진입 로직은 ICT(Inner Circle Trader) 개념 중 하나인 **'유니콘 모델'**을 따릅니다.
구성 요소 식별:
Breaker Block (BB): '브레이커 블록'을 식별합니다. 이는 특정 고점/저점을 만든 후 그 방향으로 가지 못하고 반대 방향으로 돌파(Break)된 오더 블록(Order Block)입니다.
Fair Value Gap (FVG): '공정 가치 갭' (가격 불균형 영역)을 식별합니다.
핵심 진입 신호 (Unicorn): 이 전략의 핵심 진입 조건은 **Breaker Block(BB)과 Fair Value Gap(FVG)이 중첩(Overlap)**되는, 소위 '유니콘'이라 불리는 강력한 지지/저항 영역이 발생하는 것입니다.
Long (매수) 진입:
가격이 하락하며 **'하락형 브레이커 블록(Bearish Breaker Block)'**을 만듭니다.
이후 가격이 상승 돌파하며 이 브레이커 블록 영역과 중첩되는 **'상승형 FVG(Bullish FVG)'**를 생성합니다.
이 중첩 영역(FVG-BB Overlap)이 바로 매수 진입의 근거가 됩니다. (코드가 dbgRequireRetracement 설정에 따라 FVG로의 되돌림을 기다리거나 즉시 진입 신호를 보냅니다.)
Short (매도) 진입:
가격이 상승하며 **'상승형 브레이커 블록(Bullish Breaker Block)'**을 만듭니다.
이후 가격이 하락 돌파하며 이 브레이커 블록 영역과 중첩되는 **'하락형 FVG(Bearish FVG)'**를 생성합니다.
이 중첩 영역이 매도 진입의 근거가 됩니다.
3. 📊 부가 기능
시각화: 차트 상에 FVG 영역과 Breaker Block 영역을 박스로 그려주어(설정에 따라 표시/숨김 가능) 매매 근거를 시각적으로 확인할 수 있게 합니다.
백테스팅 대시보드: 차트 우측 상단(기본값)에 이 전략의 누적 성과(총 진입 횟수, 승/패, 승률, 총수익률)를 보여주는 대시보드를 표시합니다.
요약
이 스크립트는 **"Breaker Block과 FVG의 중첩(유니콘 모델)"**을 유일한 진입 조건으로 사용하는 매우 구체적인 ICT 전략입니다. 이 조건이 충족되면, 사용자가 미리 설정한 상세한 리스크 관리 값들을 담아 자동매매 봇으로 즉시 실행 가능한 주문 신호를 전송하는 '올인원(All-in-One)' 전략 스크립트입니다.
요청하신 대로, 해당 지표 요약본을 영어로 번역하여 제공합니다.
This script is an automated trading (Autotrade) strategy signal generator based on the ICT "Unicorn" trading model.
As the "AUTOTRADE" in its name implies, the core purpose of this indicator is to detect specific conditions on the chart and send JSON-formatted order signals (webhooks) to an external automated trading bot.
Here are the core mechanics and features of this script:
1. 🎯 Core Feature: Automated Signal Transmission (Webhook)
Whenever a trade signal occurs, this script generates a specific JSON message by combining the values entered by the user in the "Autotrade Settings" and sends it via webhook using the alert() function.
Input Settings: It takes inputs for user_id, exchange, leverage, capital_percent (equity %), sl_percent (stop loss %), and settings for 3-stage split take-profits (e.g., tp1_price_percent, tp1_qty_percent).
Signal Types:
ENTRY: When a "buy" or "sell" signal occurs, it sends an entry command including all the settings above.
CLOSE (Stop-Loss): If the price hits the stop loss according to the strategy's internal logic (slAlertTick), it sends a signal to close the position.
TAKE_PROFIT: When a profit target is reached (tpAlertTick), it sends a signal to take profit on the specified quantity.
2. 📈 How It Works: The "ICT Unicorn" Strategy
The script's entry logic follows the "Unicorn Model," one of the concepts from ICT (Inner Circle Trader).
Identifying Components:
Breaker Block (BB): It identifies a "Breaker Block." This is an Order Block that, after creating a specific high/low, fails to continue in that direction and is instead broken through in the opposite direction.
Fair Value Gap (FVG): It identifies a "Fair Value Gap" (a price imbalance area).
Core Entry Signal (The Unicorn): The core entry condition for this strategy is the overlap of a Breaker Block (BB) and a Fair Value Gap (FVG), which creates a powerful support/resistance zone known as the "Unicorn."
Long Entry:
Price moves down, creating a "Bearish Breaker Block."
Subsequently, price breaks upward, creating a "Bullish FVG" that overlaps with this Breaker Block area.
This overlapping area (FVG-BB Overlap) becomes the basis for the long entry. (Depending on the dbgRequireRetracement setting, the code either waits for a retracement to the FVG or sends an immediate entry signal.)
Short Entry:
Price moves up, creating a "Bullish Breaker Block."
Subsequently, price breaks downward, creating a "Bearish FVG" that overlaps with this Breaker Block area.
This overlapping area becomes the basis for the short entry.
3. 📊 Additional Features
Visualization: It draws the FVG and Breaker Block zones as boxes on the chart (can be toggled in settings), allowing for visual confirmation of the trade setup.
Backtesting Dashboard: It displays a dashboard in the top-right corner (by default) showing the strategy's cumulative performance (total entries, wins/losses, win rate, total profit).
Summary
This script is a highly specific ICT strategy that uses the "overlap of a Breaker Block and an FVG (the Unicorn Model)" as its sole entry condition. When this condition is met, it transmits an immediately executable order signal to an automated trading bot, complete with all the detailed risk management values preset by the user. It is an "all-in-one" strategy script.

Addikro_V1📌 Description – Trend+Entry+Risk Indicator
This indicator combines statistically proven trading concepts into a complete trading framework:
✅ Trend Filter (EMA200)
All trades follow the higher-timeframe trend. Trend direction is clearly visualized.
✅ Entry Signals (you can choose):
EMA Crossover (EMA50 crossing EMA200) — classic trend-following entry
Breakout of recent highs/lows (20-bar range) — optionally only valid after a pullback to EMA50
✅ ATR-Based Risk Management:
Dynamic Stop Loss (SL) and Take Profit (TP1/TP2) levels using ATR
The last entry is saved — SL/TP lines stay visible on the chart
Optional position size suggestion based on % risk of account
✅ Smart Filters for Higher Accuracy:
RSI filter: e.g., only long if RSI > 50
Volume filter: signal only if volume is above SMA × multiplier
✅ Fixed Chart HUD (Table Overlay):
Displays live information anchored to the chart (does not move with candles)
Shows: Trend direction, entry mode, RSI, ATR, SL/TP multiplier, position size suggestion
Position can be set: top-left / top-right / bottom-left / bottom-right
✅ Signals & Alerts:
Visual arrows on the chart for long/short signals
Custom alert conditions included (works with mobile, email, webhook, bots)
🎯 Why this indicator works
It follows the same logic used by many successful systematic and hedge fund strategies:
Trend direction + statistically solid entries + strict risk management → no repainting, no guessing, no emotion.

ICT Sweep + CHoCH + FVG Alerts
### 🔥 ICT Sweep + CHoCH + FVG Alerts
Script designed to automate ICT entry confirmations using:
• Liquidity Sweep (Buy/Sell Stops taken)
• Change of Character (CHoCH)
• Fair Value Gap (FVG) confirmation
### ✅ Conditions
**Long signal when:**
1. Bearish liquidity sweep
2. Bullish CHoCH
3. Bullish FVG forms and gets respected
**Short signal when:**
1. Bullish liquidity sweep
2. Bearish CHoCH
3. Bearish FVG forms and gets respected
### 🎯 Purpose
This script helps traders detect smart-money setup entries based on ICT logic and receive alerts in real time.
### 📡 Alerts
Supports webhook automation for bots, signal servers, or trading platforms.
*This script does not place trades automatically, alerts only.*
### ⚠️ Disclaimer
This tool is for educational purposes.
Always backtest and use proper risk management.
Trend Catch STFR - whipsaw Reduced### Summary of the Setup
This trading system combines **SuperTrend** (a trend-following indicator based on ATR for dynamic support/resistance), **Range Filter** (a smoothed median of the last 100 candles to identify price position relative to a baseline), and filters using **VIX Proxy** (a volatility measure: (14-period ATR / 14-period SMA of Close) × 100) and **ADX** (Average Directional Index for trend strength). It's designed for trend trading with volatility safeguards.
- **Entries**: Triggered only in "tradeable" markets (VIX Proxy ≥ 15 OR ADX ≥ 20) when SuperTrend aligns with direction (green for long, red for short), price crosses the Range Filter median accordingly, and you're not already in that position.
- **Exits**: Purely price-based—exit when SuperTrend flips or price crosses back over the Range Filter median. No forced exits from low volatility/trend.
- **No Trade Zone**: Blocks new entries if both VIX Proxy < 15 AND ADX < 20, but doesn't affect open positions.
- **Overall Goal**: Enter trends with confirmed strength/volatility, ride them via price action, and avoid ranging/choppy markets for new trades.
This creates a filtered trend-following strategy that prioritizes quality entries while letting winners run.
### Advantages
- **Reduces Noise in Entries**: The VIX Proxy and ADX filters ensure trades only in volatile or strongly trending conditions, avoiding low-momentum periods that often lead to false signals.
- **Lets Winners Run**: Exits based solely on price reversal (SuperTrend or Range Filter) allow positions to stay open during temporary lulls in volatility/trend, potentially capturing longer moves.
- **Simple and Balanced**: Combines trend (SuperTrend/ADX), range (Filter), and volatility (VIX Proxy) without overcomplicating—easy to backtest and adapt to assets like stocks, forex, or crypto.
- **Adaptable to Markets**: The "OR" logic for VIX/ADX provides flexibility (e.g., enters volatile sideways markets if ADX is low, or steady trends if VIX is low).
- **Risk Control**: Implicitly limits exposure by blocking entries in calm markets, which can preserve capital during uncertainty.
### Disadvantages
- **Whipsaws in Choppy Markets**: As you noted, SuperTrend can flip frequently in ranging conditions, leading to quick entries/exits and small losses, especially if the Range Filter isn't smoothing enough noise.
- **Missed Opportunities**: Strict filters (e.g., requiring VIX ≥ 15 or ADX ≥ 20) might skip early-stage trends or low-volatility grinds, reducing trade frequency and potential profits in quiet bull/bear markets.
- **Lagging Exits**: Relying only on price flips means you might hold losing trades longer if volatility drops without a clear reversal, increasing drawdowns.
- **Parameter Sensitivity**: Values like VIX 15, ADX 20, or Range Filter's 100-candle lookback need tuning per asset/timeframe; poor choices could amplify whipsaws or over-filter.
- **No Built-in Risk Management**: Lacks explicit stops/targets, so it relies on user-added rules (e.g., ATR-based stops), which could lead to oversized losses if not implemented.
### How to Use It
This system can be implemented in platforms like TradingView (via Pine Script), Python (e.g., with TA-Lib or Pandas), or MT4/5. Here's a step-by-step guide, assuming TradingView for simplicity—adapt as needed. (If coding in Python, use libraries like pandas_ta for indicators.)
1. **Set Up Indicators**:
- Add SuperTrend (default: ATR period 10, multiplier 3—adjust as suggested in prior tweaks).
- Create Range Filter: Use a 100-period SMA of (high + low)/2, smoothed (e.g., via EMA if desired).
- Calculate VIX Proxy: Custom script for (ATR(14) / SMA(close, 14)) * 100.
- Add ADX (period 14, standard).
2. **Define Rules in Code/Script**:
- **Long Entry**: If SuperTrend direction < 0 (green), close > RangeFilterMedian, (VIX Proxy ≥ 15 OR ADX ≥ 20), and not already long—buy on bar close.
- **Short Entry**: If SuperTrend direction > 0 (red), close < RangeFilterMedian, (VIX Proxy ≥ 15 OR ADX ≥ 20), and not already short—sell short.
- **Exit Long**: If in long and (SuperTrend > 0 OR close < RangeFilterMedian)—sell.
- **Exit Short**: If in short and (SuperTrend < 0 OR close > RangeFilterMedian)—cover.
- Monitor No Trade Zone visually (e.g., plot yellow background when VIX < 15 AND ADX < 20).
3. **Backtest and Optimize**:
- Use historical data on your asset (e.g., SPY on 1H chart).
- Test metrics: Win rate, profit factor, max drawdown. Adjust thresholds (e.g., ADX to 25) to reduce whipsaws.
- Forward-test on demo account to validate.
4. **Live Trading**:
- Apply to a chart, set alerts for entries/exits.
- Add risk rules: Position size 1-2% of capital, stop-loss at SuperTrend line.
- Monitor manually or automate via bots—avoid overtrading; use on trending assets.
For the adjustments I suggested earlier (e.g., ADX 25, 2-bar confirmation), integrate them into entries only—test one at a time to isolate improvements. If whipsaws persist, combine 2-3 tweaks.

Scalp BTC/ETH — Reversal & Continuation (v1, Pine v6)Scalp BTC/ETH — Reversal & Continuation (1m à 10m)
Cet indicateur détecte des opportunités de micro-scalping sur futures (BTC/ETH) basées sur deux mécaniques courtes validées par structure de prix :
A) Reversal de pression (contre-mouvement contrôlé)
Détection d’une sur-extension brutale suivie d’une absorption sur la bougie suivante.
Objectif : capturer la première respiration après un excès de prix (rejet court).
B) Continuation courte (momentum + reprise)
Détection de 3 bougies directionnelles consécutives suivies d’un pullback léger, puis signal sur la reprise du mouvement initial.
Gestion intégrée (scénario standard TP dynamique)
TP1 → 50% de la position à un gain fixe (% adaptable au timeframe)
Stop déplacé au Break-Even sur le restant
Sortie finale sur bougie inverse significative
(correction ≥ X% du corps précédent) ou timeout (max bars en trade)
Scalp BTC/ETH — Reversal & Continuation (1m to 10m)
This indicator detects short-term futures scalping setups on BTC & ETH using two mechanical price-action models designed for fast execution:
A) Reversal Compression (counter-move entry)
Identifies a sharp impulse (overextension) followed by absorption / failure to extend on the next candle.
Objective: capture the first corrective pullback after exhaustion.
B) Controlled Continuation (momentum follow-through)
Identifies 3 consecutive trend candles, then a shallow pullback, and triggers an entry on the resumption of the main leg.
Built-in trade logic (dynamic TP structure)
TP1 → scale out 50% of the position at a fixed percentage (auto-scaled per timeframe)
Stop moved to Break-Even after TP1
Final exit on either:
• a meaningful opposite candle (≥ X% correction of prior body), or
• a timeout (max bars in trade)
Technical characteristics
Designed for 1m / 3m / 5m / 7m / 10m
No repainting (bar-close confirmed logic)
Works for both LONG & SHORT
Built-in alert events:
ENTRY_LONG / ENTRY_SHORT / TP1 / EXIT_STOP / EXIT_INVERSE / EXIT_TIMEOUT
Suitable for manual execution, semi-automation (alerts) or full bot integration (webhook JSON)
Purpose
Provide a repeatable, rule-based, non-subjective framework to harvest micro-moves with controlled risk, without relying on lagging indicators or long-term prediction.
(A Strategy / backtesting version is planned as a next iteration.)

Quadruple AlphaTrendKivancOzbilgi's 'Alpha Trend' indicator has been developed as 'Quadruple Alpha Trend'.
It has been extended to AlphaTrend1,2,3,4, and each line allows users to freely choose colors.
Each of the AT1 to 2 and AT3 to 4 was again color-transformed at the crossing point, respectively.
We believe that the value of AT can compensate a lot for all the shortcomings of a regular moving average.
It can show the support and resistance of the low and high points at each horizontal section and
pressed neck point at the same time
Draw a horizontal line type.
These advantages make it easy to visually break through and collapse support and resistance on the monthly, weekly, and daily charts
It makes it possible to distinguish. I think it's an excellent indicator design by Kivanc Ozbilgi.
The most similar indicator to this one is the "UT BOT", which is close to the moving average in terms of support and resistance
Because it gives a euphemism, the value of "Alpha Trend" as an index that includes horizontal support and resistance
Very highly appreciated. If you have any issues or need to develop further, please leave a note.
HEMA Trend Levels [AlgoAlpha]This indicator analyzes trend, momentum, volume and liquidity traps to generate LONG/SHORT signals.
It also includes automatic support/resistance zones, volatility warnings, and a risk panel.
Features:
EMA, DEMA, RSI, MACD, ADX, HTF EMA confirmations
ATR-based TP1 / TP2 targets with trailing SL
Liquidity trap / wick detection
Pump/dump movement alarms
Colored Heikin Ashi candles
Automatic support/resistance zones (pivot-based)
Top-right panel with trend, RSI, MACD, volume/ADX, active trade and risk score
How to Use:
Timeframes: Best for 1m–15m scalping, 1H–4H swing trading.
Signals: “BUY” label → Long entry, “SELL” label → Short entry.
Zones: Green = support, Red = resistance.
Alerts: High ATR = reduce leverage, Bot trap = caution.
Panel: When trend & confirmations align, the signal is stronger.
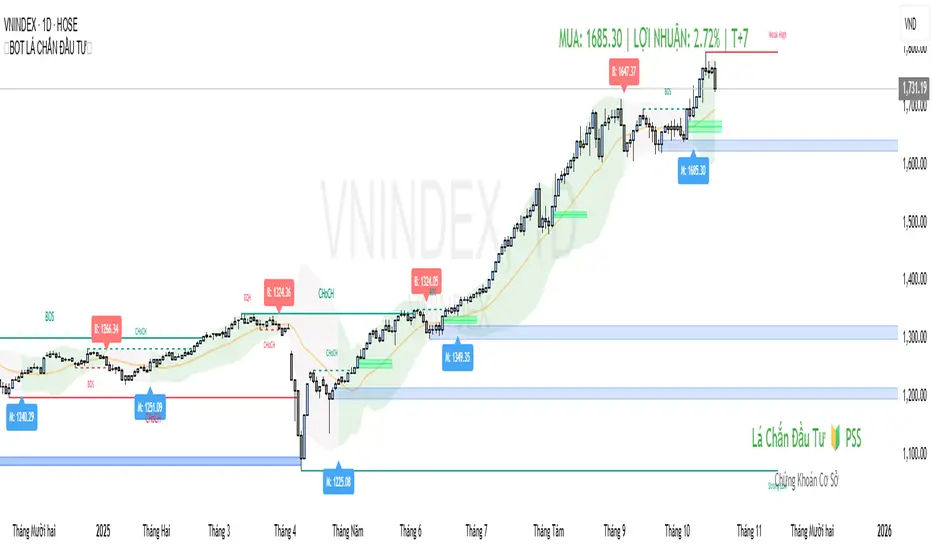
🔰BOT TEAM PSS🔰This hybrid strategy integrates the institutional focus of Smart Money Concepts (SMC) with the confirmation power of technical indicators. The approach begins with an SMC framework, identifying high-probability zones such as Order Blocks (OB), Fair Value Gaps (FVG), and liquidity pools. Traders first analyze market structure, watching for a Market Structure Shift (MSS) or Change of Character (CHoCH) to signal a potential shift in direction.
Once price retraces into a key SMC zone, the trader does not enter immediately. Instead, they seek confirmation from a specialized indicator, such as a proprietary tool developed by the 'La Chan Dau Tu' (Investment Shield) team. This custom indicator is specifically designed to validate SMC signals, filtering out low-probability trades. This dual-layer analysis is key: SMC provides the high-probability "where," while the team's indicator provides the "when," confirming momentum alignment before entry.

🔰BOT LÁ CHẮN ĐẦU TƯ🔰This hybrid strategy integrates the institutional focus of Smart Money Concepts (SMC) with the confirmation power of technical indicators. The approach begins with an SMC framework, identifying high-probability zones such as Order Blocks (OB), Fair Value Gaps (FVG), and liquidity pools. Traders first analyze market structure, watching for a Market Structure Shift (MSS) or Change of Character (CHoCH) to signal a potential shift in direction.
Once price retraces into a key SMC zone (e.g., a bullish OB), the trader does not enter immediately. Instead, they seek confirmation from a specialized indicator, such as a proprietary tool developed by the 'La Chan Dau Tu' (Investment Shield) team. This custom indicator is specifically designed to validate SMC signals, filtering out low-probability trades. This dual-layer analysis is key: SMC provides the high-probability "where," while the team's indicator provides the "when," confirming momentum alignment before entry.
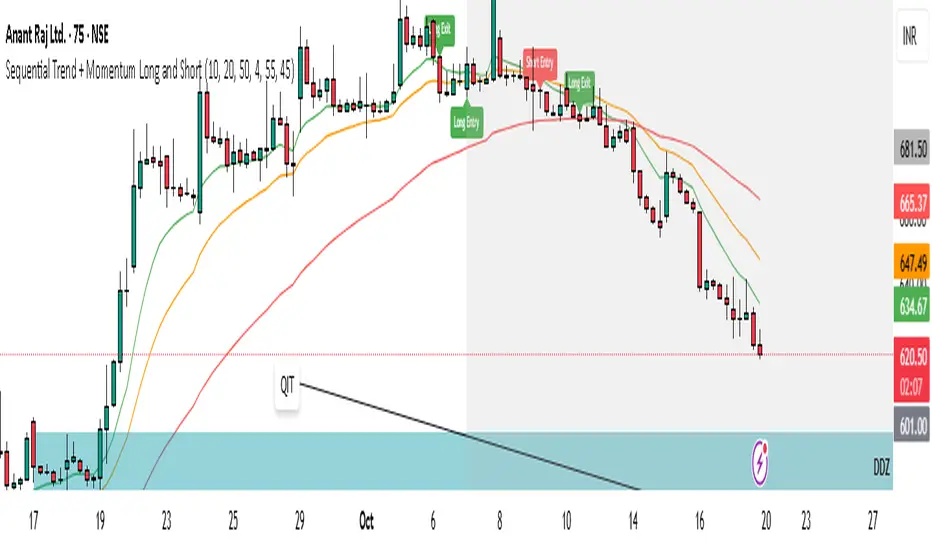
Sequential Trend + Momentum Long and Short📈 Signals
🟢 Long Entry: EMA trend turns bullish and RSI confirms momentum.
🔴 Short Entry: EMA trend turns bearish and RSI confirms momentum.
🟢 Long Exit: Price drops below EMA Exit zone.
🔴 Short Exit: Price rises above EMA Exit zone.
🧩 Parameters
Input Description
EMA Fast Short-term EMA for trend detection
EMA Slow Medium-term EMA for trend filtering
EMA Exit Longer EMA for trailing exit confirmation
RSI Length Period of RSI used for momentum check
RSI Long Threshold RSI value confirming bullish momentum
RSI Short Threshold RSI value confirming bearish momentum
🚀 How to Use
Apply the indicator on your preferred timeframe (15min–1h recommended).
Use Long Entry and Short Entry markers for potential trade setups.
Combine with your own stop-loss & target rules or automate via webhook.
Alerts are built-in for all entries/exits and can be sent to trading bots or brokers.
🔔 Alerts
Sequential Long Entry Triggered → triggers when bullish conditions align.
Sequential Long Exit Triggered → triggers when long trend weakens.
Sequential Short Entry Triggered → triggers when bearish conditions align.
Sequential Short Exit Triggered → triggers when short trend weakens.
🧭 Best Practices
Works best in trending markets; avoid ranging conditions.
Can be paired with volume filters or higher timeframe confirmation for better accuracy.
Adjustable EMA and RSI values make it flexible across assets (stocks, crypto, indices).
Algo Trading Signals - Buy/Sell System# 📊 Algo Trading Signals - Dynamic Buy/Sell System
## 🎯 Overview
**Algo Trading Signals** is a sophisticated intraday trading indicator designed for algorithmic traders and active day traders. This system generates precise buy and sell signals based on a dynamic box breakout strategy with intelligent position management, add-on entries, and automatic target adjustment.
The indicator creates a reference price box during a specified time window (default: 9:15 AM - 9:45 AM IST) and generates high-probability signals when price breaks out of this range with confirmation.
---
## ✨ Key Features
### 📍 **Smart Signal Generation**
- **Primary Entry Signals**: Clear buy/sell signals on confirmed breakouts above/below the reference box
- **Confirmation Bars**: Reduces false signals by requiring multiple bar confirmation before entry
- **Cooldown System**: Prevents overtrading with configurable cooldown periods between trades
- **Add-On Positions**: Automatically identifies optimal pullback entries for scaling into positions
### 📦 **Dynamic Reference Box**
- Creates a high/low range during your chosen time window
- Automatically updates after each successful trade
- Visual box display with color-coded boundaries (red=resistance, green=support)
- Mid-level reference line for market structure analysis
### 🎯 **Intelligent Position Management**
- **Automatic Target Calculation**: Sets profit targets based on average move distance
- **Add-On System**: Up to 3 additional entries on optimal pullbacks
- **Position Tracking**: Monitors active trades and remaining add-on capacity
- **Auto Box Shift**: Adjusts reference box after target hits for continued trading
### 📊 **Visual Clarity**
- **Color-Coded Labels**:
- 🟢 Green for BUY signals
- 🔴 Red for SELL signals
- 🔵 Blue for ADD-ON buys
- 🟠 Orange for ADD-ON sells
- ✓ Yellow for Target hits
- **TP Level Lines**: Dotted lines showing current profit targets
- **Hover Tooltips**: Detailed information on entry prices, targets, and add-on numbers
### 📈 **Real-Time Statistics**
Live performance dashboard showing:
- Total buy and sell signals generated
- Number of add-on positions taken
- Take profit hits achieved
- Current trade status (LONG/SHORT/None)
- Cooldown timer status
### 🔔 **Comprehensive Alerts**
Built-in alert conditions for:
- Primary buy entry signals
- Primary sell entry signals
- Add-on buy positions
- Add-on sell positions
- Buy take profit hits
- Sell take profit hits
---
## 🛠️ Configuration Options
### **Time Settings**
- **Box Start Hour/Minute**: Define when to begin tracking the reference range
- **Box End Hour/Minute**: Define when to lock the reference box
- **Default**: 9:15 AM - 9:45 AM (IST) - Perfect for Indian market opening range
### **Trade Settings**
- **Target Points (TP)**: Average move distance for profit targets (default: 40 points)
- **Breakout Confirmation Bars**: Number of bars to confirm breakout (default: 2)
- **Cooldown After Trade**: Bars to wait after closing position (default: 3)
- **Add-On Distance Points**: Minimum pullback for add-on entry (default: 40 points)
- **Max Add-On Positions**: Maximum additional positions allowed (default: 3)
### **Display Options**
- Toggle buy/sell signal labels
- Show/hide trading box visualization
- Show/hide TP level lines
- Show/hide statistics table
---
## 💡 How It Works
### **Phase 1: Box Formation (9:15 AM - 9:45 AM)**
The indicator tracks the high and low prices during your specified time window to create a reference box representing the opening range.
### **Phase 2: Breakout Detection**
After the box is locked, the system monitors for:
- **Bullish Breakout**: Price closes above box high for confirmation bars
- **Bearish Breakout**: Price closes below box low for confirmation bars
### **Phase 3: Signal Generation**
When confirmation requirements are met:
- Entry signal is generated with clear visual label
- Target price is calculated (Entry ± Target Points)
- Position tracking activates
- Cooldown timer starts
### **Phase 4: Position Management**
During active trade:
- **Add-On Logic**: If price pulls back by specified distance but stays within favorable range, additional entry signal fires
- **Target Monitoring**: Continuously checks if price reaches TP level
- **Box Adjustment**: After TP hit, box automatically shifts to new range for next opportunity
### **Phase 5: Trade Exit & Reset**
On target hit:
- Position closes with TP marker
- Statistics update
- Box repositions for next setup
- Cooldown activates
- System ready for next signal
---
## 📌 Best Use Cases
### **Ideal For:**
- ✅ Intraday breakout trading strategies
- ✅ Algorithmic trading systems (via alerts/webhooks)
- ✅ Opening range breakout (ORB) strategies
- ✅ Index futures (Nifty, Bank Nifty, Sensex)
- ✅ High-liquidity stocks with clear ranges
- ✅ Automated trading bots
- ✅ Scalping and day trading
### **Markets:**
- Indian Stock Market (NSE/BSE)
- Futures & Options
- Forex pairs
- Cryptocurrency (adjust timing for 24/7 markets)
- Global indices
---
## ⚙️ Integration with Algo Trading
This indicator is **algo-ready** and can be integrated with automated trading systems:
1. **TradingView Alerts**: Set up alert conditions for each signal type
2. **Webhook Integration**: Connect alerts to trading platforms via webhooks
3. **API Automation**: Use with brokers supporting TradingView integration (Zerodha, Upstox, Interactive Brokers, etc.)
4. **Signal Data Access**: All signals are plotted for external data retrieval
---
## 📖 Quick Start Guide
1. **Add Indicator**: Apply to your chart (works best on 1-5 minute timeframes)
2. **Configure Time Window**: Set your desired box formation period
3. **Adjust Parameters**: Tune confirmation bars, targets, and add-on settings to your trading style
4. **Set Alerts**: Create alert conditions for automated notifications
5. **Backtest**: Review historical signals to validate strategy performance
6. **Go Live**: Enable alerts and start receiving real-time trading signals
---
## ⚠️ Risk Disclaimer
This indicator is a **tool for analysis** and does not guarantee profits. Trading involves substantial risk of loss. Always:
- Use proper position sizing
- Implement stop losses (not included in this indicator)
- Test thoroughly before live trading
- Understand market conditions
- Never risk more than you can afford to lose
- Consider your risk tolerance and trading experience
**Past performance does not indicate future results.**
## 🔄 Version History
**v1.0** - Initial Release
- Dynamic box formation system
- Confirmed breakout signals
- Add-on position management
- Visual signal labels and statistics
- Comprehensive alert system
- Auto-adjusting target boxes
---
## 📞 Support & Feedback
If you find this indicator helpful:
- ⭐ Please leave a like/favorite
- 💬 Share your feedback in comments
- 📊 Share your results and improvements
- 🤝 Suggest features for future updates
---
## 🏷️ Tags
`breakout` `daytrading` `signals` `algo` `automated` `intraday` `ORB` `opening-range` `buy-sell` `scalping` `futures` `nifty` `banknifty` `algorithmic` `box-strategy`
*Remember: The best indicator is combined with proper risk management and trading discipline.* Use it at your own rist, not as financial advie


HAZ_10FSuper Trends Bot 10Frams .
A custom indicator that displays enhanced candles with a dynamic signal line and ATR-based alerts.
It highlights market direction using color-coded bars and provides clear buy/sell signals for entries and exits.
Designed for traders who want quick signals and smoother price action with reduced market noise.

Big Gong Reminder Assistant 大的要来小助手我是大的要来了小助手,我负责提醒大家大的要来了
I’m the Gong Reminder bot—here to alert everyone when the big gong is coming.
Ravi AlgoBot📌 Indicator Description (Publish Notes)
Indicator Name:
EoR / EoS Entry & SL/Target Manager (Put=Red, Call=Green)
Purpose:
यह indicator उन traders के लिए बनाया गया है जो अपनी manual levels (EoR, EoR+1 for Put, और EoS, EoS-1 for Call) को chart पर plot करना चाहते हैं और उनके आधार पर Entry, Stop Loss और Target manage करना चाहते हैं।
How it works:
आप manual prices (EoR, EoR+1, EoS, EoS-1) input fields में डालेंगे।
Put levels (EoR, EoR+1) लाल रंग में दिखेंगे।
Call levels (EoS, EoS-1) हरे रंग में दिखेंगे।
हर price पर chart पर horizontal line + label बनेगा।
आप अपने Stop Loss और Target prices भी manual डाल सकते हैं (Call और Put दोनों के लिए अलग-अलग)।
जब भी price किसी entry/SL/Target level को touch करेगा:
Chart पर signal shape बनेगा (triangle)
एक alertcondition trigger होगा।
आप TradingView में Alerts create करके इन alerts को webhook URL से connect कर सकते हैं।
Example: जब EoR Put level touch हो → webhook के ज़रिए broker/bot में auto order लग जाएगा।
SL और Target levels भी इसी तरह alerts से manage होंगे।
Use Case:
Manual level-based intraday या positional trading
Automated trading setup (via TradingView alerts → Webhook → Broker API)
Put/Call entry, target, SL को clearly visualize और monitor करना
Disclaimer:
यह indicator trading automation tool नहीं है। Actual buy/sell orders Pine Script से नहीं लग सकते। Order execution केवल TradingView Alerts और external webhook के integration से ही possible है। कृपया पहले paper-trade और test करें।

All-In-One MA Stack ScalperWhat is this Indicator?
This tool is an advanced, multi-layered breakout and trend-following indicator designed for lower timeframes. It identifies high-conviction buy and sell signals by combining moving average stacking with a suite of professional-grade filters.
How Does It Work?
A signal is generated only when ALL of the following conditions are met:
Moving Average Stack (5M Chart):
Buy: The close price is above all five moving averages (MAs: 100, 48, 36, 24, 12).
Sell: The close price is below all five MAs.
Volatility Filter (ATR):
Signals only print when the current ATR (14) is at least 80% of its 100-period average, ensuring you only trade in actively moving markets.
Candle Structure Filter:
The current candle must have a real body that is at least 35% of the candle’s total range, filtering out dojis and indecision bars.
Big Candle Filter:
The candle’s total range must be at least 40% of the current ATR, avoiding signals on minor, insignificant moves.
Volume Filter:
The current volume must be at least 80% of its 50-period average, filtering out signals during illiquid or quiet market conditions.
Minimum Distance from All MAs:
Price must be a minimum distance (20% ATR) away from each MA, confirming a clean breakout and avoiding signals in tight MA clusters or ranging markets.
RSI Momentum Filter:
Buy: RSI(14) must be greater than 55.
Sell: RSI(14) must be less than 45.
This ensures trades are only taken in the direction of momentum.
ADX Trend Filter:
ADX(14,14) must be above 20, ensuring signals only print in trending conditions (not in chop/range).
Minimum Bars Between Signals:
Only one signal per direction is allowed every 10 bars to avoid overtrading and signal clustering.
What Does This Achieve?
Reduces noise and false signals common in basic MA cross or stack systems.
Captures only strong, high-momentum, and high-conviction moves.
Helps you avoid chop, range, and news whipsaws by combining multiple market filters.
Perfect for advanced scalpers, intraday trend followers, or as a trade filter for algos/EAs.
How to Use It:
Apply to your 5-minute chart.
Green BUY signals: Only when all bullish conditions align.
Red SELL signals: Only when all bearish conditions align.
Use as a stand-alone system or as a filter for your own entries.
Recommended For:
Scalpers & intraday traders who want only the best opportunities.
EA and bot builders seeking reliable signal logic.
Manual traders seeking confirmation of high-probability breakouts.
Tip:
Adjust any of the filters (e.g., RSI/ADX thresholds, minBars, minDist) to make it more/less selective for your style or market.

Support and Resistance levels from Options DataINTRODUCTION
This script is designed to visualize key support and resistance levels derived from options data on TradingView charts. It overlays lines, labels, and boxes to highlight levels such as Put Walls (gamma support), Call Walls (gamma resistance), Gamma Flip points, Vanna levels, and more.
These levels are intended to help traders identify potential areas of price magnetism, reversal, or breakout based on options market dynamics. All calculations and visualizations are based on user-provided data pasted into the input field, as Pine Script cannot directly fetch external options data due to platform limitations (explained below).
For convenience, my website allows users to interact with a bot that will generate the string for up to 30 tickers at once getting nearly real-time data on demand (data is cached for 15min). With the output string pasted into this indicator, it's a bliss to shuffle through your portfolio and see those levels for each ticker.
The script is open-source under TradingView's terms, allowing users to study, modify, and improve it. It draws inspiration from common options-derived metrics like gamma exposure and vanna, which are widely discussed in financial literature. No external code is copied without rights; all logic is original or based on standard mathematical formulas.
How the Options Levels Are Calculated
The levels displayed by this script are not computed within Pine Script itself—instead, they rely on pre-calculated values provided by the user (via a pasted data string). These values are derived from options chain data fetched from financial APIs (e.g., using libraries like yfinance in Python). Here's a step-by-step overview of how these levels are generally calculated externally before being input into the script:
Fetching Options Data:
Historical and current options chain data for a ticker (e.g., strikes, open interest, volume, implied volatility, expirations) is retrieved for near-term expirations (e.g., up to 90 days).
Current stock price is obtained from recent history.
Gamma Support (Put Wall) and Resistance (Call Wall):
Gamma Calculation: For each option, gamma (the rate of change of delta) is computed using the Black-Scholes formula:
gamma = N'(d1) / (S * sigma * sqrt(T))
where S is the stock price, K is the strike, T is time to expiration (in years), sigma is implied volatility, r is the risk-free rate (e.g., 0.0445), and N'(d1) is the normal probability density function.
Weighted gamma is multiplied by open interest and aggregated by strike.
The Put Wall is the strike below the current price with the highest weighted gamma from puts (acting as support).
The Call Wall is the strike above the current price with the highest weighted gamma from calls (acting as resistance).
Short-term versions focus on strikes closer to the money (e.g., within 10-15% of the price).
Gamma Flip Level:
Net dealer gamma exposure (GEX) is calculated across all strikes:
GEX = sum (gamma * OI * 100 * S^2 * sign * decay)
where sign is +1 for calls/-1 for puts, and decay is 1 / sqrt(T).
The flip point is the price where net GEX changes sign (from positive to negative or vice versa), interpolated between strikes.
Vanna Levels:
Vanna (sensitivity of delta to volatility) is calculated:
vanna = -N'(d1) * d2 / sigma
where d2 = d1 - sigma * sqrt(T).
Weighted by open interest, the highest positive and negative vanna strikes are identified.
Other Levels:
S1/R1: Significant strikes with high combined open interest and volume (80% OI + 20% volume), below/above price for support/resistance.
Implied Move: ATM implied volatility scaled by S * sigma * sqrt(d/365) (e.g., for 7 days).
Call/Put Ratio: Total call contracts divided by put contracts (OI + volume).
IV Percentage: Average ATM implied volatility.
Options Activity Level: Average contracts per unique strike, binned into levels (0-4).
Stop Loss: Dynamically set below the lowest support (e.g., Put Wall, Gamma Flip), adjusted by IV (tighter in low IV).
Fib Target: 1.618 extension from Put Wall to Call Wall range.
Previous day levels are stored for comparison (e.g., to detect Call Wall movement >2.5% for alerts).
Effect as Support and Resistance in Technical Trading
Options levels like gamma walls influence price action due to market maker hedging:
Put Wall (Gamma Support): High put gamma below price creates a "magnet" effect—market makers buy stock as price falls, providing support. Traders might look for bounces here as entry points for longs.
Call Wall (Gamma Resistance): High call gamma above price leads to selling pressure from hedging, acting as resistance. Rejections here could signal trims, sells or even shorts.
Gamma Flip: Where gamma exposure flips sign, often a volatility pivot—crossing it can accelerate moves (bullish above, bearish below).
Vanna Levels: Positive/negative vanna indicate volatility sensitivity; crosses may signal regime shifts.
Implied Move: Shows expected range; prices outside suggest overextension.
S1/R1 and Fib Target: Volume/OI clusters act as classic S/R; Fib extensions project upside targets post-breakout.
In trading, these are not guarantees—combine with TA (e.g., volume, trends). High activity levels imply stronger effects; low CP ratio suggests bearish sentiment. Alerts trigger on proximities/crosses for awareness, not advice.
Limitations of the TradingView Platform for Data Pulling
TradingView's Pine Script is sandboxed for security and performance:
No direct internet access or API calls (e.g., can't fetch yfinance data in-script).
Limited to chart data/symbol info; no real-time options chains.
Inputs are static per load; updates require manual pasting.
Caching isn't persistent across sessions.
This prevents dynamic data pulling, ensuring scripts remain lightweight but requiring external tools for fresh data.
Creative Solution for On-Demand Data Pulling
To overcome these limitations, users can use external tools or scripts (e.g., Python-based) to fetch and compute levels on demand. The tool processes tickers, generates a formatted string (e.g., "TICKER:level1,level2,...;TIMESTAMP:unix;"), and users paste it into the script's input. This keeps data fresh without violating platform rules, as computation happens off-platform. For example, run a local script to query APIs and output the string—adaptable for any ticker.
Script Functionality Breakdown
Inputs: Custom data string (parsed for levels/timestamp); toggles for short-term/previous/Vanna/stop loss; style options (colors, transparency).
Parsing: Extracts levels for the chart symbol; gets timestamp for "updated ago" display.
Drawing: Lines/labels for levels; boxes for gamma zones/implied move; clears old elements on updates.
Info Panel: Top-right summary with metrics (CP ratio, IV, distances, activity); emojis for quick status.
Alerts: Conditions for proximities, crosses, bounces (e.g., 0.5% bounce from Put Wall).
Performance: Uses vars for persistence; efficient for real-time.
This script is educational—test thoroughly. Not financial advice; past performance isn't indicative of future results. Feedback welcome via TradingView comments.

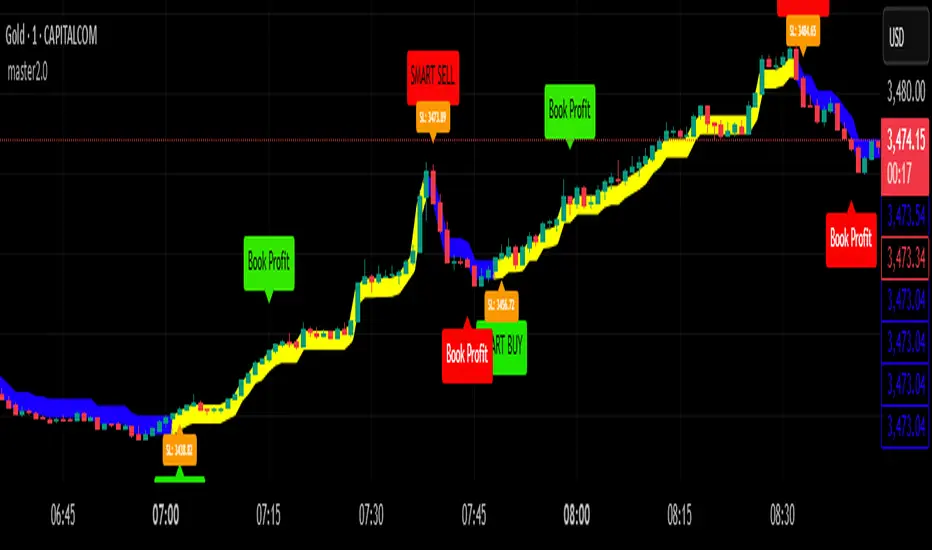
master2.0 ✅ How It Works
The Master 2.0 indicator is a custom-developed trend and signal tool based on a modified range filter algorithm, specifically designed for clarity, non-repainting signals, and actionable trade execution.
🔧 1. Custom Adaptive Range Filter (Original Logic)
At its core is a custom-built filter that adapts to price volatility. Unlike standard MAs or public-domain range indicators, this version:
(1) Uses a double-smooth EMA logic on absolute price changes.
(2)Multiplies the range by an Impact Factor, giving a dynamic width.
(3) Applies a custom filter algorithm that limits noise and locks on trend movement.
This logic was modified from the concept of range-based filters, but entirely re-engineered to serve trend-following and TP triggering.
🟩 2. Visual Trend Zones (Upper/Lower Lines)
The filtered value generates two dynamic lines:
(1)One above the filter
(2)One below the filter
These create a color-filled “trend tunnel”, making it easy to identify:
(3)🔵 Uptrend (blue fill)
(4)🔴 Downtrend (red fill)
(5)🟡 Sideways market (no fill or neutral color)
These visual cues allow instant identification of market direction without reading complex data
📈 3. Smart Buy/Sell Signals (Confirmed, Non-Repainting ✅)
(1)🚀 Smart Buy is triggered when a confirmed uptrend begins (filter shifts upward with a
new confirmation).
(2)🔻 Smart Sell appears at the start of a confirmed downtrend.
(3)Sideways filters out choppy signals, reducing whipsaws.
✅ All signals are confirmed only after the candle closes (barstate.isconfirmed is used), meaning:
🔒 No repainting or false previews — 100% reliable on live charting.
💰 4. Take Profit System (Unique Utility)
This indicator tracks the entry price after a signal, and auto-detects when a Take Profit level
(in pips) is reached.
(1)💰 Book Profit alert is triggered above/below the candle.
(2)Helps secure gains without relying on external bots or platforms.
🔔 5. Real-Time Alerts Included
All alerts are built-in for automation:
(1)🚀 Smart Buy
(2)🔻 Smart Sell
(3)💰 Book Profit (Buy/Sell)
Trade Size Calculator By Skapez Trade Size Calculator By Skapez — ARM it, Drag & Trade!
A simple, position-sizing calculator for easy trader sizing.
It plots Entry / Stop / TP lines, sizes your trade to a fixed % risk (e.g., 2%), calculates leverage, and shows clean labels (Risk $, TP $, Position $, Leverage ×). You can ARM a setup, drag the lines to fine-tune, and (optionally) trigger alerts for webhooks.
What it does:
Fixed-fractional risk : sizes position so SL equals your chosen % of account (e.g., 2%).
Leverage cap & lot rounding : respects your max leverage and exchange lot step.
Drag-to-edit : move Entry/Stop; TP and sizing update automatically.
Swing-stop helper (optional): snap SL to recent swing low/high or nearest pivot. (Auto stop loss finder)
Valid-until window: auto-expires stale setups (e.g., after 120 minutes).
Alerts-ready: add your own JSON in the alert to send to a bot/webhook.
Quick start (60 seconds)
Add to chart and open Settings.
In Risk, set:
Account Balance (USD) and Risk % (e.g., 2.0).
Side (Long/Short).
In Levels:
Put an Entry price (or leave 0 to use current price when you ARM).
Choose Stop: type it manually or toggle Swing stop helper.
Pick your Target R multiple (e.g., 3.0 for 3:1).
In Leverage, set:
Leverage Cap (e.g., 10×) and Min/Step Size (e.g., 0.001 BTC).
Toggle ARM on. Three lines appear. Drag the blue/red lines if needed; the green TP and all numbers update.
Tip: Pin the indicator to the Right Price Scale (format icon → “Pin to scale”) so everything lines up perfectly.
On-chart visuals
Blue = Entry (label shows Position $ and Leverage × to the far right).
Red = Stop (label shows Risk $).
Green = TP (label shows TP P&L $).
Works on any symbol/timeframe; prices are rounded to the symbol’s tick size.
That’s it—arm, drag, and go.

Autoback Grid Lab [trade_lexx]Autoback Grid Lab: Your personal laboratory for optimizing grid strategies.
Introduction
First of all, it is important to understand that Autoback Grid Lab is a powerful professional tool for backtesting and optimization, created specifically for traders using both grid strategies and regular take profit with stop loss.
The main purpose of this script is to save you weeks and months of manual testing and parameter selection. Instead of manually testing one combination of settings after another, Autoback Grid Lab automatically tests thousands of unique strategies on historical data, providing you with a comprehensive report on the most profitable and, more importantly, sustainable ones.
If you want to find mathematically sound, most effective settings for your grid strategy on a specific asset and timeframe, then this tool was created for you.
Key Features
My tool has functionality that transforms the process of finding the perfect strategy from a routine into an exciting exploration.
🧪 Mass testing of thousands of combinations
The script is able to systematically generate and run a huge number of unique combinations of parameters through the built-in simulator. You set the ranges, and the indicator does all the work, testing all possible options for the following grid settings:
* Number of safety orders (SO Count)
* Grid step (SO Step)
* Step Multiplier (SO Multiplier) for building nonlinear grids
* Martingale for controlling the volume of subsequent orders
* Take Profit (%)
* Stop Loss (%), with the possibility of calculating both from the entry point and from the dynamic breakeven line
* The volume of the base order (Volume BO) as a percentage of the deposit
🏆 Unique `FinalScore` rating system
Sorting strategies by net profit alone is a direct path to self—deception and choosing strategies that are "tailored" to history and will inevitably fail in real trading. To solve this problem, we have developed FinalScore, a comprehensive assessment of the sustainability and quality of the strategy.
How does it work?
FinalScore analyzes each combination not one by one, but by nine key performance metrics at once, including Net Profit, Drawdown, Profit Factor, WinRate, Sharpe coefficients, Sortino, Squid and Omega. Each of these indicators is normalized, that is, reduced to a single scale. Then, to test the strategy for strength, the system performs 30 iterations, each time assigning random weights to these 9 metrics. A strategy gets a high FinalScore only if it shows consistently high results under different evaluation criteria. This proves her reliability and reduces the likelihood that her success was an accident.
📈 Realistic backtesting engine
The test results are meaningless if they do not take into account the actual trading conditions. Our simulator simulates real trading as accurately as possible, taking into account:
* Leverage: Calculation of the required margin to open and hold positions.
* Commission: A percentage commission is charged each time an order is opened and closed.
* Slippage: The order execution price is adjusted by a set percentage to simulate real market conditions.
* Liquidation model: This is one of the most important functions. The script continuously monitors the equity of the account (capital + unrealized P&L). If equity falls below the level of the supporting margin (calculated from the current value of the position), the simulator forcibly closes the position, as it would happen on a real exchange. This eliminates unrealistic scenarios where the strategy survives after a huge drawdown.
🔌 Integration with external signals
The indicator operates in two modes:
1. `No Signal': Standard mode. The trading cycle starts immediately as soon as the previous one has been closed. Ideal for testing the "pure" mechanics of the grid.
2. `External Signal`: In this mode, a new trading cycle will start only when a signal is received from an external source. You can connect any other indicator (such as the RSI, MACD, or your own strategy) to the script and use it as a trigger to log in. This allows you to combine the power of a grid strategy with your own entry points.
📊 Interactive and informative results panel
Upon completion of the calculations, a detailed table with the TOP N best strategies appears on the screen, sorted according to your chosen criterion. For each strategy in the rating, you will see not only the key metrics (Profit, Drawdown, duration of transactions), but also all the parameters that led to this result. You can immediately take these settings and apply them in your trading.
Application Options: How To Solve Your Problems
Autoback Grid Lab is a flexible tool that can be adapted to solve various tasks, from complete grid optimization to fine—tuning existing strategies. Here are some key scenarios for its use:
1. Complete Optimization Of The Grid Strategy
This is the basic and most powerful mode of use. You can find the most efficient grid configuration for any asset from scratch.
* How to use: Set wide ranges for all key grid parameters ('SO Count`, SO Step, SO Multiplier, Martingale, TP, etc.).
* In the `No Signal` mode: You will find the most stable grid configuration that works as an independent, constantly active strategy, regardless of which-or entrance indicators.
* In the `External Signal` mode: You can connect your favorite indicator for input (for example, RSI, MACD or a complex author's script) and find the optimal grid parameters that best complement your input signals. This allows you to turn a simple signaling strategy into a full-fledged grid system.
2. Selecting the Optimal Take Profit and Stop Loss for Your Strategy
Do you already have an entry strategy, but you are not sure where it is best to put Take Profit and Stop Loss? Autoback Grid Lab can solve this problem as well.
* How to use:
1. Disable optimization of all grid parameters (uncheck SO Count, SO Step, Martingale, etc.). Set the Min value for SO Count to 0.
2. Set the ranges for iteration only for 'Take Profit` and `Stop Loss'.
3. Turn on the External Signal mode and connect your indicator with input signals.
* Result: The script will run your historical entry signals with hundreds of different TP and SL combinations and show you which stop order levels bring maximum profit with minimal risk specifically for your entry points.
3. Building a Secure Network with Risk Management
Many traders are afraid of grid strategies because of the risk of large drawdowns. With the help of the optimizer, you can purposefully find the parameters for such a grid, which includes mandatory risk management through Stop Loss.
* How to use: Enable and set the range for Stop Loss, along with other grid parameters. Don't forget to test both types of SL calculations (`From entry point` and `From breakeven line`) to determine which one works more efficiently.
* Result: You will find balanced strategies in which the grid parameters (number of orders, martingale) and the Stop Loss level are selected in such a way as to maximize profits without going beyond the acceptable risk level for you.
How To Use The Indicator (Step-By-Step Guide)
Working with the Autoback Grid Lab is a sequential process consisting of four main steps: from initial setup to analysis of the finished results. Follow this guide to get the most out of the tool.
Step 1: Initial Setup
1. Add the indicator to the chart of your chosen asset and timeframe.
2. Open the script settings. The first thing you should pay attention to is the ⚙️ Optimization Settings ⚙️ group.
3. Set the `Bars Count'. This parameter determines how much historical data will be used for testing.
* Important: The more bars you specify, the more statistically reliable the backtest results will be. We recommend using the maximum available value (25,000) to test strategies at different market phases.
* Consider: The indicator performs all calculations on the last historical bar. After applying the TradingView settings, it will take some time to load all the specified bars. The results table will appear only after the data is fully loaded. Don't worry if it doesn't appear instantly. And if an error occurs, simply switch the number of combinations to 990 and back to 1000 until the table appears.
Step 2: Optimization Configuration
At this stage, you define the "universe" of parameters that our algorithm will explore.
1. Set the search ranges (🛠 Optimization Parameters 🛠 group).
For each grid parameter that you want to optimize (for example, SO Count or `Take Profit'), you must specify three values:
* Min: The minimum value of the range.
* Max: The maximum value of the range.
* Step: The step with which the values from Min to Max will be traversed.
*Example:* If you set Min=5, Max=10, and Step=1 for SO Count, the script will test strategies with 5, 6, 7, 8, 9, and 10 safety orders.
* Tip for users: To get the first results quickly, start with a larger step (for example, TP from 0.5% to 2.5% in 0.5 increments instead of 0.1). After you identify the most promising areas, you can perform a deeper analysis by expanding the ranges around these values.
2. Set Up Money Management (Group `💰 Money Management Settings 💰`).
Fill in these fields with the values that best match your actual trading conditions. This is critically important for obtaining reliable results.
* Capital: Your initial deposit.
* Leverage: Leverage.
* Commission (%): Your trading commission as a percentage.
* Slippage (%): Expected slippage.
* Liquidation Level (%): The level of the supporting margin (MMR in %). For example, for Binance Futures, this value is usually between 0.4% and 2.5%, depending on the asset and position size. Specify this value for your exchange.
3. Select the Sorting Criterion and the Direction (Group `⚙️ Optimization Settings ⚙️').
* `Sort by': Specify the main criteria by which the best strategies will be selected and sorted. I strongly recommend using finalScore to find the most balanced and sustainable strategies.
* `Direction': Choose which trades to test: Long, Short or Both.
Step 3: Start Testing and Work with "Parts"
The total number of unique combinations generated based on your ranges can reach tens of millions. TradingView has technical limitations on the number of calculations that the script can perform at a time. To get around this, I implemented a "Parts" system.
1. What are `Part` and `Combinations in Part'?
* `Combinations in Part': This is the number of backtests that the script performs in one run (1000 by default).
* `Part`: This is the number of the "portion" of combinations that you want to test.
2. How does it work in practice?
* After you have everything set up, leave Part:1 and wait for the results table to appear. You will see the TOP N best strategies from the first thousand tested.
* Analyze them. Then, to check the next thousand combinations, just change the Part to 2 in the settings and click OK. The script will run a test for the next batch.
* Repeat this process by increasing the Part number (`3`, 4, 5...), until you reach the last available part.
* Where can I see the total number of parts? In the information row below the results table, you will find Total parts. This will help you figure out how many more tests are left to run.
Step 4: Analyze the Results in the Table
The results table is your main decision—making tool. It displays the best strategies found, sorted by the criteria you have chosen.
1. Study the performance metrics:
* Rating: Position in the rating.
* Profit %: Net profit as a percentage of the initial capital.
* Drawdown%: The maximum drawdown of the deposit for the entire test period.
* Max Length: The maximum duration of one transaction in days, hours and minutes.
* Trades: The total number of completed trades.
2. Examine the winning parameters:
* To the right of the performance metrics are columns showing the exact settings that led to this result ('SO Count`, SO Step, TP (%), etc.).
3. How to choose the best strategy?
* Don't chase after the maximum profit! The strategy with the highest profit often has the highest drawdown, which makes it extremely risky.
* Seek a balance. The ideal strategy is a compromise between high profitability, low drawdown (Drawdown) and the maximum length of trades acceptable to you (Max Length).
* finalScore was created to find this balance. Trust him — he often highlights not the most profitable, but the most stable and reliable options.
Detailed Description Of The Settings
This section serves as a complete reference for each parameter available in the script settings. The parameters are grouped in the same way as in the indicator interface for your convenience.
Group: ⚙️ Optimization Settings ⚙️
The main parameters governing the testing process are collected here.
* `Enable Optimizer': The main switch. Activates or deactivates all backtesting functionality.
* `Direction': Determines which way trades will be opened during the simulation.
* Long: Shopping only.
* Short: Sales only.
* Both: Testing in both directions. Important: This mode only works in conjunction with an External Signal, as the script needs an external signal to determine the direction for each specific transaction.
* `Signal Mode`: Controls the conditions for starting a new trading cycle (opening a base order).
* No Signal: A new cycle starts immediately after the previous one is completed. This mode is used to test "pure" grid mechanics without reference to market conditions.
* External Signal: A new cycle begins only when a signal is received from an external indicator connected via the Signal field.
* `Signal': A field for connecting an external signal source (works only in the `External Signal` mode). You can select any other indicator on the chart.
* For Long** trades, the signal is considered received if the value of the external indicator ** is greater than 0.
* For Short** trades, the signal is considered received if the value of the external indicator ** is less than 0.
* `Bars Count': Sets the depth of the history in the bars for the backtest. The maximum value (25000) provides the most reliable results.
* `Sort by`: A key criterion for selecting and ranking the best strategies in the final table.
* FinalScore: Recommended mode. A comprehensive assessment that takes into account 9 metrics to find the most balanced and sustainable strategies.
* Profit: Sort by net profit.
* Drawdown: Sort by minimum drawdown.
* Max Length: Sort by the minimum length of the longest transaction.
* `Combinations Count': Indicates how many of the best strategies (from 1 to 50) will be displayed in the results table.
* `Close last trade`: If this option is enabled, any active trade will be forcibly closed at the closing price of the last historical bar. For grid strategies, it is recommended to always enable this option in order to get the correct calculation of the final profit and eliminate grid strategies that have been stuck for a long time.
Group: 💰 Money Management Settings 💰
The parameters in this group determine the financial conditions of the simulation. Specify values that are as close as possible to your actual values in order to get reliable results.
* `Capital': The initial deposit amount for the simulation.
* `Leverage`: The leverage used to calculate the margin.
* `Slippage` (%): Simulates the difference between the expected and actual order execution price. The specified percentage will be applied to each transaction.
* `Commission` (%): The trading commission of your exchange as a percentage. It is charged at the execution of each order (both at opening and closing).
* `Liquidation Level' (%): Maintenance Margin Ratio. This is a critical parameter for a realistic test. Liquidation in the simulator occurs if the Equity of the account (Capital + Unrealized P&L) falls below the level of the supporting margin.
Group: 🛠 Optimization Parameters 🛠
This is the "heart" of the optimizer, where you set ranges for iterating through the grid parameters.
* `Part`: The portion number of the combinations to be tested. Start with 1, and then increment (`2`, 3, ...) sequentially to check all generated strategies.
* `Combinations in Part': The number of backtests performed at a time (in one "Part"). Increasing the value may speed up the process, but it may cause the script to error due to platform limitations. If an error occurs, it is recommended to switch to the step below and back.
Three fields are available for each of the following parameters (`SO Count`, SO Step, SO Multiplier, etc.):
* `Min`: Minimum value for testing.
* `Max': The maximum value for testing.
* `Step`: The step with which the values in the range from Min to Max will be iterated over.
There is also a checkbox for each parameter. If it is enabled, the parameter will be optimized in the specified range. If disabled, only one value specified in the Min field will be used for all tests.
* 'Stop Loss': In addition to the standard settings Min, Max, Step, it has an additional parameter:
* `Type`: Defines how the stop loss price is calculated.
* From entry point: The SL level is calculated once from the entry price (base order price).
* From breakeven line: The SL level is dynamically recalculated from the average position price after each new safety order is executed.
Group: ⚡️Filters⚡️
Filters allow you to filter out those results from the final table that do not meet your minimum requirements.
For each filter (`Max Profit`, Min Drawdown, `Min Trade Length`), you can:
1. Turn it on or off using the checkbox.
2. Select the comparison condition: Greater (More) or Less (Less).
3. Set a threshold value.
*Example:* If you set Less and 20 for the Min Drawdown filter, only those strategies with a maximum drawdown of less than 20% will be included in the final table.
Group: 🎨 Visual Settings 🎨
Here you can customize the appearance of the results table.
* `Position': Selects the position of the table on the screen (for example, Bottom Left — bottom left).
* `Font Size': The size of the text in the table.
* `Header Background / Data Background`: Background colors for the header and data cells.
* `Header Font Color / Data Font Color`: Text colors for the header and data cells.
Important Notes and Limitations
So that you can use the Autoback Grid Lab as efficiently and consciously as possible, please familiarize yourself with the following key features of its work.
1. It is a Tool for Analysis, not for Signals
It is extremely important to understand that this script does not generate trading signals in real time. Its sole purpose is to conduct in—depth research (**backtesting**) on historical data.
* The results you see in the table are a report on how a particular strategy would have worked in the past.
* The script does not provide alerts and does not draw entry/exit points on the chart for the current market situation.
* Your task is to take the best sets of parameters found during optimization and use them in your real trading, for example, when setting up a trading bot or in a manual trading system.
2. Features Of Calculations (This is not a "Repainting")
You will notice that the results table appears and is updated only once — when all historical bars on the chart are loaded. It does not change in real time with each tick of the price.
This is correct and intentional behavior.:
* To test thousands, and sometimes millions of combinations, the script needs to perform a huge amount of calculations. In the Pine Script™ environment, it is technically possible to do this only once, at the very last bar in history.
* The script does not show false historical signals, which then disappear or change. It provides a static report on the results of the simulation, which remains unchanged for a specific historical period.
3. Past Results do not Guarantee Future Results.
This is the golden rule of trading, and it fully applies to the results of backtesting. Successful strategy performance in the past is not a guarantee that it will be as profitable in the future. Market conditions, volatility and trends are constantly changing.
My tool, especially when sorting by finalScore, is aimed at finding statistically stable and reliable strategies to increase the likelihood of their success in the future. However, it is a tool for managing probabilities, not a crystal ball for predicting the future. Always use proper risk management.
4. Dependence on the Quality and Depth of the Story
The reliability of the results directly depends on the quantity and quality of the historical data on which the test was conducted.
* Always strive to use the maximum number of bars available (`Bars Count: 25,000`) so that your strategy is tested on different market cycles (rise, fall, flat).
* The results obtained on data for one month may differ dramatically from the results obtained on data for two years. The longer the testing period, the higher the confidence in the parameters found.
Conclusion
The Autoback Grid Lab is your personal research laboratory, designed to replace intuitive guesses and endless manual selection of settings with a systematic, data—driven approach. Experiment with different assets, timeframes, and settings ranges to find the unique combinations that best suit your trading style.

Two-Phase Adaptive System | AlphaNattTwo-Phase Adaptive System (TPAS) - Professional Grade Crypto Allocation Framework
A groundbreaking dual-strategy system that revolutionizes portfolio management through dynamic performance-based strategy selection
═══════ REVOLUTIONARY APPROACH ═══════
This indicator represents an entirely original methodology in systematic trading - a true first-of-its-kind approach that fundamentally reimagines how allocation strategies should operate. Unlike any other system available on TradingView, TPAS employs a proprietary dual-engine architecture that continuously evaluates two independent trading methodologies and dynamically allocates capital based on their relative performance dynamics.
What Makes This Absolutely Unique:
Performance-Based Strategy Selection: Instead of using static rules or market conditions to choose strategies, TPAS analyzes the real-time equity curves of both systems
Dual-Engine Architecture: Two complete trading systems run simultaneously, each with distinct market philosophies and risk profiles
Adaptive Switching Mechanism: Proprietary algorithm that determines optimal transition points between strategies
No comparable system exists that combines performance-relative switching with dual independent strategy engines
THE TWO SYSTEMS
The innovation lies not in the individual strategies, but in the revolutionary framework that allows them to work in concert, automatically selecting the optimal approach for current market dynamics
1. Tactical System (Defensive Core)
Multi-layered market regime analysis
Complex trend indicator synthesis from multiple timeframes
Defensive positioning with strict cash management protocols
Prioritizes capital preservation during uncertain conditions
Incorporates over 20 proprietary market indicators
2. Momentum System (Growth Engine)
Trend-following methodology optimized for sustained moves
Statistical deviation analysis for entry/exit timing
Aggressive positioning during confirmed uptrends
Designed to capture major market movements
Streamlined signal generation for rapid response
DYNAMIC ALLOCATION MECHANISM
The system's crown jewel is its adaptive selection algorithm:
Continuously calculates equity curves for both strategies
Computes performance ratio between systems
Applies proprietary smoothing algorithms to identify regime changes
Automatically switches to the outperforming strategy
Maintains position continuity during transitions
ASSET UNIVERSE & ROTATION
Bitcoin (BTC): The market beta and defensive allocation
Ethereum (ETH): Smart contract ecosystem exposure
Solana (SOL): High-performance blockchain allocation
Cash Position: Strategic capital preservation when conditions deteriorate
The system employs sophisticated relative strength analysis between asset pairs (BTC/ETH, ETH/SOL, BTC/SOL) to determine optimal positioning within each strategy framework.
VISUAL INTELLIGENCE
Dual-layer equity curve with enhanced glow visualization
Real-time system state indicator showing active strategy
Portfolio allocation display with current positions
Comprehensive metrics dashboard (Sharpe, Sortino, Omega, Maximum Drawdown)
Bitcoin buy-and-hold benchmark for performance comparison
Color-coded position indicators for instant visual feedback
RISK MANAGEMENT PHILOSOPHY
The system operates on the principle that avoiding losses is more important than capturing gains . Both engines incorporate independent risk controls, position limits, and systematic cash allocation protocols that activate during adverse conditions.
═══════ CRITICAL DISCLAIMERS ═══════
BACKTEST LIMITATIONS:
Past performance does NOT indicate future results
Historical backtests assume perfect execution without slippage
Real-world trading involves costs, delays, and market impact
Cryptocurrency markets have evolved significantly - past patterns may not repeat
Backtested results often overstate actual achievable returns
System performance during unprecedented market conditions is unknown
Important Operational Notes:
This is a signal indicator only - NOT an automated trading bot
Requires manual trade execution based on generated signals
Designed exclusively for daily timeframe analysis
Signals fire at daily close - not intraday
Best suited for position traders and long-term investors
Not appropriate for leverage trading or short-term speculation
WHO THIS IS FOR
Sophisticated traders seeking systematic crypto exposure
Investors who understand the importance of adaptive strategies
Those who prioritize risk-adjusted returns over raw performance
Users who value transparency and detailed performance metrics
Traders comfortable with daily rebalancing requirements
WHO THIS IS NOT FOR
Day traders or scalpers
Those seeking guaranteed returns
Traders unable to execute daily rebalancing
Anyone expecting fully automated trading
CONFIGURATION PARAMETERS
While the core algorithm is proprietary and fixed, users can adjust:
Backtest start date
Strategy selection sensitivity (advanced users only)
Various display options
ACCESS & SUPPORT
This is an invite-only indicator due to its sophisticated nature and computational requirements. For access requests, please send a private message
Final Note:
This system represents months of research, development, and optimization. It is not a "get rich quick" solution but rather a sophisticated framework for those who understand that successful trading requires patience, discipline, and proper risk management.
---
Version 1.0 | Created by AlphaNatt | All Rights Reserved
Not financial advice
