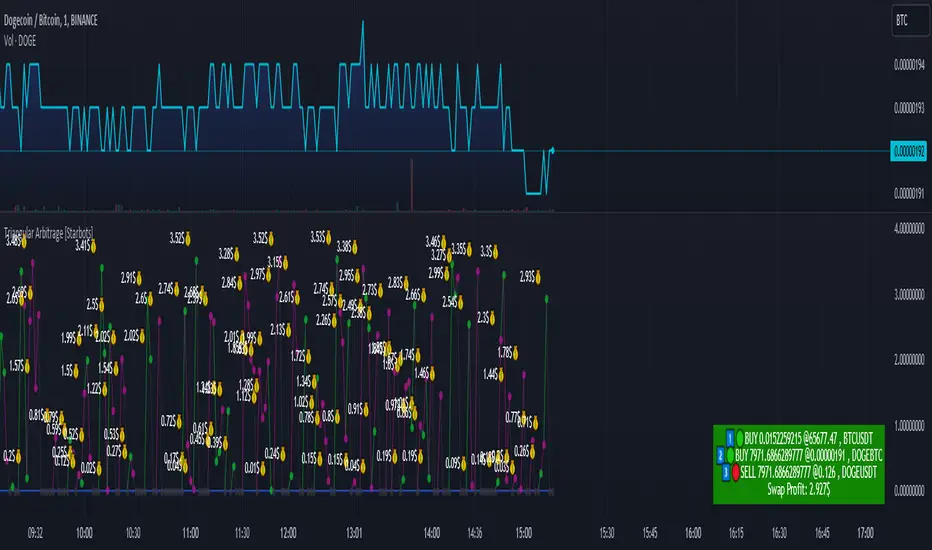
Triangular Arbitrage [Starbots]Triangular arbitrage in crypto refers to a trading strategy that exploits price discrepancies between three different cryptocurrencies or currency pairs on the same exchange.
The idea is to make a series of trades that ultimately result in a profit without the risk typically involved in trading. It works by taking advantage of the inefficiencies in the pricing of cryptocurrency pairs.
Here’s how it works:
Identify the Discrepancy: A trader finds a pricing mismatch between three cryptocurrencies. For example, they identify that the exchange rates between BTC/ETH, ETH/USDT, and BTC/USDT pairs are not aligned in a way that satisfies arbitrage-free conditions.
Three Trades:
Trade 1: Start with one cryptocurrency, say USDT (Tether).
Trade 2: Use USDT to buy ETH.
Trade 3: Use ETH to buy BTC.
Final Trade: Finally, convert the BTC back into USDT.
Profit: If the exchange rates between these pairs are out of sync, the trader can end up with more USDT (or the initial cryptocurrency) than they started with. This is because the temporary price inefficiency allowed them to buy low and sell high across different pairs.
Example:
Initial position: You have 10,000 USDT.
Step 1: You buy ETH with USDT (at a rate of 1 ETH = 2000 USDT), getting 5 ETH.
Step 2: You buy BTC with ETH (at a rate of 1 BTC = 2.5 ETH), getting 2 BTC.
Step 3: You sell BTC back for USDT (at a rate of 1 BTC = 5200 USDT), getting 10,400 USDT.
This results in a profit of 400 USDT after completing the cycle, assuming no fees or slippage.
Key Points:
Risk-Free (In Theory): In theory, triangular arbitrage is risk-free because you’re taking advantage of price discrepancies and not market trends.
High Speed Required: Since the inefficiencies in the crypto market are usually very short-lived, this strategy often requires bots or automated systems to execute trades quickly.
Fees and Slippage: In reality, exchange fees, trading volume, and slippage (the difference between the expected price and the actual execution price) can eat into profits and should be carefully considered.
Triangular arbitrage opportunities arise in crypto markets due to the high volatility and fragmentation across different trading pairs and exchanges.
________________________________________________________________
Recommended Binance pairs: DOGE/BTC, TRX/BTC, LINK/BTC, RUNE/BTC, FET/BTC, WIF/BTC,.. Make sure they have big daily volume when you swap them.
You typically have 30 seconds to 2 minutes to complete all three orders, but the main challenge is slippage, especially if the trading volume is low.
<>How to use indicator?
For example, open the DOGE/BTC chart on Binance and set the timeframe to 30 seconds or 1 minute.
In the first input, enter DOGE/USDT, the symbol that's on the left of your slash (DOGE/BTC), and in the second, enter BTC/USDT, the symbol that's on the right of your slash (DOGE/BTC).
Next, select the investment and commissions option.
Indicator will automatically calculate the discrepancies between these three different cryptocurrency pairs and show you when it's profitable to trade it on the chart.
Follow the indicator's suggested orders and capitalize on the price discrepancies between the three cryptocurrencies on the same exchange. This is how Triangular Arbitrage work.
Cerca negli script per "bot"
Pivot Points LIVE [CHE]Title:
Pivot Points LIVE Indicator
Subtitle:
Advanced Pivot Point Analysis for Real-Time Trading
Presented by:
Chervolino
Date:
September 24, 2024
Introduction
What are Pivot Points?
Definition:
Pivot Points are technical analysis indicators used to determine potential support and resistance levels in financial markets.
Purpose:
They help traders identify possible price reversal points and make informed trading decisions.
Overview of Pivot Points LIVE :
A comprehensive indicator designed for real-time pivot point analysis.
Offers advanced features for enhanced trading strategies.
Key Features
Pivot Points LIVE Includes:
Dynamic Pivot Highs and Lows:
Automatically detects and plots pivot high (HH, LH) and pivot low (HL, LL) points.
Customizable Visualization:
Multiple options to display markers, price labels, and support/resistance levels.
Fractal Breakouts:
Identifies and marks breakout and breakdown events with symbols.
Line Connection Modes:
Choose between "All Separate" or "Sequential" modes for connecting pivot points.
Pivot Extension Lines:
Extends lines from the latest pivot point to the current bar for trend analysis.
Alerts:
Configurable alerts for breakout and breakdown events.
Inputs and Configuration
Grouping Inputs for Easy Customization:
Source / Length Left / Length Right:
Pivot High Source: High price by default.
Pivot Low Source: Low price by default.
Left and Right Lengths: Define the number of bars to the left and right for pivot detection.
Colors: Customizable colors for pivot high and low markers.
Options:
Display Settings:
Show HH, LL, LH, HL markers and price labels.
Display support/resistance level extensions.
Option to show levels as a fractal chaos channel.
Enable fractal breakout/down symbols.
Line Connection Mode:
Choose between "All Separate" or "Sequential" for connecting lines.
Line Management:
Set maximum number of lines to display.
Customize line colors, widths, and styles.
Pivot Extension Line:
Visibility: Toggle the display of the last pivot extension line.
Customization: Colors, styles, and width for extension lines.
How It Works - Calculating Pivot Points
Pivot High and Pivot Low Detection:
Pivot High (PH):
Identified when a high price is higher than a specified number of bars to its left and right.
Pivot Low (PL):
Identified when a low price is lower than a specified number of bars to its left and right.
Higher Highs, Lower Highs, Higher Lows, Lower Lows:
Higher High (HH): Current PH is higher than the previous PH.
Lower High (LH): Current PH is lower than the previous PH.
Higher Low (HL): Current PL is higher than the previous PL.
Lower Low (LL): Current PL is lower than the previous PL.
Visual Elements
Markers and Labels:
Shapes:
HH and LH: Downward triangles above the bar.
HL and LL: Upward triangles below the bar.
Labels:
Optionally display the price levels of HH, LH, HL, and LL on the chart.
Support and Resistance Levels:
Extensions:
Lines extending from pivot points to indicate potential support and resistance zones.
Chaos Channels:
Display levels as a fractal chaos channel for enhanced trend analysis.
Fractal Breakout Symbols:
Buy Signals: Upward triangles below the bar.
Sell Signals: Downward triangles above the bar.
Slide 7: Line Connection Modes
All Separate Mode:
Description:
Connects pivot highs with pivot highs and pivot lows with pivot lows separately.
Use Case:
Ideal for traders who want to analyze highs and lows independently.
Sequential Mode:
Description:
Connects all pivot points in the order they occur, regardless of being high or low.
Use Case:
Suitable for identifying overall trend direction and momentum.
Pivot Extension Lines
Purpose:
Trend Continuation:
Visualize the continuation of the latest pivot point's price level.
Customization:
Colors:
Differentiate between bullish and bearish extensions.
Styles:
Solid, dashed, or dotted lines based on user preference.
Width:
Adjustable line thickness for better visibility.
Dynamic Updates:
The extension line updates in real-time as new bars form, providing ongoing trend insights.
Alerts and Notifications
Configurable Alerts:
Fractal Break Arrow:
Triggered when a breakout or breakdown occurs.
Long and Short Signals:
Specific alerts for bullish breakouts (Long) and bearish breakdowns (Short).
Benefits:
Timely Notifications:
Stay informed of critical market movements without constant monitoring.
Automated Trading Strategies:
Integrate with trading bots or automated systems for executing trades based on alerts.
Customization and Optimization
User-Friendly Inputs:
Adjustable Parameters:
Tailor pivot detection sensitivity with left and right lengths.
Color and Style Settings:
Match the indicator aesthetics to personal or platform preferences.
Line Management:
Maximum Lines Displayed:
Prevent chart clutter by limiting the number of lines.
Dynamic Line Handling:
Automatically manage and delete old lines to maintain chart clarity.
Flexibility:
Adapt to Different Markets:
Suitable for various financial instruments including stocks, forex, and cryptocurrencies.
Scalability:
Efficiently handles up to 500 labels and 100 lines for comprehensive analysis.
Practical Use Cases
Identifying Key Support and Resistance:
Entry and Exit Points:
Use pivot levels to determine optimal trade entry and exit points.
Trend Confirmation:
Validate market trends through the connection of pivot points.
Breakout and Breakdown Strategies:
Trading Breakouts:
Enter long positions when price breaks above pivot highs.
Trading Breakdowns:
Enter short positions when price breaks below pivot lows.
Risk Management:
Setting Stop-Loss and Take-Profit Levels:
Utilize pivot levels to place strategic stop-loss and take-profit orders.
Slide 12: Benefits for Traders
Real-Time Analysis:
Provides up-to-date pivot points for timely decision-making.
Enhanced Visualization:
Clear markers and lines improve chart readability and analysis efficiency.
Customizable and Flexible:
Adapt the indicator to fit various trading styles and strategies.
Automated Alerts:
Stay ahead with instant notifications on key market events.
Comprehensive Toolset:
Combines pivot points with fractal analysis for deeper market insights.
Conclusion
Pivot Points LIVE is a robust and versatile indicator designed to enhance your trading strategy through real-time pivot point analysis. With its advanced features, customizable settings, and automated alerts, it equips traders with the tools needed to identify key market levels, execute timely trades, and manage risks effectively.
Ready to Elevate Your Trading?
Explore Pivot Points LIVE and integrate it into your trading toolkit today!
Q&A
Questions?
Feel free to ask any questions or request further demonstrations of the Pivot Points LIVE indicator.

Average True Range with Price MAATR with Price Moving Average Indicator
This custom indicator combines the Average True Range (ATR) with a Price Moving Average (MA) to help traders analyze market volatility in percent to the price.
Key Components:
Average True Range (ATR)
Price Moving Average (MA)
ATR/Price in Percent
ATR/Price in Percent
Purpose: This ratio helps traders understand the relative size of the ATR compared to the current price, providing a clearer sense of how significant the volatility is in proportion to the price level.
Calculation: ATR is divided by the current closing price and multiplied by 100 to express it as a percentage. This makes it easier to compare volatility across assets with different price ranges.
Plot: This is plotted as a percentage, making it easier to gauge whether the volatility is proportionally high or low compared to the asset's price.
Usage:
This indicator is designed to help identify the most volatile tokens, making it ideal for configuring a Grid Bot to maximize profit. By focusing on high-volatility assets, traders can capitalize on larger price swings within the grid, increasing the potential for more profitable trades.
Features:
Customizable Smoothing Method: Choose from RMA (Relative Moving Average), SMA (Simple Moving Average), EMA (Exponential Moving Average), or WMA (Weighted Moving Average) for both ATR and the Price Moving Average.
Dual Perspective: The indicator provides both volatility analysis (ATR) and trend analysis (Price MA) in a single view.
Proportional Volatility: The ATR/Price (%) ratio adds a layer of context by showing how volatile the asset is relative to its current price.

Enhanced Local Polynomial Regression [Yosiet]Local Polynomial Regression (LPR) is an advanced statistical method that offers a flexible approach to estimating the underlying trend in financial time series data.
The Mathematical Explanation
The core idea of LPR is to fit a polynomial of degree p at each point x using weighted least squares. The weight of each data point decreases with its distance from x, controlled by a kernel function and a bandwidth parameter.
The general form of the local polynomial estimator is:
β̂(x) = argmin Σ K((Xi - x) / h) (Yi - β0 - β1(Xi - x) - ... - βp(Xi - x)^p)^2
Where:
β̂(x) is the vector of estimated coefficients
K is the kernel function
h is the bandwidth
Xi and Yi are the predictor and response variables
p is the degree of the polynomial
Our implementation uses the Epanechnikov kernel:
K(u) = 3/4 * (1 - u^2) for |u| ≤ 1, 0 otherwise
The Implementation
This script implements LPR for the easier way to interpret its values with the following key components:
Input Parameters: Can adjust the lookback period, bandwidth, and polynomial degree.
Kernel Function: The Epanechnikov kernel is used for weighting.
LPR Function: Implements the core algorithm using matrix operations.
Signal Generation: Generates buy/sell signals based on crossovers of smoothed price and LPR results.
How to Use
Apply the indicator to your chart in TradingView.
Adjust the input parameters:
Lookback Period: Controls how many past bars are considered.
Bandwidth: Affects the smoothness of the regression line.
Polynomial Degree: Determines the complexity of the local fit.
Signal Smoothing Length: Adjusts the responsiveness of buy/sell signals.
Monitor buy/sell signals for potential trade entries.
Limitations
Sensitivity to Parameters: The choice of bandwidth and polynomial degree significantly impacts the results.
Lag: Like all trend-following indicators, LPR may lag behind rapid price movements.
Edge Effects: The indicator may be less reliable at the edges of the data (recent bars).
Recommendations
Parameter Optimization: Experiment with different lookback periods, bandwidths, and polynomial degrees to find the best fit for your trading style and timeframe.
Combine with Other Indicators: Use LPR in conjunction with momentum oscillators or volume indicators for confirmation.
Multiple Timeframes: Apply LPR on different timeframes to gain a more comprehensive view of the trend.
Avoid Overfitting: Be cautious of using high polynomial degrees, as they may lead to overfitting on historical data.
Consider Market Conditions: LPR works best in trending markets; be aware of its limitations in ranging or highly volatile conditions.
Backtest Thoroughly: Always backtest strategies based on LPR across different market conditions before live trading.
Conclusion
Local Polynomial Regression offers a sophisticated approach to trend analysis in financial markets. By providing a flexible, adaptive trend line, it can help traders identify potential entry and exit points with greater precision than traditional moving averages. However, like all technical indicators, it should be used as part of a comprehensive trading strategy that includes proper risk management and consideration of fundamental factors.
if you have an strategy or idea and need to make it real through an indicator or trading bot, you can DM or comment

Oster's Fair Economy (OFE)Overview:
Oster's Fair Economy (OFE) is a powerful tool designed to give traders and investors a comprehensive assessment of the fair value of major stock indices . Unlike conventional indicators that focus solely on technical analysis, OFE emphasizes economic metrics to offer a deeper understanding of the market's intrinsic value. By applying Oster's method (explained below), OFE determines the fundamental fair price of key indices, making it an invaluable tool for top-down analysis and market confirmation. It is particularly useful for swing trading on indices and as a top-down confirmation for individual stock trades.
Important Note:
OFE is designed for use with indices, not individual stocks : Stocks are often driven by their own fundamental factors, such as earnings, revenue, and dividend yields, which may not align with broad economic metrics. While OFE can sometimes provide insights into individual stocks, particularly those highly correlated with broader market trends, it is specifically intended for index analysis.
OFE is optimized for Weekly Candles (W ): OFE is most effective when used with weekly data, as it aligns with the longer-term outlook of economic analyses. While it can be used with smaller timeframes, weekly data is recommended for the most accurate insights.
Innovative Approach to Economic Analysis:
OFE integrates a unique combination of key economic metrics , including:
Gross National Product (GNP)
Consumer Price Index (CPI)
Unemployment Rate (UR)
Interest Rate (e.g., FED)
Nonfarm Payrolls (NFP)
Retail Sales (RS)
Industrial Production (IP)
Balance Of Trade (BOT)
Money Supply M2 (M2)
Consumer Confidence Index (CCI)
These metrics are tailored for 20 different markets : United States (US), Canada (CA), European Union (EU), Germany (DE), United Kingdom (GB), France (FR), Italy (IT), Switzerland (CH), Spain (ES), Australia (AU), New Zealand (NZ), Japan (JP), China (CN), Hong Kong (HK), South Korea (KR), India (IN), Russia (RU), Brazil (BR), Mexico (MX), and Saudi Arabia (SA).
This comprehensive set of data allows traders to gauge the potential for growth, inflation, and overall market conditions . OFE's weighting system reflects the importance of these metrics in determining the fair value of indices according to Oster's methodology .
How OFE Works:
OFE's calculation methodology is designed to provide insights into whether an index is fundamentally overvalued, undervalued, or trading at fair value by comparing its price dynamics with economic data. Here’s a step-by-step breakdown of how OFE works:
Economic Data Collection : OFE retrieves relevant economic data from the selected region, such as GDP, CPI, and interest rates. If specific market data is unavailable, OFE defaults to the US market as a fallback.
Normalization and Weighting : The collected economic metrics are normalized against historical trends to ensure that the data reflects both current levels and long-term averages. For example, GDP growth rates are normalized based on historical data, allowing for a comparison across different economic periods. Similarly, CPI and unemployment rates are adjusted to account for historical context, ensuring that high inflation or unemployment is appropriately weighed relative to past conditions. However, all other macroeconomic key figures are also processed in the same way.
Relating Economic Metrics to Price Dynamics : OFE calculates specific ratios by comparing the selected index’s price with the normalized economic data. These ratios, such as the GNP ratio, are then analyzed within the context of historical performance. The goal is to establish a relationship between the economic indicators and the index’s historical price behavior. For instance, if the GNP ratio is currently higher than historical norms, it could suggest that the index is overvalued relative to the economy’s actual productivity.
Fair Value Calculation : Based on the derived ratios and their historical correlations with index prices, OFE computes a fair value for the index. This calculation integrates multiple economic indicators, each weighted according to its perceived importance in influencing the index. For example, in a high-growth environment, GDP and industrial production might carry more weight, whereas in a recession, unemployment and interest rates could become more influential. The resulting fair value reflects the index's price adjusted for the current economic environment.
Price Comparison : The calculated fair value is then compared to the current market price of the index. If the market price significantly deviates from the fair value, it suggests that the index is either overvalued or undervalued. For example, if the fair value of the S&P 500 is calculated to be 10% lower than its current market price, OFE would indicate that the index might be overvalued, potentially signaling a market correction. The fair price line basically acts as a kind of magnet that keeps attracting the index price. This is because, in the longer term, the broad market is always guided by the economic health of the country in concerned.
Market Dynamics Consideration : By adjusting the "Strictness" level in OFE, users can control how sensitive the fair value calculation is to economic fundamentals. A higher strictness level would highlight discrepancies between the fair value and the market price more aggressively, suggesting a higher likelihood of market mispricing. Conversely, a lower strictness level allows for greater flexibility, acknowledging that markets can sometimes deviate from fundamental values without immediate correction.
Customizable Parameters for Tailored Analysis:
OFE offers extensive customization options to align with your specific investment strategy. Users can:
Select or deselect economic metrics for inclusion.
Adjust the weighting of each metric to reflect its importance in their analysis.
Fine-tune the strictness of the valuation process (as explained above).
Additionally, users can compare different indices with various macroeconomic data sets . For example, you might select the DAX index and apply US economic data to see how the index would perform if driven by US market fundamentals. This feature enables a highly tailored and region-specific analysis, empowering traders to align OFE with their individual perspectives and market outlooks.
Interpretation:
If the calculated fair price is above the current index value, the index is considered fundamentally undervalued, indicating potential for price increases. Conversely, if the fair price is below the current index value, the index is seen as overvalued, suggesting potential risks or a possible correction. The fair price acts as a gravitational force, pulling the index toward its true economic value over time.
This over- or undervaluation can also serve as an overarching economic confirmation for stock trading . For example, it might be advantageous to buy individual stocks when the broader market is fundamentally undervalued, as the general upward potential of the market could support stock price increases. Conversely, selling or avoiding stocks when the broader market is overvalued could help mitigate potential risks, as the market may be primed for a correction.
Conclusion:
Oster's Fair Economy (OFE) bridges the gap between technical simplicity and the depth of macroeconomic analysis . By integrating complex economic metrics with user-friendly customization, OFE empowers traders and investors to assess the fair valuation of indices confidently . This tool is ideal for confirming market trends and gaining a broader understanding of the economic landscape, making it a valuable asset in any investment toolkit.

Support and Resistance Pivot Points/Lines [Mauserrifle]Support and Resistance Pivot Points/Lines by Mauserrifle. A personal take on drawing support and resistance pivot lines. This indicator was born as the core of bot strategies I am trying to build. I think this indicator with its feature called “Cooldown rounding” can be useful to others to manually scalp or analyze charts. I did not find other indicators to do the same so I hope you find it useful.
A summary of the features:
It will draw high/low pivot lines based on a maximum of eight higher timeframes
You can set up how many days the lines are valid and appear per timeframe. The default period days are based on a 2m chart strategy. Consider higher values for day charts.
The lines will be drawn from the moment when they are KNOWN, which helps analyzing historical charts. You can change this behavior to make them draw from the pivot (looking at future data on historic data)
The pivot point lines can be rounded by multiple methods: round, ceil/floor, roundn (decimal) and round_to_mintick. This general rounding feature is disabled by default because, in my opinion, a much more useful one can be used which I call “Cooldown rounding” described in the next point.
Cooldown rounding: Round lows and highs for a cooldown period to keep the previous pivot line instead of adding a new line when they match the rounded value within the cooldown period. The existing line will be extended. This feature is useful because it makes sure the initial line is added to the exact high/low pivot level but any future lines within the rounding will just extend the existing line. Consider using roundn on some intraday charts such as SPY 2m.
You can set a maximum minutes for the cooldown. The default is 3 years which is just based on some charting techniques for scalping 2m. It will just enable the cooldown rounding permanently on the intraday (due max bar limit) and with a limit on daily. Tweak it to your needs.
It is possible to always add new pivot lines when a new high is higher or low is lower compared to previous line. Thus ignoring the rounding logic. Consider disabling it on intraday charts such as SPY 2m.
NOTE:
Only configured timeframes EQUAL/ABOVE your chart timeframe will activate
The default period days are optimized for a 2m intraday trading strategy. Consider higher values for day charts.
Max lines rendered is set to 500
Line calculation is limited by the max bars of the chart and date range
Repainting may happen on intraday when for example using a 2m chart timeframe with pivots on 15m+ (as documented by tradingview). Rendered days 7+ will also cause repainting issues on 2m charts. See tradingview support docs: 43000478429. For scalping manually using already known lines this shouldn't be a problem I think but be aware!
The default settings have been set so every chart timeframe will show lines without further configuration.
Keep an eye on the data window how many lines are rendered. Make sure you never exceed 500. Anything above will cause earlier lines to disappear which could be a problem when you use it to analyze historical data.
I hope you find this useful!
DISCLAIMER
Trading is risky & most day traders lose money. This indicator is purely for informational & educational purposes only. Past performance does not guarantee future results.

Alligator + Fractals + Divergent & Squat Bars + Signal AlertsThe indicator includes Williams Alligator, Williams Fractals, Divergent Bars, Market Facilitation Index, Highest and Lowest Bars, maximum and minimum peak of Awesome Oscillator, and signal alerts based on Bill Williams' Profitunity strategy.
MFI and Awesome Oscillator
According to the Market Facilitation Index Oscillator, the Squat bar is colored blue, all other bars are colored according to the Awesome Oscillator color, except for the Fake bars, colored with a lighter AO color. In the indicator settings, you can enable the display of "Green" bars (in the "Green Bars > Show" field). In the indicator style settings, you can disable changing the color of bars in accordance with the AO color (in the "AO bars" field), including changing the color for Fake bars (in the "Fake AO bars" field).
MFI is calculated using the formula: (high - low) / volume.
A Squat bar means that, compared to the previous bar, its MFI has decreased and at the same time its volume has increased, i.e. MFI < previous bar and volume > previous bar. A sign of a possible price reversal, so this is a particularly important signal.
A Fake bar is the opposite of a Squat bar and means that, compared to the previous bar, its MFI has increased and at the same time its volume has decreased, i.e. MFI > previous bar and volume < previous bar.
A "Green" bar means that, compared to the previous bar, its MFI has increased and at the same time its volume has increased, i.e. MFI > previous bar and volume > previous bar. A sign of trend continuation. But a more significant trend confirmation or warning of a possible reversal is the Awesome Oscillator, which measures market momentum by calculating the difference between the 5 Period and 34 Period Simple Moving Averages (SMA 5 - SMA 34) based on the midpoints of the bars (hl2). Therefore, by default, the "Green" bars and their opposite "Fade" bars are colored according to the color of the Awesome Oscillator.
According to Bill Williams' Profitunity strategy, using the Awesome Oscillator, the third Elliott wave is determined by the maximum peak of AO in the range from 100 to 140 bars. The presence of divergence between the maximum AO peak and the subsequent lower AO peak in this interval also warns of a possible correction, especially if the AO crosses the zero line between these AO peaks. Therefore, the chart additionally displays the prices of the highest and lowest bars, as well as the maximum or minimum peak of AO in the interval of 140 bars from the last bar. In the indicator settings, you can hide labels, lines, change the number of bars and any parameters for the AO indicator - method (SMA, Smoothed SMA, EMA and others), length, source (open, high, low, close, hl2 and others).
Bullish Divergent bar
🟢 A buy signal (Long) is a Bullish Divergent bar with a green circle displayed above it if such a bar simultaneously meets all of the following conditions:
The high of the bar is below all lines of the Alligator indicator.
The closing price of the bar is above its middle, i.e. close > (high + low) / 2.
The low of the bar is below the low of 2 previous bars or below the low of one previous bar, and the low of the second previous bar is a lower fractal (▼). By default, Divergent bars are not displayed, the low of which is lower than the low of only one previous bar and the low of the 2nd previous bar is not a lower fractal (▼), but you can enable the display of any Divergent bars in the indicator settings (by setting the value "no" in the " field Divergent Bars > Filtration").
The following conditions strengthen the Bullish Divergent bar signal:
The opening price of the bar, as well as the closing price, is higher than its middle, i.e. Open > (high + low) / 2.
The high of the bar is below all lines of the open Alligator indicator, i.e. the green line (Lips) is below the red line (Teeth) and the red line is below the blue line (Jaw). In this case, the color of the circle above the Bullish Divergent bar is dark green.
Squat Divergent bar.
The bar following the Bullish Divergent bar corresponds to the green color of the Awesome Oscillator.
Divergence on Awesome Oscillator.
Formation of the lower fractal (▼), in which the low of the Divergent bar is the peak of the fractal.
Bearish Divergent bar
🔴 A signal to sell (Short) is a Bearish Divergent bar under which a red circle is displayed if such a bar simultaneously meets all the following conditions:
The low of the bar is above all lines of the Alligator indicator.
The closing price of the bar is below its middle, i.e. close < (high + low) / 2.
The high of the bar is higher than the high of 2 previous bars or higher than the high of one previous bar, and the high of the second previous bar is an upper fractal (▲). By default, Divergent bars are not displayed, the high of which is higher than the high of only one previous bar and the high of the 2nd previous bar is not an upper fractal (▲), but you can enable the display of any Divergent bars in the indicator settings (by setting the value "no" in the " field Divergent Bars > Filtration").
The following conditions strengthen the Bearish Divergent bar signal:
The opening price of the bar, as well as the closing price, is below its middle, i.e. open < (high + low) / 2.
The low of the bar is above all lines of the open Alligator indicator, i.e. the green line (Lips) is above the red line (Teeth) and the red line is above the blue line (Jaw). In this case, the color of the circle under the Bearish Divergent bar is dark red.
Squat Divergent bar.
The bar following the Bearish Divergent bar corresponds to the red color of the Awesome Oscillator.
Divergence on Awesome Oscillator.
Formation of the upper fractal (▲), in which the high of the Divergent bar is the peak of the fractal.
Alligator lines crossing
Bars crossing the green line (Lips) of the open Alligator indicator is the first warning of a possible correction (price rollback) if one of the following conditions is met:
If the bar closed below the Lips line, which is above the Teeth line, and the Teeth line is above the Jaw line, while the closing price of the previous bar is above the Lips line.
If the bar closed above the Lips line, which is below the Teeth line, and the Teeth line is below the Jaw line, while the closing price of the previous bar is below the Lips line.
The intersection of all open Alligator lines by bars is a sign of a deep correction and a warning of a possible trend change.
Frequent intersection of Alligator lines with each other is a sign of a sideways trend (flat).
Signal Alerts
To receive notifications about signals when creating an alert, you must select the condition "Any alert() function is call", in which case notifications will arrive in the following format:
D — timeframe, for example: D, 4H, 15m.
🟢 BDB⎾ - a signal for a Bullish Divergent bar to buy (Long), triggers once after the bar closes and includes additional signals:
/// — if Alligator is open.
⏉ — if the opening price of the bar, as well as the closing price, is above its middle.
+ Squat 🔷 - Squat bar or + Green ↑ - "Green" bar or + Fake ↓ - Fake bar.
+ AO 🟩 - if after the Divergent bar closes, the oscillator color change for the next bar corresponds the green color of the Awesome Oscillator. ┴/┬ — AO above/below the zero line. ∇ — if there is divergence on AO in the interval of 140 bars from the last bar.
🔴 BDB⎿ - a signal for a Bearish Divergent bar to sell (Short), triggers once after the bar closes and includes additional signals:
/// — if Alligator is open.
⏊ — if the opening price of the bar, as well as the closing price, is below its middle.
+ Squat 🔷 - Squat bar or + Green ↑ - "Green" bar or + Fake ↓ - Fake bar.
+ AO 🟥 - if after the Divergent bar closes, the oscillator color change for the next bar corresponds to the red color of the Awesome Oscillator. ┴/┬ — AO above/below the zero line. ∇ — if there is divergence on AO in the interval of 140 bars from the last bar.
Alert for bars crossing the green line (Lips) of the open Alligator indicator (can be disabled in the indicator settings in the "Alligator > Enable crossing lips alerts" field):
🔴 Crossing Lips ↓ - if the bar closed below the Lips line, which is above than the other lines, while the closing price of the previous bar is above the Lips line.
🟢 Crossing Lips ↑ - if the bar closed above the Lips line, which is below the other lines, while the closing price of the previous bar is below the Lips line.
The fractal signal is triggered after the second bar closes, completing the formation of the fractal, if alerts about fractals are enabled in the indicator settings (the "Fractals > Enable alerts" field):
🟢 Fractal ▲ - upper (Bearish) fractal.
🔴 Fractal ▼ — lower (Bullish) fractal.
⚪️ Fractal ▲/▼ - both upper and lower fractal.
↳ (H=high - L=low) = difference.
If you redirect notifications to a webhook URL, for example, to a Telegram bot, then you need to set the notification template for the webhook in the indicator settings in the "Webhook > Message" field (contains a tooltip with an example), in which you just need to specify the text {{message}}, which will be automatically replaced with the alert text with a ticker and a link to TradingView.
‼️ A signal is not a call to action, but only a reason to analyze the chart to make a decision based on the rules of your strategy.
***
Индикатор включает в себя Williams Alligator, Williams Fractals, Дивергентные бары, Market Facilitation Index, самый высокий и самый низкий бары, максимальный и минимальный пик Awesome Oscillator, а также оповещения о сигналах на основе стратегии Profitunity Билла Вильямса.
MFI и Awesome Oscillator
В соответствии с осциллятором Market Facilitation Index Приседающий бар окрашен в синий цвет, все остальные бары окрашены в соответствии с цветом Awesome Oscillator, кроме Фальшивых баров, которые окрашены более светлым цветом AO. В настройках индикатора вы можете включить отображение "Зеленых" баров (в поле "Green Bars > Show"). В настройках стиля индикатора вы можете выключить изменение цвета баров в соответствии с цветом AO (в поле "AO bars"), в том числе изменить цвет для Фальшивых баров (в поле "Fake AO bars").
MFI рассчитывается по формуле: (high - low) / volume.
Приседающий бар означает, что по сравнению с предыдущим баром его MFI снизился и в тоже время вырос его объем, т.е. MFI < предыдущего бара и объем > предыдущего бара. Признак возможного разворота цены, поэтому это особенно важный сигнал.
Фальшивый бар является противоположностью Приседающему бару и означает, что по сравнению с предыдущим баром его MFI увеличился и в тоже время снизился его объем, т.е. MFI > предыдущего бара и объем < предыдущего бара.
"Зеленый" бар означает, что по сравнению с предыдущим баром его MFI увеличился и в тоже время вырос его объем, т.е. MFI > предыдущего бара и объем > предыдущего бара. Признак продолжения тренда. Но более значимым подтверждением тренда или предупреждением о возможном развороте является Awesome Oscillator, который измеряет движущую силу рынка путем вычисления разницы между 5 Периодной и 34 Периодной Простыми Скользящими Средними (SMA 5 - SMA 34) по средним точкам баров (hl2). Поэтому по умолчанию "Зеленые" бары и противоположные им "Увядающие" бары окрашены в соответствии с цветом Awesome Oscillator.
По стратегии Profitunity Билла Вильямса с помощью осциллятора Awesome Oscillator определяется третья волна Эллиота по максимальному пику AO в интервале от 100 до 140 баров. Наличие дивергенции между максимальным пиком AO и следующим за ним более низким пиком AO в этом интервале также предупреждает о возможной коррекции, особенно если AO переходит через нулевую линию между этими пиками AO. Поэтому на графике дополнительно отображаются цены самого высокого и самого низкого баров, а также максимальный или минимальный пик АО в интервале 140 баров от последнего бара. В настройках индикатора вы можете скрыть метки, линии, изменить количество баров и любые параметры для индикатора AO – метод (SMA, Smoothed SMA, EMA и другие), длину, источник (open, high, low, close, hl2 и другие).
Бычий Дивергентный бар
🟢 Сигналом на покупку (Long) является Бычий Дивергентный бар над которым отображается зеленый круг, если такой бар соответствует одновременно всем следующим условиям:
Максимум бара ниже всех линий индикатора Alligator.
Цена закрытия бара выше его середины, т.е. close > (high + low) / 2.
Минимум бара ниже минимума 2-х предыдущих баров или ниже минимума одного предыдущего бара, а минимум второго предыдущего бара является нижним фракталом (▼). По умолчанию не отображаются Дивергентные бары, минимум которых ниже минимума только одного предыдущего бара и минимум 2-го предыдущего бара не является нижним фракталом (▼), но вы можете включить отображение любых Дивергентных баров в настройках индикатора (установив значение "no" в поле "Divergent Bars > Filtration").
Усилением сигнала Бычьего Дивергентного бара являются следующие условия:
Цена открытия бара, как и цена закрытия, выше его середины, т.е. Open > (high + low) / 2.
Максимум бара ниже всех линий открытого индикатора Alligator, т.е. зеленая линия (Lips) ниже красной линии (Teeth) и красная линия ниже синей линии (Jaw). В этом случае цвет круга над Бычьим Дивергентным баром окрашен в темно-зеленый цвет.
Приседающий Дивергентный бар.
Бар, следующий за Бычьим Дивергентным баром, соответствует зеленому цвету Awesome Oscillator.
Дивергенция на Awesome Oscillator.
Образование нижнего фрактала (▼), у которого минимум Дивергентного бара является пиком фрактала.
Медвежий Дивергентный бар
🔴 Сигналом на продажу (Short) является Медвежий Дивергентный бар под которым отображается красный круг, если такой бар соответствует одновременно всем следующим условиям:
Минимум бара выше всех линий индикатора Alligator.
Цена закрытия бара ниже его середины, т.е. close < (high + low) / 2.
Максимум бара выше маскимума 2-х предыдущих баров или выше максимума одного предыдущего бара, а максимум второго предыдущего бара является верхним фракталом (▲). По умолчанию не отображаются Дивергентные бары, максимум которых выше максимума только одного предыдущего бара и максимум 2-го предыдущего бара не является верхним фракталом (▲), но вы можете включить отображение любых Дивергентных баров в настройках индикатора (установив значение "no" в поле "Divergent Bars > Filtration").
Усилением сигнала Медвежьего Дивергентного бара являются следующие условия:
Цена открытия бара, как и цена закрытия, ниже его середины, т.е. open < (high + low) / 2.
Минимум бара выше всех линий открытого индикатора Alligator, т.е. зеленая линия (Lips) выше красной линии (Teeth) и красная линия выше синей линии (Jaw). В этом случае цвет круга под Медвежьим Дивергентным Баром окрашен в темно-красный цвет.
Приседающий Дивергентный бар.
Бар, следующий за Медвежьим Дивергентным баром, соответствует красному цвету Awesome Oscillator.
Дивергенция на Awesome Oscillator.
Образование верхнего фрактала (▲), у которого максимум Дивергентного бара является пиком фрактала.
Пересечение линий Alligator
Пересечение барами зеленой линии (Lips) открытого индикатора Alligator является первым предупреждением о возможной коррекции (откате цены) при выполнении одного из следующих условий:
Если бар закрылся ниже линии Lips, которая выше линии Teeth, а линия Teeth выше линии Jaw, при этом цена закрытия предыдущего бара находится выше линии Lips.
Если бар закрылся выше линии Lips, которая ниже линии Teeth, а линия Teeth ниже линии Jaw, при этом цена закрытия предыдущего бара находится ниже линии Lips.
Пересечение барами всех линий открытого Alligator является признаком глубокой коррекции и предупреждением о возможной смене тренда.
Частое пересечение линий Alligator между собой является признаком бокового тренда (флэт).
Оповещения о сигналах
Для получения уведомлений о сигналах при создании оповещения необходимо выбрать условие "При любом вызове функции alert()", в таком случае уведомления будут приходить в следующем формате:
D — таймфрейм, например: D, 4H, 15m.
🟢 BDB⎾ — сигнал Бычьего Дивергентного бара на покупку (Long), срабатывает один раз после закрытия бара и включает дополнительные сигналы:
/// — если Alligator открыт.
⏉ — если цена открытия бара, как и цена закрытия, выше его середины.
+ Squat 🔷 — Приседающий бар или + Green ↑ — "Зеленый" бар или + Fake ↓ — Фальшивый бар.
+ AO 🟩 — если после закрытия Дивергентного бара, изменение цвета осциллятора для следующего бара соответствует зеленому цвету Awesome Oscillator. ┴/┬ — AO выше/ниже нулевой линии. ∇ — если есть дивергенция на AO в интервале 140 баров от последнего бара.
🔴 BDB⎿ — сигнал Медвежьего Дивергентного бара на продажу (Short), срабатывает один раз после закрытия бара и включает дополнительные сигналы:
/// — если Alligator открыт.
⏊ — если цена открытия бара, как и цена закрытия, ниже его середины.
+ Squat 🔷 — Приседающий бар или + Green ↑ — "Зеленый" бар или + Fake ↓ — Фальшивый бар.
+ AO 🟥 — если после закрытия Дивергентного бара, изменение цвета осциллятора для следующего бара соответствует красному цвету Awesome Oscillator. ┴/┬ — AO выше/ниже нулевой линии. ∇ — если есть дивергенция на AO в интервале 140 баров от последнего бара.
Сигнал пересечения барами зеленой линии (Lips) открытого индикатора Alligator (можно отключить в настройках индикатора в поле "Alligator > Enable crossing lips alerts"):
🔴 Crossing Lips ↓ — если бар закрылся ниже линии Lips, которая выше остальных линий, при этом цена закрытия предыдущего бара находится выше линии Lips.
🟢 Crossing Lips ↑ — если бар закрылся выше линии Lips, которая ниже остальных линий, при этом цена закрытия предыдущего бара находится ниже линии Lips.
Сигнал фрактала срабатывает после закрытия второго бара, завершающего формирование фрактала, если оповещения о фракталах включены в настройках индикатора (поле "Fractals > Enable alerts"):
🟢 Fractal ▲ — верхний (Медвежий) фрактал.
🔴 Fractal ▼ — нижний (Бычий) фрактал.
⚪️ Fractal ▲/▼ — одновременно верхний и нижний фрактал.
↳ (H=high - L=low) = разница.
Если вы перенаправляете оповещения на URL вебхука, например, в бота Telegram, то вам необходимо установить шаблон оповещения для вебхука в настройках индикатора в поле "Webhook > Message" (содержит подсказку с примером), в котором в качестве текста сообщения достаточно указать текст {{message}}, который будет автоматически заменен на текст оповещения с тикером и ссылкой на TradingView.
‼️ Сигнал — это не призыв к действию, а лишь повод проанализировать график для принятия решения на основе правил вашей стратегии.

SpiceIn the chart photo is a description for each shape and letter, saying what each one is.
BB, Reversals are off by default.
BB + Reversals + Next bar confirmation - The way this should be used is by waiting for a 1 or 2 bar confirmation closed above/below the high/low of the Reversal candle. So if its a Top R, a yellow box will print as a confirmed 1 bar if it closed below the top R's low, then you can wait for the second bar to close also below the Top R's low. Vice versa with the Bot R.
RSI arrows - Essentially showing you when the multi time frame RSIs are coming back up above 30, or below 70. Respective to what time frames you have selected.
Three Line Strike - A trend continuation candlestick pattern consisting of four candles
Leledc Exhaustion suggest the trend may be reversing. Combined with the moving average as a trend filter, the indicator can signal the end of a pull back and the continuation of the trend.
EMAs - Help measuring the trend direction over a period of time.
Credit to all these amazing creators -
Multi Timeframe RSI (LTF) by @millerrh
3 Line Strike by @Lij_MC 'MarketVision A'
Leledc Exhaustion by @glaz, used updated version by @Joy_Bangla
If anyone uses the BB reversals source code to put into their own indicator/strategy, you are free to do so. Just send me a message I'd love to see your work with it! :)
Thanks to Lij_MC's MarketVision A indicator for inspiring me to add more features. At first it was just the RSI Arrows and the BB reversals candles + Condition but then I found MarketVision A and loved the extra Leledc and 3 Line Strike features.
Hope you enjoy this Spice!
No Signal is 100% correct at what it's trying to do. Use caution when trading!
Practice Risk Management.

TTP Pair CipherPair Cipher can run your hedge pair trading strategy.
Pair cipher can use a spread chart (two assets ratio or difference) to manage a hedge position consisting of two assets: one long and one short position.
Event though the spread chart is used to determine the entries and exits each coin price action is used to calculate floating PNL.
It supports different bot platforms. It's backtestable and can run live.
Features:
- Internal and external entry signal
- In-chart realised PNL plot
- Hedge position floating PNL chart
- Individual floating PNL for each long and short ("show coins" toggle)
- Retracement exit strategy: determine at which retracement factor to exit your position while in profit
- PNL RSI exit strategy: determine at which RSI level crossunder you'd like to exit. RSI is applied to the floating PNL
- Static TP/SL levels
- ATR TP/SL levels with individual factors. When ATR is selected the TP or SL acts as a multiplier of ATR instead.
- On-chart debug labels for alerts
- Intra candle alert: signals can trigger intra candle in this mode, but this mode will cause repainting. Example: if the position goes below SL intra candle, the alert will be sent, but later if it goes in profit before closing the candle, the backtest will continue with the position open. The backtest does NOT have access to the intra candle data. Alert intra candle reduces the risk of not applying SL.
Example of setup:
1) Load an empty 1 hour timeframe chart with the spread BYBIT:REQUSDT.P / BYBIT:REEFUSDT.P
2) Select an investment amount
3) Select TP 1.2 and enable ATR
4) Select SL 1.1 and enable ATR
5) Select RSI profits of crossunder 70
6) Don't enable external signal (you can try with TTP PNR)
7) Select BYBIT:REQUSDT.P as symbol 1
8) Select BYBIT:REEFUSDT.P as symbol 2

The Master Pattern Indicator***READ THIS FIRST****
THE MASTER PATTERN Indicator
USER AGREEMENT
*** The personal/private use of this indicator is allowed, commercial use is FORBIDDEN.
***Commercial use will be interpreted as taking advantage of the free indicator in order to profit from it, for example: as part of any courses or mentorships offering training of the indicator or the concept its based. You don't need to pay for any training for this, the strategy is a simple trend following approach, even a caveman would understand.
**********************************************************************************************************************
Now please enjoy the BEST Master Pattern indicator you will ever find for Tradingvew, and for the best price: FREE.
Please do not give money to people trying to charge you for any inferior version of this indicator.
DESCRIPTION
The Master Pattern indicator or The Forex Master Pattern is an alternative form of technical analysis that provides a framework which will help you to find and follow the hidden price pattern that reveals the true intentions of financial markets. This algorithm I came up with does a very good job detecting the Phase 1 of the Forex Master Pattern cycle, which is the contraction point (or Value), and then proceeds to differentiate between major or minor lines and prints the liquidity lines the correct manner in relation to the swings expanding from the contraction.
On Phase 2 we get higher timeframe activation (also called Expansion), which is where price oscillates above and below the average price defined on Phase 1.
On Phase 3 is where we get a sustained deviation from value (the Trend).
In a very short time you will start noticing this pattern, even on naked charts. It is all a matter of training your eyes - the more time you invest studying the charts with this indicator (both historically and replaying the market on strategy tester), the faster you will become familiar with this method.
This indicator DOES NOT REPAINT. You can safely study the chart historically because what is printed historically is what prints real time.
Why do traditional based indicator systems fail over time? Because the markets move in cycles that constantly change structure. Those traditional indicator systems must be constantly optimized and settings tinkered with because of the changing market environment. There are an infinite number of variables that affect price so no exact technical system can work the same forever, which is also the reason why most bots/EA fail.
If you learn to spot the Forex Master Pattern and understand the sequence of the real cycles that drive the markets, you can more accurately forecast market behavior. By using traditional indicators you end up masking this pattern.
Use the insights provided by the Forex Master Pattern indicator to elevate your trading to the next level.
This method of analysis works in any liquid market and timeframe.
VERY IMPORTANT:
The default setting of historical bars is set to 500. This is more than enough for day trading and ensures fast drawings loading time and stable performance. Bear in mind that, the more bars you choose to load historically, the longer it will take to draw everything. The max setting of this input for now is 800. If it is possible to increase it, I will update the code. So if you want to make historical analysis far in the past, just use the chart replay feature.
Indicator Parameters:
They are all self-explanatory, except Type. You can choose between 1 and 2.
1 is better suited for LTF (M1 to M30)
2 is better suited for HTF (H1 and upwards)
However, this is my personal preference. You can of course experiment and choose what looks best for you.
Instructions to use the alert function:
1st step - Choose symbol and timeframe for the alert
2nd step - Go to indicator settings and tick/untick the boxes for the alerts you want
3rd step - Click on the ... (three dots) next to the indicator name (chart upper left corner) and click to add indicator alert
Then it's gonna add the alert with the conditions that you've ticked/unticked inside indicator settings.
Then repeat the process for different symbols, timeframes and different alert conditions.

BE - Strategy Builder ToolkitIndicator vs Toolkit:
This is definitely not an indicator, hence this doesn't do any kind of analysis nor provide meaningful outputs where you can take trading decisions out of it.
This is a Strategy Builder Toolkit which works like any other broker/3P applications, which helps traders to build their own custom/ predefined strategies, save / deploy them at their wish.
Idea Behind Developing this Toolkit: I am sure many of traders have overcome scenarios where, on break of x level he wants to initiate straddle else he wants to initiate Iron Condor. Some of them wants to deploy custom strategies only at certain time or at certian price levels.
It becomes pretty difficult to track markets when you are away from desk and if you dont adjust the strategy legs, you are incurring big drawdowns. There are many if's and buts to deploy strategies.
To overcome such challenges, i have built this toolkit.
Note: As this is just a toolkit, you should conduct your analysis to gauge the market direction outside the perview of this. Once you know the view / direction of the script. you can use this toolkit in action to
1. Deploy Strategy at (Desired levels| Desired time|Confired Levels|Confirmed Volumes)
2. Strategy can be Prebuilt / Custom Built
3.1 Set SL, Target for Directional view (Trail SL aswell)
3.2 Set Upside or Downside Target for Non Directional view (Trail SL aswell)
3.3 let the strategy play with out SL|Targets for consolidation view.
4. Adjust Legs by closing existing position and opening fresh position or place fresh adjustments
5. Book partial Profits with in the zone.
How the Toolkit is buit: Script uses text related functions to understand the custom input given in the indicator and coverts into a strategy and deployes them as a algo trading (Next Level Bot) with the additional parameter set for SL|Target|Entry levels.
Understanding the settings:
1. Strike Difference: is basically a value between each strike. eg: Banknifty : 100, Nifty & Finnifty: 50
2. 1 Lot Qty: Qty per Lot accepted by exchange|Broker. eg: BNF: 15, Nifty: 50, Finnifty: 40
3. Lot Multiplier: If you build strategy with 1 lot and if you set the Lot multiplier as 2 then strategy gets deployed with 2 lots. for eg. If i have saved strategy to buy BNF 1 ITM with 1Lot and have set lot multipier to 3 then at the time of deploying the trade it pushes as 3 lots (3 * 15Qty per lot = 45Qty) of 1 ITM strike.
4. Symbol Name: Select the Symbol Name here.
5. Current & Next Week Expiry Date: Specify the expiry Dates in the format as supported by your broker.
6. Broker Name, Exchange & Product Type: hope it is self explanatory.
IMPORTANT settings to understand:
7. Triggere Entry Post (optional): You have to specify when you want to deploy the strategy. For instance, if i want to deploy my strategy at 30 min after market open which is 9:45 am, then i have specify as 0945. Another instance where i want to close my strategy at 3 PM then you have to specify as 1500. Uncheck this option if you are not worried about the time of entry.
My personal Used Case: On the Expiry -1 Day at 0916 (9:16AM) i will buy 6 lots of 8OTM PE & CE and Sell 2 lots 7OTM, 2 lots of 6OTM and 2 lots of 5OTM and close the trade by 1100 (11AM).
8. Price Levels (Confirmed vs UnConfirmed) (Optional): Confirmed is basically price is sustained at|around the specified price level, where in UnConfirmed is basically the touch of the specified level.
for instance if i want to deploy straddle only if price is sustained at 100. then, i would specify GE with 100 in price input settings, and check thee Confirmed price box. Assuming if LTP is running at 98 and with the above settings it will only deploy the trade upon price is sustained at 100 level for 3 to 5 candles not at the touch of 100.
Uncheck this option if you are not worried about the Entry Price.
9. Confirmed Volume (Optional) (Long or Short): Basis your view|direction of the strategy. you can get additional confirmation. At the time of entry you want volume to be present towards the direction of the strategy. Uncheck this option if you are not worried about the volume or Volume doesn't exist for the chart loaded.
10. Alert Types: It consists of 3 Long & 3 Short directional (prebuilt) strategy along with Close Strategy, Close Specified Symbols Only & Design Custom Strategy Option.
10.1 : Slow Upmove - If you are having bullish view and predict that prices shall go slow and steady. This strategy can be deployed where you get the benifit of time decay as well while the delta play in favor of you. (viseversa for Slow DownMove)
10.2 : Fast Upmove - If you are having bullish view and predict that prices shall go fast. This strategy can be deployed where you get the smaller benifit of time decay as well while the delta play in favor of you. (viseversa for Fast DownMove)
10.3 : Vol Upmove (Volatality)- If you are having bullish view and predict market is tend to be volatile. This strategy can be deployed where you get the benifit of volatility as well while the delta play in favor of you. (viseversa for VolDownMove)
10.4 : Close Trade - You can use this option close the deployed strategy completely.
10.5 : Close Symbols - You can use this option close few of the symbols for the strategy deployed.
10.6 : Custom: Use this option to design you own custom strayegy with the syntax below:
Sample 1:
N|B|C2|3
N refers to Nextweek Expiry (if C is used then Current week expiry)
B refers to Buy (if S is used then Sell)
C refers to Call | CE (if P is used then PE or Put)
2 refers to 2OTM (for CE any Postitive number refers to as OTM and for PE it will be treated as ITM strikes & 0 refers to as ATM - viseversa for Negative Numbers)
3 refers to as 3 Lot
With the syntax of N|B|C2|3 - strategy will be deployed as "Buy 3 lots of 2 OTM Call of Next expiry"
Sample 2:
C|S|P-3|3|10|30
Above syntax means: SELL Current Expiry 3 Lots of 3 OTM Put Strike with 10 SL and 30 TGT
Sample 3:
C|S|C10|3|Default
Above syntax means: SELL Current Expiry 3 Lots of 10 OTM CALL Strike with 50% SL and 95% TGT
Sample 4:
C|B|C-2|3|40%|50%
Above syntax means: BUY Current Expiry 3 Lots of 2 ITM CALL Strike with 40% SL and 50% TGT
Sample 5: Long Straddle
C|B|C0|3
C|B|P0|3
Above syntax means: BUY Current Expiry 3 Lots of ATM CALL & PUT Strike
Sample 6: Iron Butterfly
C|B|C1|1
C|S|C0|1
C|S|P0|1
C|B|P-1|1
Above syntax means: Sell Current Expiry 1 Lots of ATM CALL & PUT Strike and BUY 1OTM Call & Put Strike
Sample 7: Diagonal Spread
C|S|C2|1
C|S|P-2|1
N|B|C3|1
N|B|P-3|1
Above syntax means: Sell Current Expiry 1 Lots of 2OTM CALL & PUT Strike and BUY 3OTM Call & Put Strike of Next Expiry.
To Understand how to deploy Strategy with defined Adjustments. For instance i want to deploy Iron Condor with Adjustments for BNF when the price is currently running at 45000.
C|B-|C3|1
C|S*|C2|1
C|B--|P-3|1
C|S**|P-2|1
At:2|C|S|C2|1
At:2|C|B|C3|1
At:-2|C|S|P-2|1
At:-2|C|B|P-3|1
On:2|*
On:-2|**
On:2|-
On:-2|--
With the above syntax: Intial trades are placed with
BUY BANKNIFTY45300CALL(Current Expiry) 1 Lot
BUY BANKNIFTY44700PUT(Current Expiry) 1 Lot
SELL BANKNIFTY45200CALL(Current Expiry) 1 Lot
SELL BANKNIFTY44800PUT(Current Expiry) 1 Lot
Toolkit tracks the price and holds the adjustments.
We may start to bleed on the sold leg (45200CALL) once the price crosses 45200. Hence if the price crosses 2 strike upside as specified with syntax " On:2|* " where * is a character tagged to Sold Call Leg. it closes the 45200 Call.
Similarly, " On:2|- " where - is character tagged to Brought Call Leg. it closes the 45300 Call, as soon as prices reaches 2 strike upside.
At:2|C|S|C2|1
At:2|C|B|C3|1
With the At Statements you can place the fresh adjustments legs. Above syntax refers to Once the price reaches 45200 it places below adjustment legs.
BUY BANKNIFTY45500CALL(Current Expiry) 1 Lot
SELL BANKNIFTY45400CALL(Current Expiry) 1 Lot
Note: Similarly If prices reaches downside with the On and At Sytax it places the necessary adjustment legs accordingly.
11. SL & TGT - You can specify SL, TGT or Upside & Dowside TGT during the entry conditions and Stratey shall be closed upon hitting either the SL or TGT accordingly.
12. On % Tgt & Lock % SL: This option is used for Prebuilt strategy where you can lock the Profit | Set Revised SL upon hitting specified TGT percentage.
13. Close Symbols: This option is used if you select Alert type as Close Symbols (Ref - 10.5 : Close Symbols) for specified list of symbols Alert shall be pushed to close the open positions of those symbols.
DISCLAIMER: No sharing, copying, reselling, modifying, or any other forms of use are authorized for our documents, script / strategy, and the information published with them. This informational planning script / strategy is strictly for individual use and educational purposes only. This is not financial or investment advice. Investments are always made at your own risk and are based on your personal judgement. I am not responsible for any losses you may incur. Please invest wisely.
Happy to receive suggestions and feedback in order to improve the performance of the indicator better.

[OKX Signal Bot] Indicator Script Set Up TemplateDiscover the power of the Turtle Trade Channels Indicator (TUTCI), an innovative tool that integrates the time-tested principles of the legendary Turtle Trade system. This groundbreaking system shattered the belief that successful traders are born, not made, by transforming ordinary individuals into profitable traders.
The Turtle Trade Experiment, which achieved a remarkable 80% annual return over four years and amassed a staggering $150 million, showcased the immense potential of this trend-following strategy. Unlike the conventional "buy low and sell high" approach, the Turtle Trade system embraces a different philosophy—one of capturing substantial profits by following prevailing trends.
At the heart of the Turtle Trade Channels Indicator lies the concept of Donchian Channels, a powerful technical indicator developed by Richard Donchian. Building upon this foundation, the main rule of TUTCI is to identify 20-day breakouts and capitalize on them, while simultaneously utilizing a profit-taking strategy based on breaching 10-day highs or lows.
For long trades, the indicator signals a buying opportunity when the price breaks above the 20-day high. Conversely, for short trades, a selling opportunity arises when the price falls below the 20-day low. This systematic approach allows traders to align themselves with the prevailing momentum, capturing significant price movements.
To further enhance trading precision, TUTCI incorporates two key lines. The red line represents the trading line, indicating the direction of the trend. Price bars above the trend line suggest an uptrend, while those below indicate a downtrend. The dotted blue line serves as the exit line, guiding traders to close their positions when price action breaches the 10-day high or low. This rule safeguards profits and helps traders avoid potential trend reversals.
The Turtle Trade Channels Indicator (TUTCI) is a versatile tool applicable to various financial markets, including stocks, commodities, and forex. By harnessing the power of breakouts and integrating profit-taking rules, this indicator empowers traders to capitalize on favorable trading opportunities while managing risk effectively.
As with any trading strategy, it is crucial to conduct thorough backtesting and evaluation of the TUTCI system before implementing it in live trading. Traders can customize the indicator's parameters to align with their trading preferences and adapt to changing market conditions. Employing sound risk management techniques, such as position sizing and stop-loss orders, is paramount to protect capital and minimize potential losses.
Experience the transformational potential of the Turtle Trade Channels Indicator (TUTCI) and embark on a journey of trend following, capturing significant profits, and achieving trading success.
These scripts are only functioning as sample script templates to support okx alert standards. It is not intended to provide any investment, tax, or legal advice, nor should it be considered an offer to purchase, sell, hold or offer any services relating to digital assets. Digital assets, including stablecoins, involve a high degree of risk, can fluctuate greatly, and can even become worthless. You should carefully consider whether trading or holding digital assets is suitable for you in light of your financial condition and risk tolerance. OKX does not provide investment or asset recommendations. You are solely responsible for your investment decisions, and OKX is not responsible for any potential losses. Past performance is not indicative of future results. Please consult your legal/tax/investment professional for questions about your specific circumstances.

Trade Manager & Position Size Tool & PnL Tracker [AlgoScopes] V1Position size tool, leverage calculator, trade tracker, money management, trade presentation, risk reward management, margin position, live profit and loss, that's all in this one Trade Manager indicator.
The idea for this indicator comes from two years ago when I was helping a friend who, at the request of 15-20 members from our telegram group, wanted to create a paid group and share our ideas for trade with them (it started as an experiment for just a month or two and ended with 15 months with over 500 trading ideas and signals, with a complete TA chart). If I had time to create this indicator back then for members, it would have been much easier for them to be able to understand and follow the trade idea that was presented through a classic chart, with all the things that a TA must have:
Entry (as well as the reason for entry),
Stop (where the idea for the trade is no longer valid),
Target (with the reason why it is the target for that trade),
Take profits (taking part of the profit on the way to the target).
The majority of members still did not understand how much position to trade, what is the possible profit or loss, if the margin trade is how much leverage to use, in one word “money management”. The most important rule that every trader must follow is "Plan your trade and trade your plan". Learn money management and you are halfway there to becoming a successful trader. It is only after all that, you learn to use some of the "holy grail" indicators. When you have mastered those first two rules, find and master your favorite indicator or trading style (the most important thing is to stick to those two rules). The margin | leverage is also included in the script, for which there are so many dilemmas, arguments and discussions. (that many who still do not understand margin, would trade that it is not passionate if it is controlled). Too much for an introduction, especially since this indicator has so much to explain.
Most importantly, this is an invite-only indicator, and there are so many free indicators on tradingview that can also serve you very well. As far as I know, all exchanges have a calculator tool to calculate the possible profit and loss for each trade you plan to take.
*This indicator is not recommended for scalping on a 1min chart because the script, as you will see, is very complex, so the loading time is longer than with simpler indicators.
💠 ABOUT THE SCRIPT
This script is made to help manage trade. In this one indicator you have the possibility to do technical analysis, calculation for trade (four types: account size risk, trade investment, maximum to lose or position size), monitor 'PnL' (profit and loss in real time) do the calculation in the second, maybe local currency, and set an alert (from entry to any other change in trade). As the script is made for general use, some slight differences are possible for real time 'PnL' or 'ROI'. Always do a test before you start trading with larger amounts. The script is recommended for intra day trading and above. The script is not recommended for scalping on the 1min chart
💎 PROCESS TO ADD SCRIPT TO CHART
Possible trade on break example trade
As this script is invite-only, to add it to the chart you need to click on Indicators and find it under the 'Invite-Only' section. When you add the script to the chart (as it is interactive), you will be asked to do 4 steps.
🔸 'SET TRADE TIME'
Click on the chart where the last vertical bar is.
If you are already in the trade, then find the bar|time where the trade started
(you want to follow trade or trade presentation)
🔸 1) 'SET ENTRY'
Click on the horizontal level where you want to place the Entry
🔸 2) 'SET STOP'
Click on the horizontal level where you want to set the Stop
🔸 3) 'SET TARGET
Click on the horizontal level where you want to place the Target
💎 CONFIRM INPUTS
After you have done those 4 steps, a popup will appear with the relevant inputs for the trade.
You will see that some inputs are already filled (done in those 4 steps before, Entry, Stop and Target). You can correct them if you want (you will sometimes notice a longer 'space decimal' for the trade ticker, but this will not affect the calculator or other parts of the script). You can do the rest of the inputs for trade or finish it later when the script is loaded on the chart (it is recommended to fill in 'Trade Type' and 'Amount'. Don't forget to click on the "Apply" button to load the script on the chart.
💎 INDICATOR LOADED ON CHART
• When the indicator is loaded on the chart (regardless of whether it is a new trade or a trade that has already started), the following items are displayed by default:
🔸 ' Trade Table ' shows all relevant information for the trade
🔸 ' Trade Box ' with lines for Entry, Stop and Target (Take Profits if enabled)
🔸 ' Trade Box Labels ' with relevant data
• The Entry label is also the trade status label, and if the trade is not active, by default it is the Entry color
If the trade is active or when a new trade reached Entry, several new things are noticeable:
• Entry|Status label as well as status row in table will change color as well as 'Entry Reached' text
• Several extra columns relative to trade will be added to the Entry|Status label
• 3 new columns will also appear on the Trade Table (Live PnL, Live min PnL and Live ROI)
• If Trail Stop is enabled, the label will change the text to T.Stop and change color depending on whether it is in loss or profit.
• If Trail Stop is enabled, inside Trade Box trail line it will follow price action inside the box, while the label will always be fixed at the initial level
• A vertical colored line will appear on the right side of the Trade Box (depending on whether the trade is in profit or loss) which shows as in the Trade Table like Live PnL
⚪ SETTINGS
💎 Trade Account Setup
🔸 ‘Trade Type’
• 'Account Capital' or portfolio (with combination '% Capital Risk')
• 'Investment' (how much you want to invest in the trade)
• 'Risk To Lose' (how much you want to risk losing)
• 'Position Size' (exact position size, units|share for trade)
🔸 ‘Account Type’
• If the account is in another currency or you want to see possible profit | loss in local currency
• Around 150 world and local currencies supported by ICE exchange
🔸 ‘Amount’
• Amount for ‘Trade Type’
🔸 ‘% Capital Risk’
• Only for ‘Account Capital’ trade type
(i.e. 10.000 account capital with ‘% Capital Risk’ 4 is 10.000 x 4% = maximum loss 400)
🔸 ‘Leverage’
• Enable|Disable for margin trade i size of leverage (maximum 125x)
(be sure to study how and when to use margin trade through the tutorial, because margin trade can be very dangerous. If you have not perfected margin trade, there is a great possibility of losing most or even all of your account capital).
💎 TRADE ENTRY & TARGET & STOP & T.STOP & DATE | TIME
🔸 ‘Trade Date & Time’
🔸 ‘Entry’
🔸 ‘Stop’
🔸 ‘Target’
• (all was set in the previous step but can be correct/adjusted if needed)
🔸 ‘Market Entry’
• Enabled will move Entry on that bar close
🔸 ‘Liquidation’ (enabled by default)
• Show ‘Warning’ if trade Stop is close or invalid (trade will hit liquidation before reached Stop level)
🔸 ‘Trailing Type’ (4 trailing stop type)
• ‘Disabled’ (Stop will stay the entire time at the initial stop level)
• ‘Continuous’ (I.Stop follow price by distance or percent when price reached Trail start level)
• ‘Stepped’ (I.Stop moves to previous level when price reached Trail start level)
• ‘Breakeven’ (I.Stop moves to Entry when price reached Trail start level)*
* (least one Take Profit enabled)
🔸 ‘Trailing Active’ (Entry, TP1, TP2 and TP3)
• Trailing stop starts level if ‘Trailing Type’ is enabled
🔸 ‘Trailing by’ (distance or percent)
• ‘Distance’ (T.Stop will follow price action by distance)
• ‘Percent’ (T.Stop will follow price action by percent)
(this is a good example to see the difference between trailing by initial distance and initial percentage)
🔸 ‘T.Stop Distance & Percent’ (initial distance and percent for table trade only)
• Useful for bot or exchange
🔸 ‘Stop, T.Stop, Target and TP’s in PIP’s’
• Distance in PIP’s
💎 TAKE PROFIT
🔸 ‘Split Target’ (enabled by default to three take profits (TP) with auto split)
🔸 ‘Number of Take Profits’ (up to three take profits)
🔸 ‘Type’ (auto or manual)
• For manual type fill all prices to preferred level. TP percent (TP1%, TP2% and TP3% ) and Target% is how much profit you want to take on a specific level.
• PLEASE NOTE sum of all enabled ‘TP’ and targets = 100 (e.g. two TP and sets TP1% to 25 and TP2% to 35, then Target% should be 40% i.e. 25 + 35 + 40 = 100)
💎 TRADE BOX & LINES
🔸 ‘Target Line’ (color for target line and trade table ‘direction’)
🔸 ‘Stop Line’ (color for initial line and trail line)
🔸 ‘Entry Line’ (color for entry line and label & table status)
🔸 ‘To Trade Time’ (‘trade box’ left vertical line)
• By default is set to trade date and time
• Unchecked will be moved to the last bar (live time)
🔸 ‘Extended Left’ (extend Entry, Stop, Target and TP’s lines to left)
• To check for possible support|resistance
🔸 ‘Size’ (Entry, Stop, Target and TP’s lines size)
🔸 ‘PnL Box Size’ (line size for vertical box lines)
🔸 ‘Offset’ (right vertical line offset from last bar)
🔸 ‘PnL Box Color’ (right vertical line and trail fill color)
• Color changes for profit & loss
🔸 ‘Box Line Color’ (box base color)
💎 LABELS
🔸 ‘Stop & Target Labels’ (enable|disable stop and target labels)
• By default is set to small (tiny, small, normal, large, huge and auto option)
• Disabled will move all information on Entry|Status label
🔸 ‘Offset’ (label offset from trade box)
🔸 ‘Target Label’ (label color for target and all enabled tp’s)
🔸 ‘Stop Label’ (label color for initial stop and enabled trailing stop)
🔸 ‘Label Text’ (color for label text)
🔸 ‘Status Label Color’ (label table entry|status color when trade is not active)
🔸 ‘PnL’ (entry|status color for profit and loss)
🔸 ‘Size’ (by default set to normal, option tiny, small, normal, large, huge and auto)
🔸 ‘Risk to Reward’ (show risk to reward on labels)
🔸 ‘Extra Info’ (by default disabled, show extra related info for trade on labels)
• Useful if Trade Table disabled
🔸 ‘Close Trade Stats’ (by default disabled, show all info when trade is closed)
• By default is white text color for close trade stats label
💎 ALERTS
🔸 ‘Failed Trade’ (alert if price reached Stop before is active, reached Entry)
• Useful if trade need adjustment but it can also be left as it is
and alert is just warning
🔸 ‘New & Update Alert’ (alert when price reached Entry or change status to enabled Take Profits)
🔸 ‘Trade Closure Alert’ (alert when trade closed, reached Stop, Target or enabled Trail Stop)
• Alert can be in modified or default preset jSon format as well as in plain text format
• Place holders for creating alerts are :
{type}, {symbol}, {exchange}, {ticker}, {base}, {quote}, {timeframe}, {price}, {direction}, {entry}, {stop}, {tstop}, {tp1}, {tp2}, {tp3}, {target}, {tstopstatus}, {status}, {result}
* {type} placeholder is set to ‘Trade Active’, ‘Trade Update’ and ‘Trade Closed’
💎 TABLE DISPLAY
🔸 ‘Trade Table’ (enable|disable trade table)
🔸 ‘Position’ (by default set to bottom right with option bottom, middle and top with left, center and right)
🔸 ‘Size’ (by default set to normal, option tiny, small, normal, large, huge and auto)
🔸 ‘Full Table’ (by default enabled, disabled show small table without some info*)
* check picture for reference
🔸 ‘Presentation’ (by default disabled, hide all info related to PnL in trade currency)
• Useful if trade shared for presentation, hidden trade fiat|currency info)
🔸 ‘Header’ (color for trade table first row)
🔸 ‘Stats’ (color for trade table statistics row)
🔸 ‘Text’ (color for trade table text)
🔸 ‘Error’ (color for all errors if is made when trade is setup)
• Color for errors is for trade table and trade labels
🔸 ‘Fiat Price’ (by default enabled, show info for second fiat*
* if trade is in crypto and ‘quoted’ currency is not stable coin, like ETHBTC, or ‘Account Type’ is set to different currency
🔸 ‘Live Fiat Price’ (if ‘quoted’ currency enabled will show live exchange conversion)
🔸 ‘All Errors’ (enabled by default, show all error if trade setup is wrong)
• When error shows on trade, disabled this to see what|where is error
• Check below for more details
🔸 ‘Tool Tip (chart)’ (enabled show all tooltip on chart)
• Check below for more details
• When you are familiar with indicator, disable popup tooltip
💎 TOOLTIP
All possible tooltips have been added for easier understanding, especially for traders who are just learning how to place a trade. (when you perfect this indicator, you can turn off the tooltip in settings, and you can also normally use the lite version of this indicator, which does not contain all these futures)
🔸 ' Settings Tooltips’
🔸 ‘Chart Tooltips’
🔸 ‘Table Tooltips’
🔴 ERRORS
When you setup trade, not only a novice in trading, but also experienced traders can make a mistake and for this reason all possible errors are included in the indicator which will be shown on the chart by changing the color of the labels as well as on the trade table and in most of the cases and error text.
If the tooltip is enabled in the settings, you can see the reason for the error as well as the solution.
Here are some examples of possible errors.
Stay safe
PLAN YOUR TRADE AND TRADE YOUR PLAN
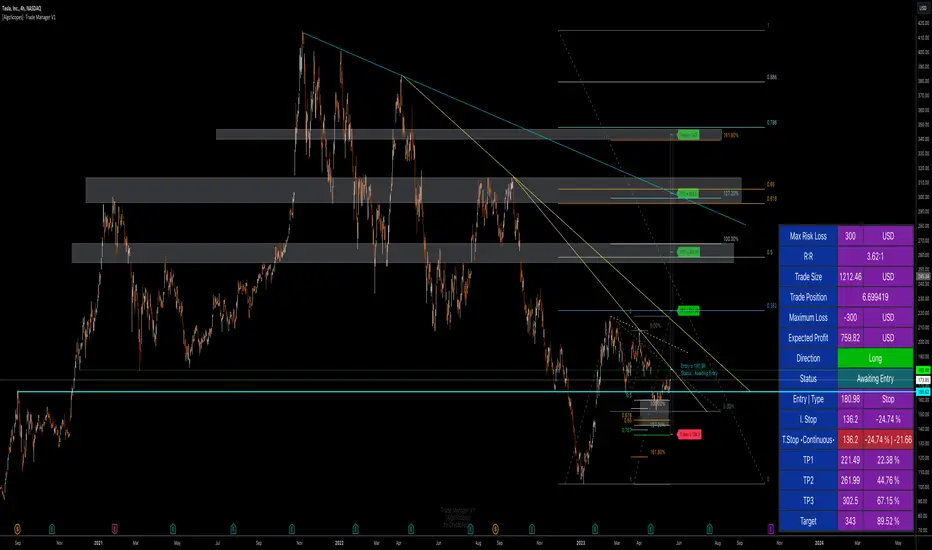
Consolidation Finder Expo [serkany88]It's relatively easy to create a repainting system where you can detect consolidation but it can be pretty hard to detect breakouts while the consolidation is happening live. This experimental approach came to my mind after brainstorming a bit.
What it does
This indicator DOES NOT REPAINT and try to show consolidation zones by coloring the bars or background to a selected color(default white)
How it works
In this approach we use weighted standard deviation of Vidya (Variable Index Dynamic Average created by Tushar Chande). The reason we use vidya is it's length is actually being adapted to volatility and lookback is dynamically adjusted. After getting vidya of base we also create same length vidya of high's and low's and get weighted standard deviation of those. After this we add and subtract those with base vidya and and get their average with our multiplier weight starting from the first bar. If our current value is higher than the average it means we are not in consolidation, else we are thus the bar and background will be painted.
How to use
Consolidation Finder can be used with your existing bot strategy as an additional filter or can be used with your manual trading system as an additional filter or detect breakouts. But be aware that you might need to tinker with length and multipliers in the settings depending on your timeframe to get best results possible before using it reliably. You can also enable the plots of vidya's from the style tab which is disabled by default to see how the deviations actually move if you are interested in it.

Cloud Levels [Import Price Levels]This script allows you to import TA and price levels from an external source. For example, you may do some TA on a different software but want to import it to TradingView. Or you may have a script or bot that calculates levels for you end-of-day. Or you may be part of a community that provides TA and levels. There are many different reasons why you may want to import levels from an external source.
All you need is a source for the data. The data format shouldn't really matter since it can usually be converted fairly easily to a custom format. Information about the necessary format can be found below.
The script currently supports:
Labelled lines with customs style and colors
Boxes / zones with custom fill color and borders
Fibonacci ratios
In the plans:
Channel support
Trend lines
The input format looks like this:
FIGURE 1 - Lines with labels
Columns: ,,,,;
Example: 1677724019999,3976.50,Label text,255/255/0/125,sol
FIGURE 2 - Boxes
Columns: ,,,,,,,;
Example: 1686715971428,4430.18,1686773561538,4409.52,68/98/194/15,1,1,153/204/255/204
FIGURE 3 - Fibonacci ratios
Columns: ,,,,,,,,
Example: 1656649151300,4588.75,1656649151300,3639,dot,1,3,0.236|0.382|0.5|0.618|0.706|0.786|0.886,170/200/255/76|170/200/255/76|170/200/255/76|0/255/0/76|255/153/0/76|255/153/0/76|255/153/0/76
*ratios and ratio colors are separated by '|'
*RGBA colors must look like this: 255/255/0/125, each value separated by '/'
*Line style s must be one of these values: dsh, sol or dot (dashed, solid or dotted)
Separate each item within the same figure with a semicolon (;), e.g for two labelled lines: 1677724019999,3976.50,Label text,255/255/0/125,sol;1677724019999,4026,Label text 2,255/255/0/125,sol
Only put a semicolon at the end if there is a new item after it.
Finally, put all figures together with '§' separator between each figure/category, in the correct order:
1 - Lines with labels
2 - Boxes
3 - Fibonacci ratios
The result looks like this for the examples above:
1677724019999,3976.50,Label text,255/255/0/125,sol§1686715971428,4430.18,1686773561538,4409.52,68/98/194/15,1,1,153/204/255/204§1656649151300,4588.75,1656649151300,3639,dot,1,3,0.236|0.382|0.5|0.618|0.706|0.786|0.886,170/200/255/76|170/200/255/76|170/200/255/76|0/255/0/76|255/153/0/76|255/153/0/76|255/153/0/76
An incorrect format will give you errors.
With basic programming skills you can create a simple tool to convert your data to this format, that's what I do. If needed, I may be able to provide a customized converting tool for this, PM if interested.

D-BoT Alpha ReversalsHello traders, today I'm going to share with you a strategy that I use very frequently. I wanted to share this strategy that I use in my manual trades by translating it into code. I'm sharing it with you with completely open source code.
RSI of ROC: The indicator initially calculates RSI (Relative Strength Index) on ROC (Rate of Change). This is a method that tracks the rate of price change (ROC) over a certain period and applies it to the RSI calculation.
Adaptive RSI: The code then calculates the RSI for all periods between the minimum and maximum RSI lengths. It takes the average of these calculations and names it as avg_rsi66. In addition, it checks whether each RSI value exceeds the determined overbought and oversold limits.
Signal Triggers: If both RSI of ROC and avg_rsi66 are above or below the specified overbought or oversold levels and the difference between these two values is less than the specified threshold value (Extremities Sensitivity), a signal is triggered. In addition, the color of the bar is also checked: An overbought (sell) signal is triggered for a red bar and an oversold (buy) signal is triggered for a green bar.
Signal Visualization: Signals are shown on the chart at appropriate places with "Sell" or "Buy" shapes. Also, each of these conditions is defined as an alert condition.
The general purpose of this indicator is to determine the turning points of the market. Overbought and oversold signals are based on the idea that the price may turn from these areas. That is, a "Sell" signal indicates a turning point where the price may start to fall, while a "Buy" signal indicates a turning point where the price may start to rise.
These types of indicators usually have some weak points:
False Signals: Like any kind of technical analysis indicator, this indicator can also give false signals. That is, you may get a "Buy" or "Sell" signal but the price may not move in the expected direction.
Market Conditions: This indicator may perform better under certain market conditions. For example, a trend-following indicator usually works well in trending markets, but can be misleading in range-bound markets. This indicator too can perform better or worse in a particular market situation.
Parameter Selection: The choice of the parameters of the indicator (ROC and RSI lengths, overbought/oversold levels, etc.) can significantly affect the quality of the indicator signals. Parameters should be optimized for various assets and time frames.
In conclusion, it would be better to use this indicator not as a standalone trading system, but in conjunction with other technical analysis tools or fundamental analysis. Also, it is always beneficial to test a new trading strategy on past data or on a demo account before trading with real money."
Stay tuned for more of my original strategies :)
Happy trading...

D-BoT Alpha Volume SpikeHello traders, Let me explain the code and provide an example of how to trade using this indicator.
The code you provided is a Pine Script indicator that combines multiple technical indicators, such as Supertrend, ADX, RSI, and MFI, to generate buy and sell signals. Here's a breakdown of the code:
User Settings:
The user can adjust parameters like overbought_limit, oversold_limit, volume_multiplier, volume_ma_length, volume_spike_multiple, lookback_period, and use_extremities_confirmation according to their preference.
Calculate Supertrend:
The Supertrend indicator is calculated using three different ATR lengths (supertrend_atr_period1, supertrend_atr_period2, supertrend_atr_period3) and corresponding factors (supertrend_factor1, supertrend_factor2, supertrend_factor3).
The supertrend_value1, supertrend_value2, and supertrend_value3 represent the Supertrend values, while trend_direction1, trend_direction2, and trend_direction3 indicate the trend direction (negative for downtrend, positive for uptrend).
Candle calculations:
The high and low values are checked to identify bullish and bearish candles based on specific conditions.
Volume Spikes:
Volume spikes are detected by comparing the current volume with a median volume over a specified lookback period.
If the volume exceeds a certain multiple of the median volume and the DI+ value is greater than the DI- value, an "up" signal is generated. Similarly, if the DI- value is greater than the DI+ value, a "down" signal is generated.
Additional Filters (RSI and MFI):
Relative Strength Index (RSI) and Money Flow Index (MFI) are used as additional filters.
The RSI and MFI parameters can be adjusted according to the user's preference.
The signals generated by the volume spikes are filtered based on RSI and MFI conditions.
Plotting:
The indicator plots shapes (triangles) to represent buy and sell signals.
The Supertrend lines are plotted using different colors and transparency levels based on the distance from the current price.
The "bodyMiddle" plot is used for filling the area between the Supertrend lines.
Example Trade Scenario:
Let's consider an example trade scenario using this indicator:
When the indicator generates an "up" signal (trendBuy = true), indicating a potential bullish trend, and all the confirmation conditions (RSI, MFI, Supertrend) are met, you can consider opening a long position.
Conversely, when the indicator generates a "down" signal (trendSell = true), indicating a potential bearish trend, and all the confirmation conditions are met, you can consider opening a short position.
Remember, this is just an example, and it's crucial to perform thorough analysis and consider other factors before making trading decisions. It's recommended to backtest the strategy, assess risk management, and apply appropriate position sizing techniques.
Please note that the code provided is a simplified version, and there might be additional factors and considerations specific to your trading strategy that are not included in this code. *******"I have also reviewed the following indicators, and the volume calculation approaches of my friends have been very helpful in creating this indicator: "Volume Spikes " © tradeforopp and "Volume Spikes & Growing Volume Signals With Alerts & Scanner" © FriendOfTheTrend."*******
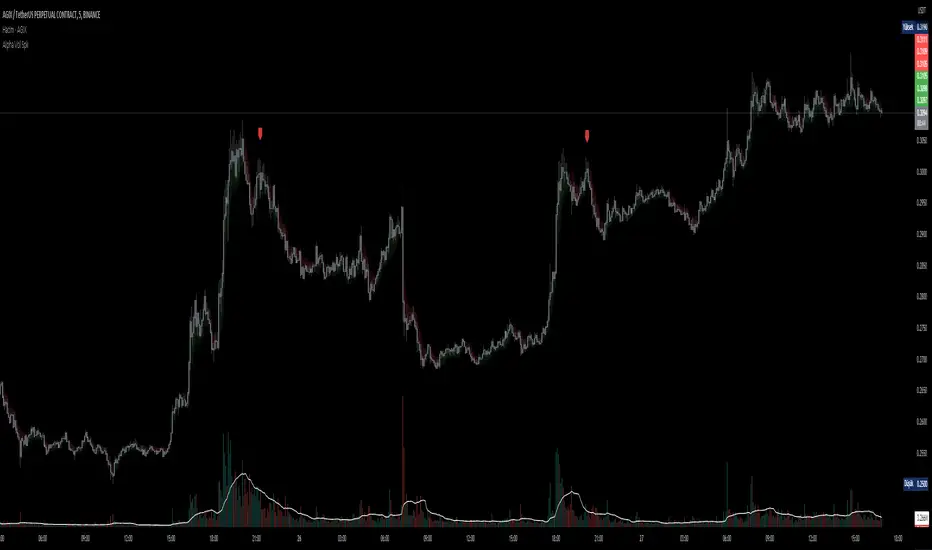
BBWAS Enhanced with Webhook Alerts and Money ManagementThe Enhanced BBWAS Indicator is a powerful tool designed to identify breakouts in the price of a security or asset. It utilizes Bollinger Bands, which consist of three lines: the upper band, the lower band, and the middle band (or basis). These bands help define the expected price range within which the asset is likely to fluctuate.
When the price breaks above the upper band or below the lower band, it indicates a potential breakout. A bullish breakout occurs when the price closes above the upper band, while a bearish breakout occurs when the price closes below the lower band.
In this enhanced version of the indicator, several new features have been added to provide more flexibility and functionality:
Webhook Alerts: Traders now have the ability to configure webhook alerts to trigger a bot or any external system. This allows for timely notifications when a breakout occurs, enabling automated actions or manual intervention as desired.
Multiple Moving Average Types: The indicator now supports different types of moving averages for increased customization. Traders can choose from popular moving average types such as Simple Moving Average (SMA), Exponential Moving Average (EMA) and Weighted Moving Average (WMA). This enables users to experiment and find the moving average type that best suits their trading strategy.
Money Management: To assist traders in managing risk, a money management feature has been incorporated into the indicator. It calculates the optimal position size or number of units to purchase for each trade, considering the desired risk per trade. By specifying a maximum risk per trade, traders can ensure that their position sizes are adjusted accordingly, helping to maintain risk control in their trading activities.
Dear traders, while we strive to provide you with the best trading tools and resources, we want to remind you to exercise caution and diligence in your investing decisions.
It is important to always do your own research and analysis before making any trades. Remember, the responsibility for your investments ultimately lies with you.
Happy trading!
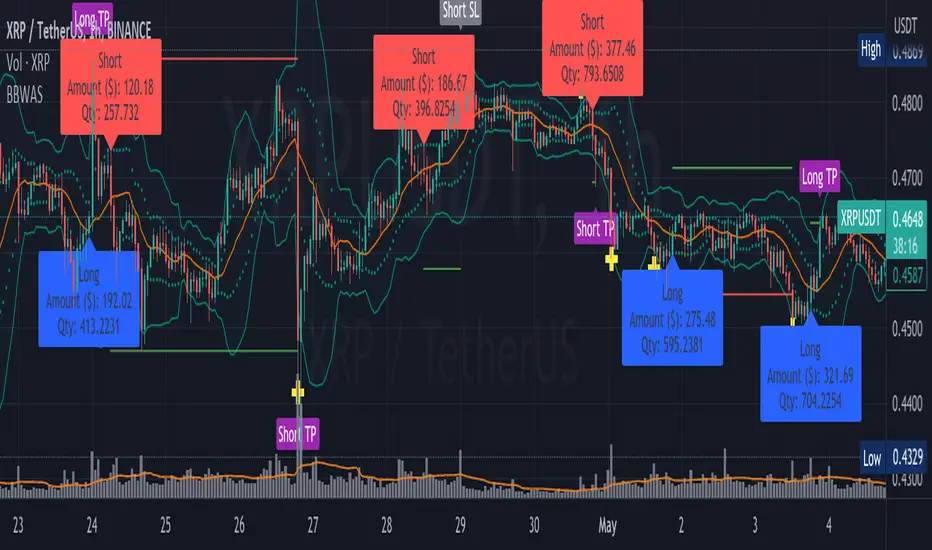
Bollinger Bands %B (ValueRay)One of the key features of this BB%B is its ability to highlight overbought and oversold conditions. This allows you to make informed decisions on when to enter and exit a trade, helping you maximize your profits and minimize your losses.
- Bollinger Bands %B with the ability to change to a different Time Frame.(Defaults to current Chart Time Frame).
- Ability To Turn On/Off Background Highlighting if BB %B is Above/Below 0 / 1 thresholds.
- Ability To Turn On/Off Background Highlighting when BB %B Crosses back above/unser 0/1 thresholds.
---
My personal recommandation use: combine with CM_Ultimate RSI Multi Time Frame (ChrisMoody) and have solid oversold/overbought levels, when hes RSI and my BB %B are bot red/green

Spaghetti by RainbowLabsWhen I started trading, very few people gave me a hand or even a small piece of advice. One of them was @btc_charlie. From Charlie, I first saw the spaghetti chart, and he explained to me how it was useful in identifying which coin made the most sense to trade at a specific time.
In practice, it worked like this: in the "add" section, you add all the pairs you want and overlap them on the chart, creating the spaghetti chart. Although it worked, and still works, this way, I wondered if it would be better to write an indicator that does the same thing, maybe less invasive on the chart, that you can call as many times as you want and in different versions. In short, I tried to recreate the same thing but potentially better, let's see if I succeeded.
Introducing Spaghetti chart by RainbowLabs:
This indicator takes 20 different pairs as user input and works with any pair on any exchange provided the name is spelled correctly. In the settings, there are four columns: the first for the exchange, the second for the ticker, the third for the base pair, and lastly, the color. Again, it works with any pair on any exchange, but if you put something that does not exist or is misspelled, it will cause the script to error.
The second thing to do is to set when our spaghetti will be reset. By default, it resets every hour, but you can change it to any preferred timeframe in the menu, keeping in mind that we will write the timeframe in minutes, not alphanumeric. For example, 4h will not be four hours, but you will have to write 240.
In the settings, we can also change the position and size of the table.
How it works:
All pairs are reset when the timeframe defined by the user in the settings changes. The script then calculates the percentage difference from that moment onwards for each pair at the closing of the candle of the timeframe we are in. For example: by default, the timeframe resets every hour, so we will use it on one minute. It does not make sense on larger timeframes, and you will have to increase the reset timeframe.
How to use it:
Risk on\off BTC vs alts
As Charlie says in his tweet: "should I be risk on or off?" for SIX:ALTS rule might be ">70% of Alts recovering after a dip."
Identify a dip on bitcoin and compare what happens immediately after. If more than 70% of alts gain more than BTC, it may be better to remain positioned in alts. When the opposite happens, it is better to stay on BTC or stable.
Sell-off, Rally
During a significant sell-off or rally, it is important to analyze which coins were performing better or worse in the immediate past. It is statistically more profitable to trade those pairs that were over-performing, positively or negatively, just before the event.
Arbitrage and Triangular Arbitrage.
While it may be difficult to find large arbitrage opportunities in current market conditions, we can use tools to identify the best price of the same pair on multiple exchanges and compare it with one or multiple pairs on other exchanges. Having a comprehensive view of the market can be useful for anyone who is not using advanced trading bots to find arbitrage opportunities.
Quick Screener
You can add multiple spaghetti indicators to a single chart, and with the paid version of TradingView, you can use multiple layouts to plot as many coins on as many exchanges as you want. In the picture, you can see 240 pairs on four different exchanges all together. This feature allows you to quickly screen for potential trading opportunities and identify trends across multiple pairs and exchanges.
Known issues:
When the currency exchange rate is equal to 0.0000, the plotted line may not be visible.

Legend Scanning System - Telegram SenderHello traders, I'm Only Fibonacci.
This is what i posted, not really an indicator or strategy. An alarm mechanism.
What does it do?
First, you select a period during which the vehicle will scan.
Then, with this system, you adjust the settings of the strategies installed on our vehicle. Then you select forty symbols and specify which strategy you want the symbols to be scanned.
We come to the alarm setting screen, select the alarm, and enter your telegram bot's token-hosted message request link from the webhook section. You should contact me for assistance in these matters.
You can see most of the settings in the image below.
You can see most of the settings in the image below.
Important note: The period of the open graph must be less than the scanned period. Otherwise, the results may be erroneous.
Strategies will be constantly updated and become more customizable.
Proper use of this tool gives you:
It serves to scan different strategies on forty symbols different instruments of your choice. And not only that, you will receive these results in telegram.
The strategies loaded in these scans consist of the strategies in the techniques section in tradingview.
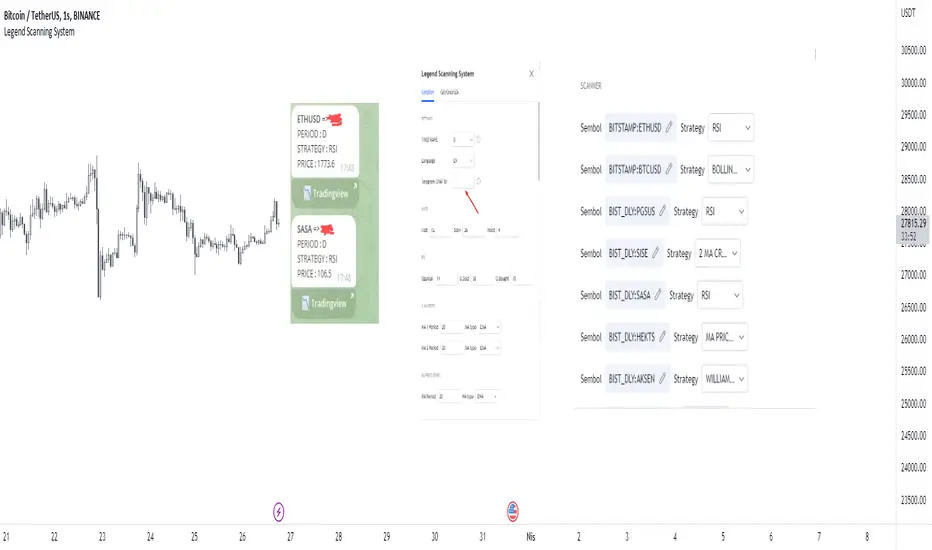
Vertical Lines 2A vertical line plotting function is missing in Pinescript. This is another method to plot vertical line on a chart, and an improvement on my previous script "vertical lines" .
The script hacks the plotcandle function to display just the wicks without the body. This hack simulates a vertical line. The body of the candle is non-existing since the open and close are the same and its color is set to null. The wicks are abutting resulting in a continuous vertical line.
Drawbacks include inability to set width and transparency of the lines. The plotcandle function does not allow setting the width and transparency of the wicks. This feature would be desirable.
The crossing of the RSI of overbought and undersold zones is used as an example in this published script. Any indicator can be used and this script can be executed on any other indicator by using "add indicator" on the desired indicator, and selecting the indicator as the source. I added crossover lines on the plotted RSI as an example.
//////////////////////////////////////////////////////Breakdown of the script////////////////////////////////////////////////////////
The src input determines which price data is used for the highest value calculation. By default, it is set to the close price.
The length input determines the length of the RSI calculation. By default, it is set to 14.
The mult input determines the multiplier of the highest value that is used to determine the height of the vertical lines. By default, it is set to 100%, meaning the lines will reach the highest value in the dataset.
The top and bot inputs determine the overbought and oversold levels for the RSI. By default, they are set to 70 and 30, respectively.
The current_rsi and previous_rsi variables calculate the RSI values for the current bar and the previous bar, respectively.
The hi_value variable finds the highest value in the dataset, and the hi variable calculates the height of the vertical lines based on the highest value and the user-defined multiplier. The lo variable calculates the distance between the highest value and the current price data.
The uph, dnh, upl, and dnl variables determine the height and low of the vertical lines for when the RSI crosses overbought or oversold levels.
The if statements check if the RSI has crossed overbought or oversold levels and set the uph, dnh, upl, and dnl variables accordingly.
Finally, the plotcandle() function is used to plot the vertical lines on the chart. The open and close values are set to the src input, and the high and low values are set to the uph, dnh, upl, and dnl variables. The bordercolor argument is set to na to hide the borders of the lines, and the wickcolor argument is set to green or red, depending on whether the line is an overbought or oversold crossover.
/////////////////////////////////////////////////////////////////////////////////////////////////////////////////////////////////////////
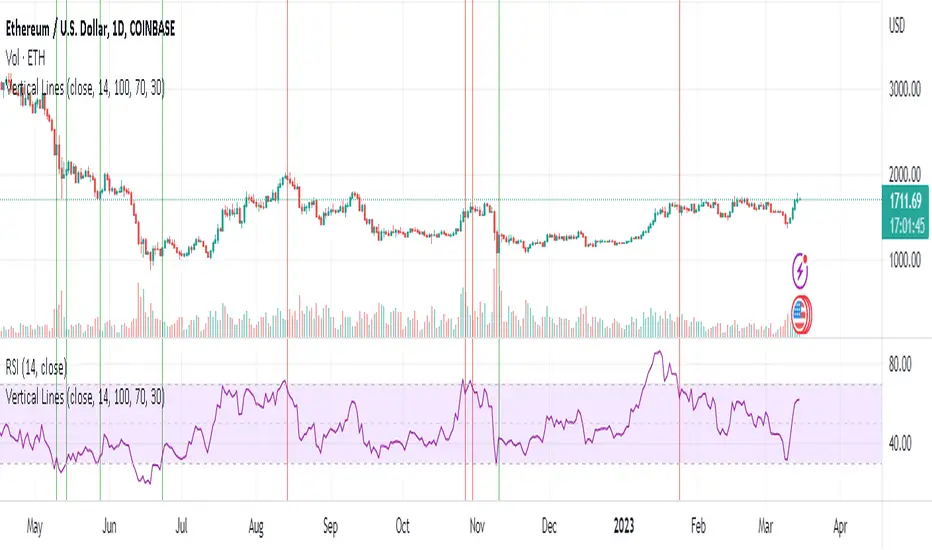
Buy Sell IndicatorThis Buy Sell Indicator uses price action calculations to determine the bullish or bearish nature of the current market and then calculates if the price action is strong enough to give a signal. The indicator is fully adjustable so you can fine tune it to fit your specific trading style with Scalp Mode, Swing Mode, Long Swing Mode and candle trailing length. It also has an automatic trailing stop loss and take profit features that can be customized.
For price action identification, scalp mode looks at the candle body, candle wicks and size of the body and wicks and compares all of that to the previous candle to see if it is bullish or bearish. Swing mode will compare the current candle to the last 2 candles and long swing mode will compare the current candle to the last 10 candles. It’s looking for higher highs & lower lows, if the candle body is large or small and much more.
There are also filters that prevent signals from being given when the candle is small or has not made a higher high or lower low compared to the previous candle and multiple other filters to help hold positions longer. Once the price action direction has been confirmed, then the script looks at a massive amount of other calculations to determine if a signal should be given or not. These calculations are made up of all of my best indicators combined into a master signal generator as well as more new calculations from things I have learned over time and tested extensively that have not been made available to the public until now.
Price action as well as many other factors will all have to be confirming the direction before a signal can come in, but it reacts very quickly so it can give early signals at the first sign of reversal. Fine tune your settings to match your trading style from within the input settings and then look for potential reversal areas and take signals that appear in that reversal area for the highest probability of winning trades. I decided not to include any support or resistance or similar tools in order to keep the indicator lightweight and respond as fast as possible as well as update the candles as quickly as possible. This also lets you keep your charts clean and only use the support & resistance tools that you prefer since everyone has a different trading style.
HIGHER TIMEFRAME AND/OR MARKET SCANNER
There is also a higher timeframe scanner available as a separate indicator titled Buy Sell Signal Scanner that you can find on my profile. It can be customized to show you up to 8 higher timeframes of your current ticker or any other ticker you like. This is useful for trading with the trend of the higher timeframes or you can set it to the same timeframe as your chart and scan other tickers that usually move together or opposite for extra confirmation. Each ticker/timeframe will be displayed in a table on the chart and colored green or red depending if it is currently bullish or bearish. If you are using a different timeframe than the current chart, then it will display the timeframe next to the ticker name.
HOW TO USE
CANDLES
The candles will paint blue or orange according to the price action detected. This can be customized or turned on/off and will follow the price action according to the trade mode settings. Using these candle colors helps to get rid of anxiety when watching candles come in that are in the opposite direction of your trade. I highly recommend using this feature as it helps you control your emotions much better during trading.
TRADE MODE
The trade mode settings let you choose between Scalp Mode, Swing Mode and Long Swing mode. They all use the same price calculations, but each mode has its own filters to hold through ranging price action in a slightly different way. You can also adjust the candle trailing length to make it hold positions even longer. The candle trailing length will not let a signal come in until there is a higher high or lower low than the previous X number of candles from this setting.
Scalp mode will get you in and out of positions the earliest. Swing mode will hold signals longer by filtering out ranging price action. Long swing mode uses even more filtering to hold positions even longer than swing mode and let price range more without calling out every move. Each one of these modes will also be affected by the candle trailing length.
It should be noted that using swing mode and long swing mode or increasing the candle trailing length will make the signals not perform as well when price action is whipsawing up and down and also will not have as early of entries and exits as scalp mode due to the range breaks that are needed for a signal to be given. That being said, it will hold positions much longer when markets are trending and still have great entries and exits, so use the longer settings when markets are trending and then switch to scalp mode when the market is chopping around and moving sideways for best results.
Scalp Mode
Swing Mode
Long Swing Mode
STOPLOSS
There is an automatic stoploss feature as well. It calculates the average candle height and adds/subtracts that from the highest high or lowest low of the past X number of candles according to your Stoploss Candle Trail Length. Use a lower number for a tight trailing stoploss and increase the number for a more loose stoploss. You can also customize the color of the stoploss line and label or turn it off if you prefer. The stoploss will update on every candle for proper trailing but it will not switch to an opposing signal until the candle closes with a new signal.
TAKE PROFIT
There is an automatic take profit level generator as well that also uses the average candle height for its calculations. There are 3 settings that let you set the average candle size multiplier for each take profit level. The default settings are evenly spaced at 3, 6 and 9 times the average candle height from where the most recent signal locked in at candle close. Adjust these numbers to suit your preference. You can also customize the color of the take profit lines and label or turn it off if you prefer. The take profit levels will not change to an opposing signal until the opposing signal is confirmed on the candle close.
Auto Stoploss & Take Profit
SIGNALS
The default signals are green and red arrows. The color can be adjusted in the settings or you can turn the bull or bear signals on or off if you only want entry signals for the direction of the trend.
VOLUME SPIKE SUPPORT & RESISTANCE
There are volume based auto support & resistance levels that are off by default, but can be turned on in the settings. It calculates the average volume over multiple periods and gets the average of that and then looks for volume spikes that were greater than the average, multiplied by the volume spike multiplier in the settings. If set to 3, then the volume spike will need to be 3 times or higher than the average volume bar for a level to show up. Increase or decrease this number to get more or less levels.
VOLUME WARNING
If volume is very low compared to normal, then a volume warning label will appear at the top of the chart letting you know that volume is very low and to trade with caution. I recommend not trading during those times though as price can whipsaw very easily.
ALERTS
There are also alerts that can be triggered for buy signals as well as sell signals. They are set to only send signals when the bar is confirmed so you won’t get alerts for signals that repaint while the candle is still open. You can use these alerts to send signals to your own trading bot if you choose to.
MARKETS
This buy sell indicator can be used on any market with price data such as stocks, crypto, forex and futures.
TIMEFRAMES
This buy sell indicator can be used on any timeframe.
PAIRINGS
We recommend pairing this Buy Sell Indicator with our Buy Sell Signal Scanner so you can check other timeframes and trade with the trend or use the scanner to look at other markets that move together or opposite of the ticker you are trading for extra confirmation of direction.
