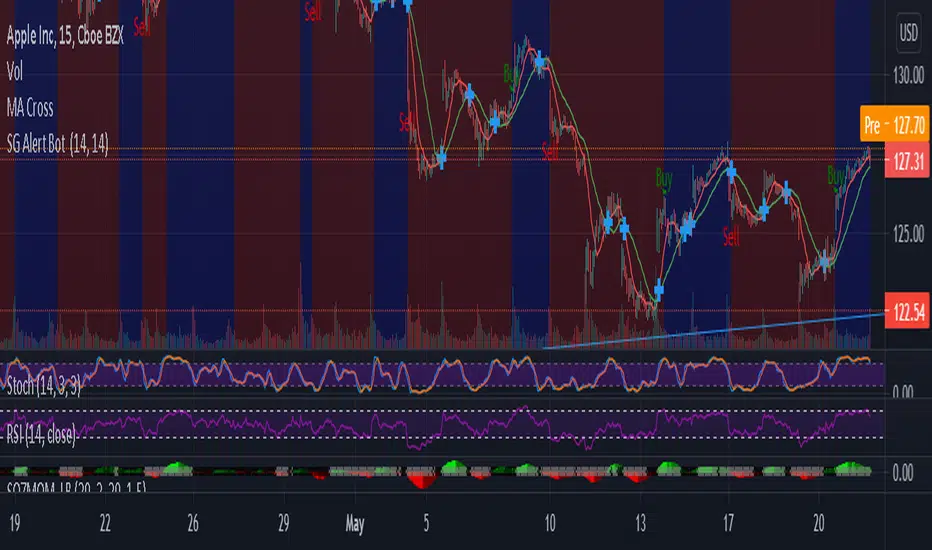
Six Moving Averages Study (use as a manual strategy indicator)I made this based on a really interesting conversation I had with a good friend of mine who ran a long/short hedge fund for seven years and worked at a major hedge fund as a manager for 20 years before that. This is an unconventional approach and I would not recommend it for bots, but it has worked unbelievably well for me over the last few weeks in a mixed market.
The first thing to know is that this indicator is supposed to work on a one minute chart and not a one hour, but TradingView will not allow 1m indicators to be published so we have to work around that a little bit. This is an ultra fast day trading strategy so be prepared for a wild ride if you use it on crypto like I do! Make sure you use it on a one minute chart.
The idea here is that you get six SMA curves which are:
1m 50 period
1m 100 period
1m 200 period
5m 50 period
5m 100 period
5m 200 period
The 1m 50 period is a little thicker because it's the most important MA in this algo. As price golden crosses each line it becomes a stronger buy signal, with added weight on the 1m 50 period MA. If price crosses all six I consider it a strong buy signal though your mileage may vary.
*** NOTE *** The screenshot is from a 1h chart which again, is not the correct way to use this. PLEASE don't use it on a one hour chart.
Cerca negli script per "bot"

TV signal for DCA backtestThis script allows you to backtest Trading View's "Technical Ratings" (Buy, Strong buy, Sell, Strong Sell) using Gavin's backtest script.
To use it add the backtest script to the chart together with this script and then from the back test settings connect the external indicator. You should select "TV Signal" as the source.
Backtesting works best on the 5m chart, but you can still change this script from its settings to higher timeframes.
Encoding
Buy is 1
Strong Buy is 2
Sell is -1
Strong Sell is -2
In the backtest script you can decide which rating you want to use for open deal and which one for close deal.
For example, if you were backtesting a long bot you could enter a long position when TV signal is Buy (1) and close the deal when TV signal is Sell (-1).
You have the full flexibility to decide which technical rating to use for your backtesting.
Enjoy!

Yen PPLUse this Indicator to plot Psychological Price Levels on Yen Pairs, Set an alert to notify you when Price Action breaks a Psychological Price Level
This Indicator plots a 700 pip range.
When you first apply the Indicator a "Confirm Inputs" box will appear. Set the "Initial Value" box to a Flat .00 price about 350 pips below current Price Action.
This will set Current Price Action in about the middle of the range.
The PPL 1,2 and 3 "top" and "bot" settings represent the tops and bottoms of your Psychological Price Levels and allow you to adjust their location and width.
They are currently set to "Quarter Point Theory" and 2 pips wide.
You will probably want to leave PPL4 alone as it represents your Flat .00 numbers unless you want to adjust its width.
The Brightness and color can also be adjusted in "Bgcolor"
Set your alerts and enjoy.
Comments, Suggestions and Feedback are appreciated, Thanks for checking out the Indicator.

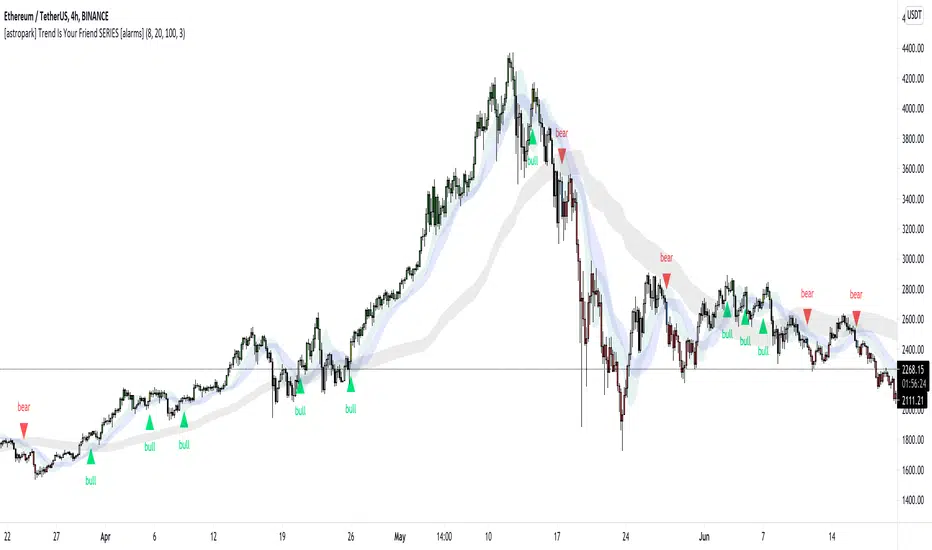
[astropark] Trend Is Your Friend SERIES [alarms]Dear Followers,
today I'm glad to present you an indicator which is a mix of three indicators of mine: Trend Is Your Friend Series !
As you may easily understand from the name, this indicator incorporates all 3 Trend is You Friend indicators I made in past.
This way you can control all of them just with one indicator.
Of course this comes with some useful integration features:
a bull green triangle appears when all trends are bullish (you can set an alert for this)
a bear purple triangle appears when all trends are bearish (you can set an alert for this)
bar coloring reflects the bullish/bearish integration too
you have an option to enable/disable all trends buy/sell signals
you have an option to hide trend clouds borders (chart will be way cleaner this way)
you can still customize each trend indicator settings and set alerts on each trend individually
you can enable/disable heikin ashi analysis
As per Trend is Your Friend V1/V2/V3, this indicator is for higher timeframe trading, from 4h and above is suggested.
This indicator is pretty good for both Swing and Scalping , you can run it over a bot or use it on Renko chart!
If you are a scalper, you will love suggested entries for fast profit. You can run it on 1h timeframe in this case (below is not suggested, there is "no-trend" below 1h!). If you are used to scalp trading, be sure to close each trade whenever you feel happy (a proper trailing stop strategy is suggested for example).
As I always say, all tools are great if you use them correctly: this is not the "Holy Grail", so always use proper money and risk management strategies.
For your reference, here you can see original basic indicators that were integrated here:
V1 backtesting strategy
V2 backtesting strategy
V3 backtesting strategy
This is a premium indicator , so send me a private message in order to get access to this script.
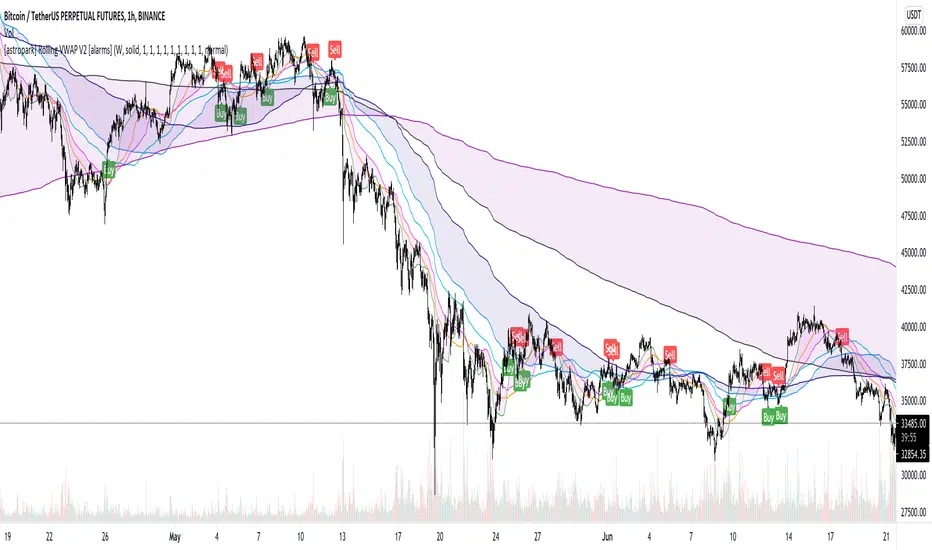
[astropark] Rolling VWAP V2 [alarms]Dear Followers,
today I'm glad to present you yet another awesome Analysis Tool and Strategy, that you may like to use in your trading journey: Rolling VWAP V2 !
This is an upgraded version of my "Progressive VWAP" analysis tool (progressive and rolling are synonymous for me), its description describes quite well what a progressive/rolling vwap is and why they are important to watch:
This indicator can print automatically for you many important Rolling VWAPs:
Daily (D)
2 days (2D)
3 days (3D)
4 days (5D)
Weekly (W)
2 weeks (2W)
Monthly (M)
Quarterly (Q)
Yearly (Y)
As an indicator it will let you:
enable/disable each rolling vwap, change its color and line style and thickness
enable/disable labels and/or price on labels, as well as change their size
As a strategy it will let you:
enable/disable buy/sell signals
choose which strategy to use (all based on rolling vwaps of course)
choose a starting date & time from which to start backtesting
enable/disable individually long and short setups in the backtesting
You should choose low timeframe rolling vwap strategy if you are on a low timeframe, while higher timeframe rolling vwaps are good on medium-high timeframes.
For example D-2D-3D rolling vwap strategies are good at 1h or below, the others on higher timeframes. Backtesting results will help you in understanting this point quite easily.
This indicator works on every timeframe, market and pair. By the way it must be said that, as a bot strategy it has been tested and designed mostly for Bitcoin trading and it works best on 1h or above.
As I always say, all tools are great if you use them correctly: this is not the "Holy Grail", so always use proper money and risk management strategies.
This indicator is the alarms version of the backtesting one you can see here below:
This is a premium indicator , so send me a private message in order to get access to this script.
Saper Aude [Alerts]Sapere Aude Strategy - Alerts
Trend based scalping strategy, to work on lower timeframes (15Minute - 1 Hour)
Calculations on ATR, strategy uses extra conditions to help filter out bad trades.
How to use the Indicator?
Simple as when green line shows below, that can be either a good entry point or a signal to start building limit orders on the plot.
I use the ATR as a trailing stop loss for exit.
vica versa for entering shorts. The strategy is only set up to take long positions though.
This is a great scalping strategy for bots in Ranging or up trending markets.
This scripts has 5 variations built within it which are fitted for certain coins & their timeframes
The coins included are
BTC /USDT 1 Hour
ETH/USDT 1 Hour
ADA/USDT 30 Minutes
DOGE/USDT 15 Minutes
LUNA/USDT/15 Minutes
You should find the preset alerts for these when you click "Add aler" on this indicator
You will see in the settings what default Stop losses I used
The script is written in Version 4
The strategy performs best on the Binance listings

Smart AlertsThis indicator provides back-tested signals and alerts from multiple technical indicators.
No more guessing whether or not you should trust an indicator. See your indicators' past performance at a glance.
No more false alarms. Disable re-painting of signals.
When multiple indicators overlap, a Confluence indicator will print (large triangle). With your settings properly tuned, this will show a HIGH probability of a move.
Current Signal/Alert Options (more to come):
RSI Oversold
RSI Overbought
EMA Crossing Up
EMA Crossing Down
Buy Signal Confluence
Sell Signal Confluence
Instructions:
-Enable/disable individual indicators so you can fine tune one at a time
-Adjust the indicator's settings
-Adjust your trade parameters (Max Wait, Take Profit %). Signals that would have given the desired profit in the time allowed will be painted orange.
-Repeat this process with each indicator until you're satisfied
-Set-up alerts

Smart EMA SignalsThis indicator starts by plotting each time the price action crosses above or below the EMA, of which you can tune the timeframe and duration.
It then takes it a step further and plots whether or not that indicator would have given you a profitable trade, of which you can also tune the parameters (Max wait time, and % Profit).
Once you have your EMA tuned to your liking, set up alerts to notify you of a golden opportunity.

QFL single TF with alertsBacktesting compatible QFL pine script w/alerts
This version of QFL was made based on this one:
From author:
www.tradingview.com
I made the following additions according to my requirements:
- I need to use pine script 4
- I needed to avoid repainting issues so I'm not calling directly security, I'm using the wrapper function.
- There might be still repainting issues when you use "max base age" which uses the function "barssince" so be careful, you can disable it by setting its value to zero.
- Alerts so I can use it for automated trading and bots
- In order to make this signal compatible with the backtest script there's an option provided in the settings. If you enable this option this indicator will plot 1 whenever there's a BUY signal. This will allow the backtest to pick the "QFL Buy" from external indicator so it can perform the backtest.
I recommend some of these settings to start playing with the chart in 15 min / QFL in 1, 2 or 4 hours.
The higher the TF the more conservative.
QFL with 3.5% is pretty popular but you can try higher QFL percentage settings for a more conservative approach.

CRYPTOPRODear traders,
Welcome to CRYPTOPRO indicator. Only for crypto markets! This is an invite only script, please PM me to request permission for testing and access.
This indicator is developed as a scalping, intraday or swingtrade strategy.
Been working on indicators for years now, now back to trading again and made the best possible indicator for different timeframes.
The indicator uses market data, multiple timeframe ma/rsi charts and price action for determining a long or short strategy.
The indicator does not repaint!
I have made the indicator as easy as possible to use with added background colors.
How to use:
- Long strategy: when background turns to green after bar closing.
- Short strategy: when background turns to red after bar closing.
Alerts:
- Alerts are included in the indicator and are very simple to use.
- Alert "buy" for long strategy (green background)
- Alert "sell" for short strategy (red background)
- The alerts can also be used for automated trading/bot trading.
Time Frames :
- Can be used for all different timeframes.
Chart candles:
- Indicator is to be used with standard prince candles.
Note:
- Trading and financial markets are always risky and unpredictable.
- All trades made based on this indicator and his results are always your own responsibility.
- As an author i will not be held responsible for any of your trading profit or loss. Always be cautious when trading.
Charts can be applied to all TV supported crypto charts.
If you find the indicator usefull share your support and feedback in the comments.
Any questions PM me for more info.Thank you!
DISCLAIMER:
No sharing, copying, reselling, or any other forms of use are authorized for our scripts / strategy, and the information published with them.
This script / strategy is strictly for individual use.
This is not financial or investment advice. Investments are always made at your own risk and are based on your personal judgement.
NYTRADE is not responsible for any losses you may incur. Please trade wisely.

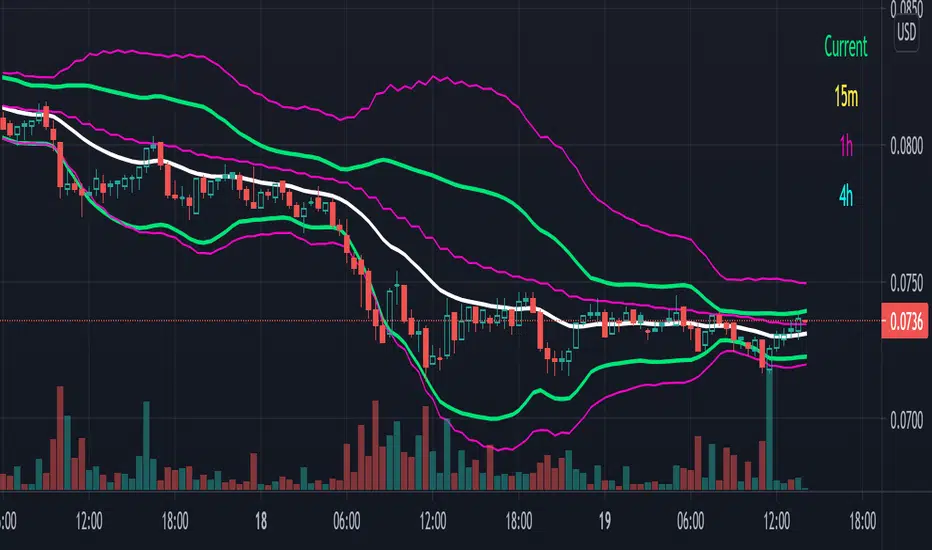
Multiple Timeframe Bollinger Bands - 15m, 1h, 4h plus currentI could not find any other indicator that does this on TradingView. I like to trade whilst looking at multiple time frames and on my desktop I can do that because I have three monitors. I went on vacation recently and I had to trade using my laptop. It sucked tabbing back and forth so I wrote this script.
I personally trade on a 1m chart with indicator data from longer charts so I get the fastest resolution possible. TradingView's horrid and useless idea posting algorithm won't let me post this script in that way so here's a 30 minute chart for posterity.
By default it shows only the time frame you are on but you can use the gear icon on the indicator to turn on 15 minute, 1 hour or 4 hour Bollinger bands. There is a color coded guide on the upper right hand side (yay for the new table feature) so you can see what you are getting yourself into. I have 1h bands and current frame (30m) bands on in the picture.
Use this on a fast chart with slower bands applied. It doesn't work all that well when you use it on a longer time frame with faster bands applied. I use this one a 1m or 5m chart with 15m and either 1h or 4h bands applied typically.
I am making use of this available for free though if you want my code to make adjustments it is available for a small donation to cover my development time; PM me if you are interested. My best bot strategies have all been based on this script so if you want to use this as a jumping off point for your Bollinger band-based strategies this will work well though you do need to buy the code from me for that.
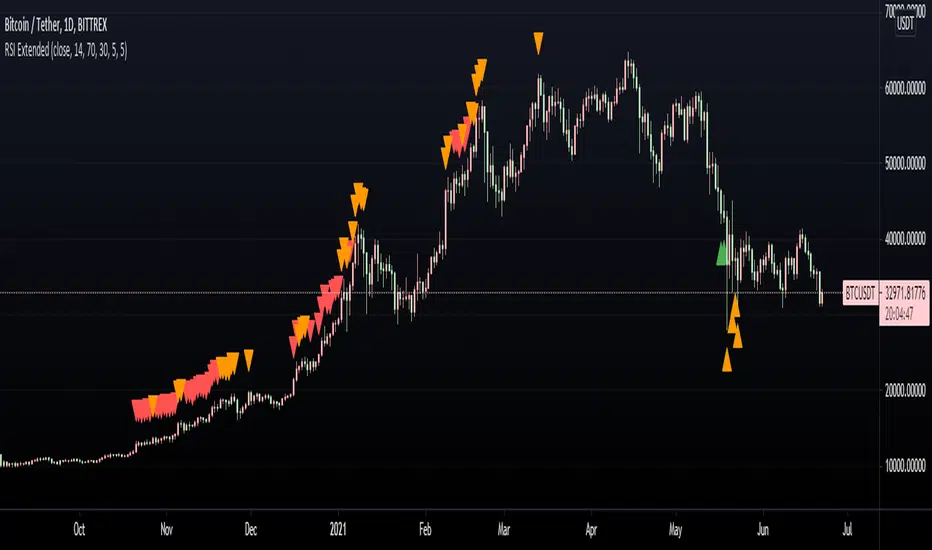
RSI ExtendedThis script is intended to print signals on the main price chart and send alerts when the RSI is overbought or oversold.
You can customize the source of the signal (open, close, etc), as well as oversold/overbought levels, and RSI length.
Support Resistance ZonesSupport and resistance zones are used across all markets by traders and bots alike to identify liquidity and possible bounce areas. This script automates the drawing of those zones based on a number of variables, such as lookback period, channel width, number of touch confirmations and more.
This script also implements a some useful alerts so you can rest easy until the market hits a point of interest:
Enter SR Zone
Exit SR Zone
Break Upper Resistance
Break Lower Resistance

Spread InformerThe goal of this study is to produce information about the average size of candles in the given time frame. This can be used to help dial in your market making bot spreads.

Dump Detector - Hull Moving AverageDump Detecter uses HMA (Hull Moving Average) to detect dumps/downtrends. Can be used as an exit trigger for long bots or an entry trigger for short bots. Pump signals can be turned on with tickbox.

Carpe Diem 2.0 [Alerts]Carpe Diem 2.0 Alerts, Still automating the original Carpe Diem scripts, now the V2 uses heavy Volume based filtering to help only trade in bullish markets,
Search for Carpe diem 2.0 to see backtest results
This Alerts script has been created to help with bot Automation allowing you to create custom alerts
This script has 10 variations built within it which are fitted for the coins differnt coinditions
The coins included are
DOGE/USDT 4H
XRP/USDT 4H
LINK/USDT 4H
MATIC/USDT 2H
SRM /USDT 6H
COTI/USDT 4H
DOT/USDT 3H
TRX /USDT 4H
RSR/USDT 4H
ATOM/USDT 4H
How to use the Indicator
You can change what plots are shown in the settings Cog, I toggle all plots off apart from the coin I am trading
When the Volume Average line is green, the market is up trending and will be looking for a trade whereas when they are red, the market is in a sideways or downtrend.
You can ignore the color of the line and just base the bullish / bearish bias based of the Volume line being above/below 0
The script is written in version 4
When you go to create an alert with this script you will see 20 options, 10 for opening longs on certain conis and then 10 to close them
This strategy performs best on the Binance listings

[blackcat] L5 Whale Jump Screener 12 AlertsLinkage Authorization:
When you obtain any one of the following technical indicators authorization, the other one will automatically obtain a free authorization for the same length of time:
1. L5 Whale Jump Screener 25 NoAlerts
2. L5 Whale Jump Screener 12 Alerts
Discount Authorization:
While you are authorized for any of the following technical indicators, this indicator will only need to pay 200TVC (not per month) but you obtain the authorization length as long as your longest one among all invited-only indicators .
1. L5 Whales Jump Out of Ocean X
2. L5 Zen Master
Level: 5
Background:
L5 Whale Jump Screener 12 Alerts is a screeener which is based on principle of L5 Whales Jump Out of Ocean X, but it has its own scheme to work as a screener with alerts, which can track 12 trading pairs at the same time. With this indicator, you can track target in your list with remote alerts from TV to your mobile or emails.
At beginning, I want to incorporate this function to "L5 Whale Jump Screener 25 NoAlerts". However, I found it rather difficult to make it happen. One reason is that adding alerts will further increase computing power of it so that TV will not be functional for overloaded indicators. The only way to make a screen plus alerts happen is to reduce the number of targets allowed in the screener until TV rules are in compliance. The other reason is that I found alerts were conflicting with screener function in TV system during my testing. Because if you put many trading pairs that are highly correlated into inputs of the screener indicator. Huge amount of alerts may be produced at the same time, and TV system has its own protection scheme. If too many alerts happened at the same time, it will block and stop the alert scheme immediately. Therefore, I build this one for anyone who need alert function. But, remember, make input tikerids as NOT correlated as possible to prevent TV to shut down your alert for this indicator.
Function:
By tracking multiple targets with alerts, you will own the capability to tracking multiple markets. This ability will let you know the specific situation of the unconnected market and the trading targets in time in the rotating transaction. The alert function will remind you of the current status of multiple markets via mobile phones and emails.
Inputs:
12 tickerids for your customization
Key Signal:
Long Whales / Banker Pump--> fuchsia color area with 0% transparency
Close Long Whales / Close Banker Pump--> red color area with 0% transparency
Short Whales / Banker Dump --> yellow color area with 0% transparency
Close Short Whales / Close Banker Dump --> green color area with 0% transparency
Long Waves Start--> fuchsia color area with 50% transparency
Short Waves Start --> yellow color area with 50% transparency
No Whale or Wave Signal --> gray color rea with 50% transparency
Pros and Cons:
ONLY suitable for discretionary trading, and does NOT support automatic trading system/bots with alerts.
Intuitive and effective, the output signal is more reliable after multi-indicator resonance
For who does not alert function but track more targets, you can choose anther indicator: L5 Whale Jump Screener 25 NoAlerts.
Why 12 Targets are Supported?
From the principle of TV principle, it should be possible to track up to 40 targets at the same time. However, TV has another condition that restricts server computing resources. When the two condition work at the same time, for the whale jump algorithm, the number of targets it can track at the same time will drop from 40 to about 26~27! In addition, this indicator needs to support the display function from the daily time frame to the 1min time frame. Therefore, the requirements for computing resources have further deteriorated. In the end, the maximum tracking number I obtained by compromise is 25 to ensure that this indicator can support 1min or second level normal display without report an error. Based on above fact, adding alerts will further increase computing power needed for this indicator. To prevent TV shutdown this indicator w/ alerts, only 12 tickerids are supported based on this algorithm. Also, due to quite different user scenarios between these two screeners, two versions are published for different group of traders with a linkage authorization schmeme.
Remarks:
My fourth L5 indicator published
Closed-source
Invite-only
Redeem Fee Life Lock Guarantee
Although I take the efforts to inform the script requesters that the best way to promote trading skills is to learn from the open source scripts I released by themself and to improve their PNIE script programming skills, there are still many people asking how to obtain or pay to use BLACKCAT L4/L5 private scripts. In fact, I do not encourage people to use Tradingview Coins ( TVC ) / Cryptocurrency to redeem the right to use BLACKCAT L4/L5 scripts. However, redeeming private script usage rights through TV Coins/ Cryptocurrency may be an effective way to force more people to learn PINE script programming seriously. And then I can concentrate on answering more valuable community questions instead of being overwhelmed by L4/L5 scripting permission reqeusts.
I would like to announce a ‘Redeem Fee Lock Guarantee’ program to further simplify the L4/L5 indicator/strategy utility offering and distinguish itself from the competition. ‘Redeem Fee lock guarantee’ is one of the major initiatives by BLACKCAT as a part of overall value packaging designed to guard BLACKCAT’s followers’ against cost-overruns and operational risks usually borne by them when it comes to PINE script innovation ecosystem. The TVCs redeemed for L4/L5 a follower signs up for with BLACKCAT is their guaranteed lifetime locked in TVC Quantity/ cryptocurrency, with no special conditions, exclusions and fine print whatsoever. Based on this scheme, I can constantly refine, expand, upgrade and improve PINE script publishing to ensure the very best experiences for my followers. The 'Redeem Fee Lock Guarantee' is a step in the direction of rewarding the valuable followers. NOTE: Every L4/L5 script redeeming service is ONLY limited to TVC or Cryptocurrency ("Win$ & Donate w/ This" Addresses displayed on script page) redeeming which the 1st signed up TVC Qty/ equivalent cryptocurrency is the lifetime offered TVC Qty/ equivalent crypto.
How to subscrible this indicator?
The script subscription period only has two options of one month or one year, and its price is floating. The latest price of the script subscription is proportional to the number of likes/agrees this script has already received. Therefore, the price of subscribing to this script shows an increasing trend, and the earliest subscribers can enjoy the price of lifetime lock to this script. As the number of likes / agrees of this script increases, the subscription fee for one month and one year will also increase linearly. Whatever, the first subscription price of the use will be locked for life.
Monthly subscription and annual subscription can be done either by tradingview coins ( TVC ) or by converting into equivalent cryptocurrency at the exchange rate (1TVC=0.01USD) for redeem.
TVC payment needs to pay TVC directly in the comments under this script. Every time I authorize a new user, I will update the latest number of subscribed users and latest price for next subscription under the script comment. If there are any conflicting scenario happened to the rules and my update. My updated price based on the rule will be the final price for next subscription. The following subscribers need to pay the corresponding amount of TVC or cryptocurrency in accordance with the latest number of users and price announced by me in accordance with the rules published.
TVC redemption is the method I strongly recommend, and I hope you can complete the redemption in the comment area of this script. This is like a blockchain structure, each comment is a block, each subscription is a chain, which is conducive to open and transparent publicity and traceability to avoid unnecessary disputes.
Monthly Subscription Charges
500TVC <50 Agrees (A)
50A<850TVC<100A
100A<1000TVC<150A
150A<1350TVC<200A
200A<1500TVC<250A
250A<1850TVC<300A
300A<2000TVC<350A
350A<2350TVC<400A
400A<2500TVC<450A
450A<2850TVC<500A
500A<3000TVC<550A
550A<3350TVC<600A
600A<3500TVC<650A
650A<3850TVC<700A
700A<4000TVC<750A
750A<4350TVC<800A
800A<4500TVC<850A
850A<4850TVC<900A
900A<5000TVC<950A
950A<5350TVC<1000A
1000A<5500TVC<1050A
And so on...
Annual Subscription Charges
5000TVC <50 Agrees (A)
50A<8500TVC<100A
100A<10000TVC<150A
150A<13500TVC<200A
200A<15000TVC<250A
250A<18500TVC<300A
300A<20000TVC<300A
350A<23500TVC<400A
400A<25000TVC<450A
500A<28500TVC<550A
500A<30000TVC<550A
550A<33500TVC<600A
600A<35000TVC<650A
650A<38500TVC<700A
700A<40000TVC<750A
750A<43500TVC<800A
800A<45000TVC<850A
850A<48500TVC<900A
900A<50000TVC<950A
950A<53500TVC<1000A
1000A<55000TVC<1050A
And so on...

[blackcat] L5 Whale Jump Screener 25 NoAlertsLinkage Authorization:
When you obtain any one of the following technical indicators authorization, the other one will automatically obtain a free authorization for the same length of time:
1. L5 Whale Jump Screener 25 NoAlerts
2. L5 Whale Jump Screener 12 Alerts
Discount Authorization:
While you are authorized for any of the following technical indicators, this indicator will only need to pay 200TVC (not per month) but you obtain the authorization length as long as your longest one among all invited-only indicators .
1. L5 Whales Jump Out of Ocean X
2. L5 Zen Master
Level: 5
Background:
L5 Whale Jump Screener 25 NoAlerts is a screeener which is based on principle of L5 Whales Jump Out of Ocean X, but it has its own scheme to work as a screener, which can track 25 trading pairs at the same time. With this indicator, you will see an overall market state if your inputs are major instruments in a specific market via a colorful heat map.
Function:
By tracking multiple targets in the same section can help you increase confidence level of trading because most targets move to the same direction witin the same section. It provides a macro picture to support you know the background of your trading. Also, you can choose your trading target by comparing with others in the same section to make a better decision.
Inputs:
25 tickerids for your customization
Key Signal:
Long Whales / Banker Pump--> fuchsia color area with 0% transparency
Close Long Whales / Close Banker Pump--> red color area with 0% transparency
Short Whales / Banker Dump --> yellow color area with 0% transparency
Close Short Whales / Close Banker Dump --> green color area with 0% transparency
Long Waves Start--> fuchsia color area with 50% transparency
Short Waves Start --> yellow color area with 50% transparency
No Whale or Wave Signal --> gray color rea with 50% transparency
Pros and Cons:
ONLY suitable for discretionary trading, and does NOT support automatic trading system/bots with alerts.
Intuitive and effective, the output signal is more reliable after multi-indicator resonance
For who need alert function, you can choose anther indicator: L5 Whale Jump Screener 12 Alerts.
Why 25 Targets are Supported?
From the principle of TV principle, it should be possible to track up to 40 targets at the same time. However, TV has another condition that restricts server computing resources. When the two condition work at the same time, for the whale jump algorithm, the number of targets it can track at the same time will drop from 40 to about 26~27! In addition, this indicator needs to support the display function from the daily time frame to the 1min time frame. Therefore, the requirements for computing resources have further deteriorated. In the end, the maximum tracking number I obtained by compromise is 25 to ensure that this indicator can support 1min or second level normal display without report an error.
Remarks:
My third L5 indicator published
Closed-source
Invite-only
Redeem Fee Life Lock Guarantee
Although I take the efforts to inform the script requesters that the best way to promote trading skills is to learn from the open source scripts I released by themself and to improve their PNIE script programming skills, there are still many people asking how to obtain or pay to use BLACKCAT L4/L5 private scripts. In fact, I do not encourage people to use Tradingview Coins ( TVC ) / Cryptocurrency to redeem the right to use BLACKCAT L4/L5 scripts. However, redeeming private script usage rights through TV Coins/ Cryptocurrency may be an effective way to force more people to learn PINE script programming seriously. And then I can concentrate on answering more valuable community questions instead of being overwhelmed by L4/L5 scripting permission reqeusts.
I would like to announce a ‘Redeem Fee Lock Guarantee’ program to further simplify the L4/L5 indicator/strategy utility offering and distinguish itself from the competition. ‘Redeem Fee lock guarantee’ is one of the major initiatives by BLACKCAT as a part of overall value packaging designed to guard BLACKCAT’s followers’ against cost-overruns and operational risks usually borne by them when it comes to PINE script innovation ecosystem. The TVCs redeemed for L4/L5 a follower signs up for with BLACKCAT is their guaranteed lifetime locked in TVC Quantity/ cryptocurrency, with no special conditions, exclusions and fine print whatsoever. Based on this scheme, I can constantly refine, expand, upgrade and improve PINE script publishing to ensure the very best experiences for my followers. The 'Redeem Fee Lock Guarantee' is a step in the direction of rewarding the valuable followers. NOTE: Every L4/L5 script redeeming service is ONLY limited to TVC or Cryptocurrency ("Win$ & Donate w/ This" Addresses displayed on script page) redeeming which the 1st signed up TVC Qty/ equivalent cryptocurrency is the lifetime offered TVC Qty/ equivalent crypto.
How to subscrible this indicator?
The script subscription period only has two options of one month or one year, and its price is floating. The latest price of the script subscription is proportional to the number of likes/agrees this script has already received. Therefore, the price of subscribing to this script shows an increasing trend, and the earliest subscribers can enjoy the price of lifetime lock to this script. As the number of likes / agrees of this script increases, the subscription fee for one month and one year will also increase linearly. Whatever, the first subscription price of the use will be locked for life.
Monthly subscription and annual subscription can be done either by tradingview coins ( TVC ) or by converting into equivalent cryptocurrency at the exchange rate (1TVC=0.01USD) for redeem.
TVC payment needs to pay TVC directly in the comments under this script. Every time I authorize a new user, I will update the latest number of subscribed users and latest price for next subscription under the script comment. If there are any conflicting scenario happened to the rules and my update. My updated price based on the rule will be the final price for next subscription. The following subscribers need to pay the corresponding amount of TVC or cryptocurrency in accordance with the latest number of users and price announced by me in accordance with the rules published.
TVC redemption is the method I strongly recommend, and I hope you can complete the redemption in the comment area of this script. This is like a blockchain structure, each comment is a block, each subscription is a chain, which is conducive to open and transparent publicity and traceability to avoid unnecessary disputes.
Monthly Subscription Charges
500TVC <50 Agrees (A)
50A<850TVC<100A
100A<1000TVC<150A
150A<1350TVC<200A
200A<1500TVC<250A
250A<1850TVC<300A
300A<2000TVC<350A
350A<2350TVC<400A
400A<2500TVC<450A
450A<2850TVC<500A
500A<3000TVC<550A
550A<3350TVC<600A
600A<3500TVC<650A
650A<3850TVC<700A
700A<4000TVC<750A
750A<4350TVC<800A
800A<4500TVC<850A
850A<4850TVC<900A
900A<5000TVC<950A
950A<5350TVC<1000A
1000A<5500TVC<1050A
And so on...
Annual Subscription Charges
5000TVC <50 Agrees (A)
50A<8500TVC<100A
100A<10000TVC<150A
150A<13500TVC<200A
200A<15000TVC<250A
250A<18500TVC<300A
300A<20000TVC<300A
350A<23500TVC<400A
400A<25000TVC<450A
500A<28500TVC<550A
500A<30000TVC<550A
550A<33500TVC<600A
600A<35000TVC<650A
650A<38500TVC<700A
700A<40000TVC<750A
750A<43500TVC<800A
800A<45000TVC<850A
850A<48500TVC<900A
900A<50000TVC<950A
950A<53500TVC<1000A
1000A<55000TVC<1050A
And so on...

[blackcat] L5 Zen MasterLevel: 5
Background
L5 Zen Master is my favorite main chart indicator. I have been studying Zen Theory for long and keeping improving related home-baked private indicators. Zen Theory is less known out side of China. This situation is very similar to when Nilson did not introduce Japanese candlesticks worldwide. At that time, traders in other parts of the world rarely heard of Japanese candlesticks. This situation occurs again. When most Chinese bookstores and libraries are full of books on Zen Theory trading techniques, the rest of the world may not know this trading technique based on mathematical derivation axioms.
As for the author of the theory, he/she is as mysterious as Satoshi Nakamoto who created Bitcoin. People don't even know his/her gender, because he/she likes to call himself/herself a "woman" when he/she publishes original trading techniques on his/her blog. No one knows his/her name, only his/her nickname: "Preaching Zen in Tangles" (缠中说禅). People respectfully call him/her "Zen Master" (缠师). Zen Theory is based on geometric structures like Bill Williams' Fractals and ZigZag, but it is very host to MTF applications. In addition, there are unique insights on moving averages, this moving average technology is called Zen Kiss (缠论吻).
Function
It combine several novel indicators together but mainly focus on Zen Theory(缠论主图), including Zen Strokes (自动画笔) 和 Zen Kiss (缠论均线) Moving Averages. To Better understand the market geometry structure, I developped featured Fibonacci Space Indicator which is based on Semi-LOG and Fibonacci Time Window Indicator to help juge trend movements independently. Also, I integrated Better Volume Indicator(BVI) and Range Action Verification Index (RAVI) as well for volume and bias monitoring.
Indicator Set
Zen Stroke (Auto ZigZag, 自动画缠论笔)
Zen Kiss Moving Averages (缠论均线)
Fibonacci Space Indicator with Golden Ratios based on Semi-LOG (黄崇半对数)
Fibnacci Time Window Indicator with red/green background colors
Dynamic Fibnacci Space Arrows to indicate support and resistance immediately
Better Volume Indicator (BVI) with painted bars to juge trend strength
Range Action Verfication Index (RAVI) for large time frame for exetreme conditions warning
Inputs
BVI lookback period --> 5 as default
EnableBVIBarColors --> True as default
Show Zen Stroke --> True as default
Show Fib Space based on Semi-LOG --> True as default
Zen Fractals Lookback Period --> 377 as default
Key Signal
Zen Stroke
Yellow line section for up stroke
Blue line section for down stroke
Zen Kiss MA
Yellow MA for fast line (Cowgirl line)
Fuchsia MA for slow line (Cowboy line)
Fib Space w/ Golden Ratios
Low, 11.4%, 23.6%, 38.2%, 50%, 61.8%, 78.6%, 88.6%, High
Fib Time Window
Green background color for top indicator based on time window
Red background color for bottom indicator based on time window
Dynamic Fib Space Arrows
Green arrows for support
Red arrows for resistance
Better Volume Indicator
Yellow bar color --> low volume --> trend ends, commonly before trend reversals
Red bar color --> climax up volume --> very bullish and next bar may continue to be bullish
White bar color --> climax down volume --> very bearish and next bar may continue to be bearish
Green bar color --> churn volume --> Long and short forces play fierce games within a small price range
Fuchisia bar color --> climax churn volume --> Long and short forces play fierce games within a large price range
Range Action Verfication Index
Yellow background color for extremely negative bias, indicating bottom zone
Fuchsia background color for extremely positive bias, indiacting top zone
Pros and Cons
ONLY suitable for discretionary trading, and does NOT support automatic trading system/bots with alerts.
Intuitive and effective, the output signal is more reliable after multi-indicator resonance
Remarks
My second L5 indicator published
Closed-source
Invite-only
Redeem Fee Life Lock Guarantee
Although I take the efforts to inform the script requesters that the best way to promote trading skills is to learn from the open source scripts I released by themself and to improve their PNIE script programming skills, there are still many people asking how to obtain or pay to use BLACKCAT L4/L5 private scripts. In fact, I do not encourage people to use Tradingview Coins ( TVC ) / Cryptocurrency to redeem the right to use BLACKCAT L4/L5 scripts. However, redeeming private script usage rights through TV Coins/ Cryptocurrency may be an effective way to force more people to learn PINE script programming seriously. And then I can concentrate on answering more valuable community questions instead of being overwhelmed by L4/L5 scripting permission reqeusts.
I would like to announce a ‘Redeem Fee Lock Guarantee’ program to further simplify the L4/L5 indicator/strategy utility offering and distinguish itself from the competition. ‘Redeem Fee lock guarantee’ is one of the major initiatives by BLACKCAT as a part of overall value packaging designed to guard BLACKCAT’s followers’ against cost-overruns and operational risks usually borne by them when it comes to PINE script innovation ecosystem. The TVCs redeemed for L4/L5 a follower signs up for with BLACKCAT is their guaranteed lifetime locked in TVC Quantity/ cryptocurrency, with no special conditions, exclusions and fine print whatsoever. Based on this scheme, I can constantly refine, expand, upgrade and improve PINE script publishing to ensure the very best experiences for my followers. The 'Redeem Fee Lock Guarantee' is a step in the direction of rewarding the valuable followers. NOTE: Every L4/L5 script redeeming service is ONLY limited to TVC or Cryptocurrency ("Win$ & Donate w/ This" Addresses displayed on script page) redeeming which the 1st signed up TVC Qty/ equivalent cryptocurrency is the lifetime offered TVC Qty/ equivalent crypto.
How to subscrible this indicator?
The script subscription period only has two options of one month or one year, and its price is floating. The latest price of the script subscription is proportional to the number of likes/agrees this script has already received. Therefore, the price of subscribing to this script shows an increasing trend, and the earliest subscribers can enjoy the price of lifetime lock to this script. As the number of likes / agrees of this script increases, the subscription fee for one month and one year will also increase linearly. Whatever, the first subscription price of the use will be locked for life.
Monthly subscription and annual subscription can be done either by tradingview coins ( TVC ) or by converting into equivalent cryptocurrency at the exchange rate (1TVC=0.01USD) for redeem.
TVC payment needs to pay TVC directly in the comments under this script. Every time I authorize a new user, I will update the latest number of subscribed users and latest price for next subscription under the script comment. If there are any conflicting scenario happened to the rules and my update. My updated price based on the rule will be the final price for next subscription. The following subscribers need to pay the corresponding amount of TVC or cryptocurrency in accordance with the latest number of users and price announced by me in accordance with the rules published.
TVC redemption is the method I strongly recommend, and I hope you can complete the redemption in the comment area of this script. This is like a blockchain structure, each comment is a block, each subscription is a chain, which is conducive to open and transparent publicity and traceability to avoid unnecessary disputes.
Monthly Subscription Charges
500TVC <50 Agrees (A)
50A<850TVC<100A
100A<1000TVC<150A
150A<1350TVC<200A
200A<1500TVC<250A
250A<1850TVC<300A
300A<2000TVC<350A
350A<2350TVC<400A
400A<2500TVC<450A
450A<2850TVC<500A
500A<3000TVC<550A
550A<3350TVC<600A
600A<3500TVC<650A
650A<3850TVC<700A
700A<4000TVC<750A
750A<4350TVC<800A
800A<4500TVC<850A
850A<4850TVC<900A
900A<5000TVC<950A
950A<5350TVC<1000A
1000A<5500TVC<1050A
And so on...
Annual Subscription Charges
5000TVC <50 Agrees (A)
50A<8500TVC<100A
100A<10000TVC<150A
150A<13500TVC<200A
200A<15000TVC<250A
250A<18500TVC<300A
300A<20000TVC<300A
350A<23500TVC<400A
400A<25000TVC<450A
500A<28500TVC<550A
500A<30000TVC<550A
550A<33500TVC<600A
600A<35000TVC<650A
650A<38500TVC<700A
700A<40000TVC<750A
750A<43500TVC<800A
800A<45000TVC<850A
850A<48500TVC<900A
900A<50000TVC<950A
950A<53500TVC<1000A
1000A<55000TVC<1050A
And so on...

Alert for 3Commas Bollinger StrategyThis is just an alert for the 3Commas Bollinger Strategy written by tedwardd
Ethereum Perpetual SwapsThis script track most important Ethereum Perpetual Swaps vs Spot basis
When strong green color emerge implies that Swaps are trading at premium to spot.
When strong red color emerge implies that Swaps are trading at discount to spot.
These information is useful because it give leading information towards where funding rates are heading.
When trading at premium it will push towards Positive Funding Rates (Longs pay Shorts)
When trading at discount it will push towards Negative Funding Rates (Shorts pay Longs)
It's can also be used to give identify potential local tops or bots when values get too extreme.

Horizontal Plot Lines - Max. 24 - grid strategy - DARK LINESWhen I looked for something like this I couldn't find it. Although simple in appearance, this script was actually quite long and complicated to create. It allows you to break up any horizontal space in up to 24 lines. Just remember that 13 lines equal 12 levels, as the top and bottom lines are the placeholders. So, if you are using quarters theory, you would want to select 5 lines.
It automatically sets the top line at a user-selectable place, like the close of the highest candlestick. It also allows you to select the lowest point as the close or the low. This way you can use the bodies of the candlestick or the wicks. You can also set the lookback period, so that your high and low can be set as far back as you prefer in the timescale you are looking at.
You can use these lines in things like quarters theory, or analyze buy and sell points in a grid bot strategy. This indicator could help you to determine where to equally place your buy and sells in a grid with up to 24 different placements.
This version has dark lines and is suitable for the light template. There is a matching light line version for a dark template.
