Agisko Crypto Scalper v4.2 (BUY/SELL)Indicator that generates BUY and SELL shapes with alerts.
OSC scale can be configured to visualize the oscillator better. Nothing required, just for visualization.
DMI mark is by default 10 which is fine for most situations.
DMI range is the buffer zone where BUY orders will be created. E.g.: DMI mark 10 and DMI range 1 will create a zone for BUY when DMI+ is between 9 and 11 (10-1 and 10+1).
This works perfect on the 5 minute chart and is suggested to use the SELL alert for exits or use a take profit (TP) of 1% with optional trailing if you use bots like 3 commas.
Stoploss is the same. Use the SELL alert or set a manual stoploss of 2-5%.
Cerca negli script per "bot"
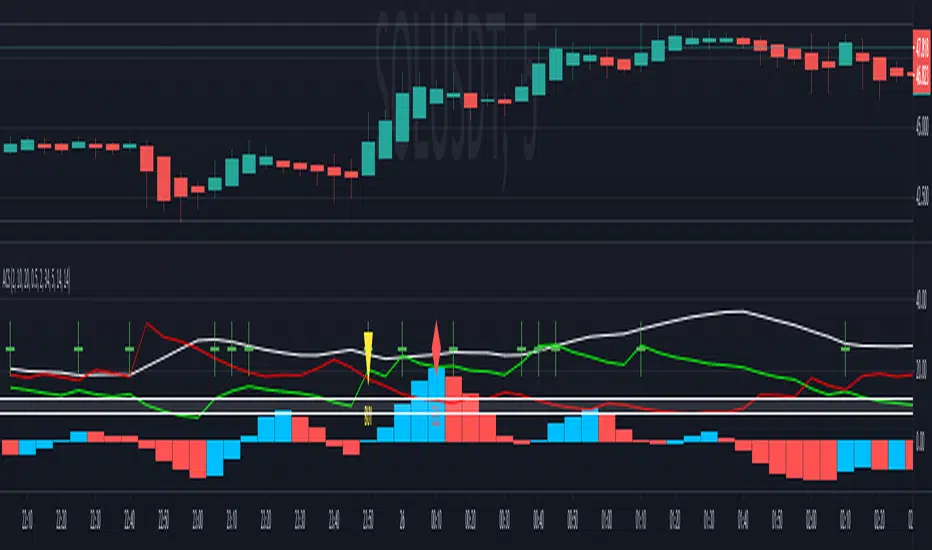
[blackcat] L5 Whales Jump Out of Ocean XLevel: 5
Background
I have been working on developing indicators on how to track the banker funds or whales. In my open source indicators published, you can search for the keywords "Banker" or "Whale" to find and use these indicators. After three years of development and hard work, I have perfectly combined the banker fund/whale mathematical model and the unique Fibonacci space-time indicators. This is named as "L5 Whales Jump Out of Ocean X" indicator that I will introduce today.
Function
This indicator introduces three independent judgment standards. They are whales & waves, Fibonacci time windows and dynamic Fibonacci retracement arrows. Whales and waves are banker fund/ whale behavior modeling based on my unique moving average technology. Fibonacci time and space indicators are a unique improvement I made to traditional indicators of the same kind to make them more powerful.
This indicator is basically applicable to all markets, but requires traders to choose the most suitable trading pair to operate. This indicator is used for multiple periods. Because the smaller the period, the more unstable the data, the larger the period, the more stable the Fibonacci space-time indicator. I use this indicator for the operation of cryptocurrency, commodities, forex, local stocks and ETFs. When this indicator is combined with the candle patterns of Japanese candlesticks, it will often produce higher quality signals, so I suggest that people who use this indicator should have the basic knowledge of Japanese candlesticks in order to better use this indicator.
Key Signal
Long Whales / Banker Pump--> fuchsia and red stick bars (Motive waves with fuchsia color; corrective waves with red color)
Short Whales / Banker Dump --> yellow and red green stick bars (Motive waves with yellow color; corrective waves with green color)
Long Waves --> fuchsia and red areas (Motive waves with fuchsia color; corrective waves with red color)
Short Waves --> yellow and red green areas (Motive waves with yellow color; corrective waves with green color)
Fibonacci Top Time Window --> red background color
Fibonacci Bottom Time Window --> green background color
Dynamic Fibonacci Retracement Support Arrows --> green arrows with "SUP" text; the brighter color, the stronger support.
Dynamic Fibonacci Retracement Resistance Arrows --> red arrows with "RES" text; the brighter color, the stronger resistance.
Ready for Support Cross --> green crosses with "*SUP" text on zero axis.
Ready for Resistance Cross --> red crosses with "*RES" text on zero axis.
Pros and Cons
ONLY suitable for discretionary trading, and does NOT support automatic trading system/bots with alerts.
Intuitive and effective, the output signal is more reliable after multi-indicator resonance
Remarks
My first L5 indicator published
Closed-source
Invite-only
Redeem Fee Life Lock Guarantee
Although I take the efforts to inform the script requesters that the best way to promote trading skills is to learn from the open source scripts I released by themself and to improve their PNIE script programming skills, there are still many people asking how to obtain or pay to use BLACKCAT L4/L5 private scripts. In fact, I do not encourage people to use Tradingview Coins (TVC) / Cryptocurrency to redeem the right to use BLACKCAT L4/L5 scripts. However, redeeming private script usage rights through TV Coins/ Cryptocurrency may be an effective way to force more people to learn PINE script programming seriously. And then I can concentrate on answering more valuable community questions instead of being overwhelmed by L4/L5 scripting permission reqeusts.
I would like to announce a ‘Redeem Fee Lock Guarantee’ program to further simplify the L4/L5 indicator/strategy utility offering and distinguish itself from the competition. ‘Redeem Fee lock guarantee’ is one of the major initiatives by BLACKCAT as a part of overall value packaging designed to guard BLACKCAT’s followers’ against cost-overruns and operational risks usually borne by them when it comes to PINE script innovation ecosystem. The TVCs redeemed for L4/L5 a follower signs up for with BLACKCAT is their guaranteed lifetime locked in TVC Quantity/ cryptocurrency, with no special conditions, exclusions and fine print whatsoever. Based on this scheme, I can constantly refine, expand, upgrade and improve PINE script publishing to ensure the very best experiences for my followers. The 'Redeem Fee Lock Guarantee' is a step in the direction of rewarding the valuable followers. NOTE: Every L4/L5 script redeeming service is ONLY limited to TVC or Cryptocurrency ("Win$ & Donate w/ This" Addresses displayed on script page) redeeming which the 1st signed up TVC Qty/ equivalent cryptocurrency is the lifetime offered TVC Qty/ equivalent crypto.
How to subscrible this indicator?
The script subscription period only has two options of one month or one year, and its price is floating. The latest price of the script subscription is proportional to the number of likes/agrees this script has already received. Therefore, the price of subscribing to this script shows an increasing trend, and the earliest subscribers can enjoy the price of lifetime lock to this script. As the number of likes / agrees of this script increases, the subscription fee for one month and one year will also increase linearly. Whatever, the first subscription price of the use will be locked for life.
Monthly subscription and annual subscription can be done either by tradingview coins (TVC) or by converting into equivalent cryptocurrency at the exchange rate (1TVC=0.01USD) for redeem.
TVC payment needs to pay TVC directly in the comments under this script. Every time I authorize a new user, I will update the latest number of subscribed users and latest price for next subscription under the script comment. If there are any conflicting scenario happened to the rules and my update. My updated price based on the rule will be the final price for next subscription. The following subscribers need to pay the corresponding amount of TVC or cryptocurrency in accordance with the latest number of users and price announced by me in accordance with the rules published.
TVC redemption is the method I strongly recommend, and I hope you can complete the redemption in the comment area of this script. This is like a blockchain structure, each comment is a block, each subscription is a chain, which is conducive to open and transparent publicity and traceability to avoid unnecessary disputes.
Monthly Subscription Charges
500TVC <50 Agrees (A)
50A<850TVC<100A
100A<1000TVC<150A
150A<1350TVC<200A
200A<1500TVC<250A
250A<1850TVC<300A
300A<2000TVC<350A
350A<2350TVC<400A
400A<2500TVC<450A
450A<2850TVC<500A
500A<3000TVC<550A
550A<3350TVC<600A
600A<3500TVC<650A
650A<3850TVC<700A
700A<4000TVC<750A
750A<4350TVC<800A
800A<4500TVC<850A
850A<4850TVC<900A
900A<5000TVC<950A
950A<5350TVC<1000A
1000A<5500TVC<1050A
And so on...
Annual Subscription Charges
5000TVC <50 Agrees (A)
50A<8500TVC<100A
100A<10000TVC<150A
150A<13500TVC<200A
200A<15000TVC<250A
250A<18500TVC<300A
300A<20000TVC<300A
350A<23500TVC<400A
400A<25000TVC<450A
500A<28500TVC<550A
500A<30000TVC<550A
550A<33500TVC<600A
600A<35000TVC<650A
650A<38500TVC<700A
700A<40000TVC<750A
750A<43500TVC<800A
800A<45000TVC<850A
850A<48500TVC<900A
900A<50000TVC<950A
950A<53500TVC<1000A
1000A<55000TVC<1050A
And so on...

Staggered Spread VisualizerA very simple crude way to visualize a spread between Ask and Bid orders. Useful if you are trying to compare pairs to market make against using one exchange's price feed to define prices for your bot on Another exchange. Made this for myself. Might add more functionality later where rather than adding the symbol to compare it will auto add it then draw flags and count them on cross over points!

Bitcoin Perpetual SwapsThis script track most important Bitcoin Perpetual Swaps vs SPOT (Coinbase).
When strong green color emerge implies that Swaps are trading at premium to spot.
When strong red color emerge implies that Swaps are trading at discount to spot.
These information is useful because it give leading information towards where funding rates are heading.
When trading at premium it will push towards Positive Funding Rates (Longs pay Shorts)
When trading at discount it will push towards Negative Funding Rates (Shorts pay Longs)
It's can also be used to give identify potential local tops or bots when values get too extreme.

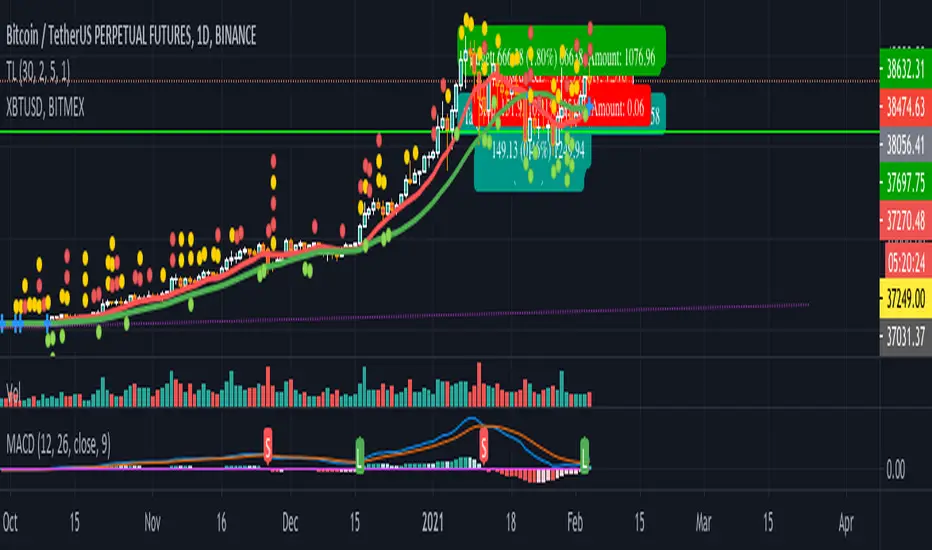
Ninja Scalping: IndicatorThis is a strategy version for scalping signals. The objective of these signals is to accumulate more BTC through buying and selling of Altcoins. Thus, it is expected that these signals yield BTC gains when the crypto market has bullish days, as when BTC bleeds, other coins bleed even more. Let us get ready for the altseason!!
As mentioned above, the goal is to increase BTC's holdings through buying and selling of Alts. However, different Alts react differently against BTC. Therefore, there is no set of parameters that works for all Alts. The good news is that I tried my best to limit the number of parameters required to be tuned for a specific Alt to two. Also, this strategy helps back-test and tune the parameters for the desired Altcoin, with no guarantee that what happened in the past would happen in the future. This strategy is generally conservative, and it does not enter many trades. However, you can be more aggressive by changing the multiplier value: the smaller the value, the more aggressive the strategies. One can be more aggressive when the market is super bullish. Actually, you can test this by playing with the dates for the back-testing to have an idea of what would be suitable parameters when BTC is strong or weak. For the image attached, the strategy is back-tested from Jan 1, 2021, to March 18, 2021, assuming an initial capital of 1 BTC.
For the time span parameter, typical values are 5, 10, 14, 21, 34, 50, and 100. For the multiplier, typical values range between 0.01 and 2.
Use it at your own risk. Feedbacks are more than welcome. Happy trading!

rushs bottom feeder and peak eaterThis script works well on the 45 minute and higher charts. Pairs nicely with a DCA bot with trailing stops. Uses RSI over bought and over sold indicators with bullish engulfing or bearish engulfing candle signals, plotted with the EMA 20 and EMA 100.

Parabolic SAR with Volatility Filter: Buy Alerts for 3commasHey folks and fellow 3commas users !
Here is a new signal generator for your DCA bot on 3commas.
This is a classic Parabolic SAR indicator with a filter for volatility.
NOTE: This is a repainting strategy by design. Recommended to use with "Once per bar" alert style for PSAR

MDX Free (PA) Buy/Sell ConfimationThis is a free version of the MDX Crypto trading "bot". Note that this indicator and the MDX version are based on simple code available on trading view or via google search.
This indicator is based on the super trend indicator to provide buy/sell signals at inflection points of uptrends and downtrends. These inflection points are commonly used as entry/exit points for trading. They are represented on the chart as green (buy) or red (sell) arrow.
This also uses two exponential moving averages. One average is set over 21 bars (fast) and the other is set over 55 bars (slow). When the plots intersect it represents a change in momentum. This is shown on the chart as a red (negative change) or green (positive change) diamonds. When a green diamond follows a green arrow it is considered a confirmed buy. When a red diamond follows a red arrow it is a confirmed sell.
Caution:
Caution this indicator is not reliable on its own, especially on low time scales. When looking back in time this indicator will almost always show a "confirmed buy" before a large increase in price, but on many occasions you can have a "confirmed buy" which is followed by a dump in price, that will not trigger sell signal in time. For best results use with 15m to 1h timeframes
Disclaimer:
This indicator is for informational purposes and should be used for educational purposes only. If you rely on this for trading without additional information you will loose money. I am not a financial advisor, or a professional trader. Use at your own risk.
This is an unpolished version. It may be updated and the source code published if it is used.
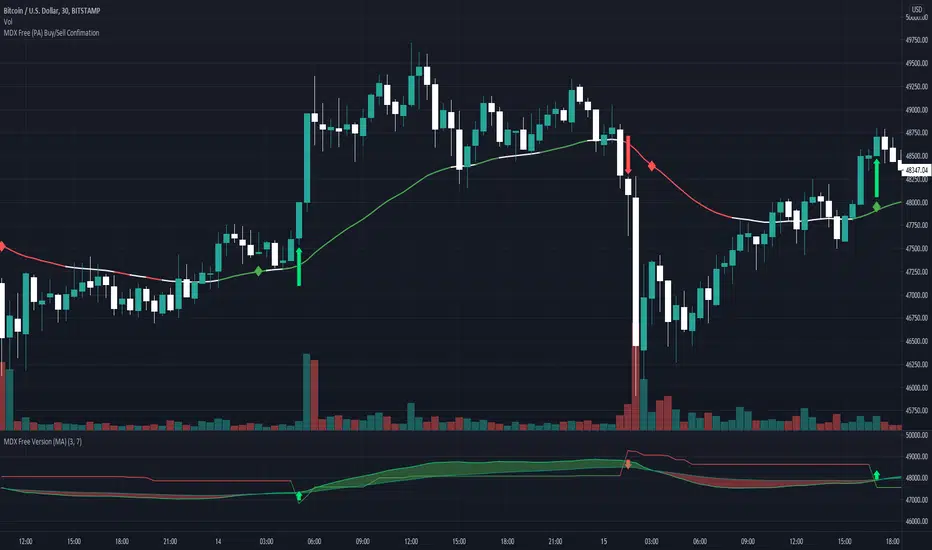
MDX Free Version (MA)This is a free version of the MDX Crypto trading "bot". Note that this indicator and the MDX version are based on simple code available on trading view or via google search.
This indicator is using two exponential moving averages. One average is set over 21 bars (fast) and the other is set over 55 bars (slow). When the plots intersect it represents a change in momentum. MDX refers to this as a confirmation.
Also shown on the chart is the "Super Trend" indicator. This is the red and green line with inflection points highlighted by a red or green arrow. These points are changes in uptrends and downtrends. MDX refers to this as a "long buy" when green, and a "short sell" when red. Commonly these are buy/sell signals. When a buysignal (green arrow) occurs followed by a change in momentum toward a downtrend, MDX refers to this as a "confirmed buy". When a sell signal (red arrow) occurs followed by a change in momentum toward a downtrend, MDX refers to this as a "confirmed sell". This can been seen more clearly on the MDS Crypto Free Version (PA) indicator which is also available. This uses the same information as the MA indicator, but formatted for the candle chart.
Usage:
Caution this indicator is not reliable on its own, especially on low time scales. When looking back in time this indicator will almost always show a "confirmed buy" before a large increase in price, but on many occasions you can have a "confirmed buy" which is followed by a dump in price, that will not trigger sell signal in time.

LordPepe Stochastic SignalsThis is the Lord Pepe. Howdy. Basic buy/sell indicator to accumulate along a downtrend and release your stack during the uptrend and oversold levels of the stochastic. The buys should be used to stack, and sells indicate levels of profit taking, they do not signal a long term reversal, only < 25% of stack should be released on "OB" signals.
OB - overbought (sell)
OS - oversold (buy)
MACD signal with alert (long/short/close) for TV free accountSend MACD alert through email (available for free/pro user):
// 3 - buy
// -2 - short
// 0 - close position
// 1 - ignore
Example buy signal
Alert: STRAT3. BINANCE:BTCUSDTPERP, price = 31080
Example sell signal
Alert: STRAT-2. BINANCE:BTCUSDTPERP, price = 31080
Example close signal
Alert: STRAT0. BINANCE:BTCUSDTPERP, price = 31080
Example ignore signal
Alert: STRAT1. BINANCE:BTCUSDTPERP, price = 31080
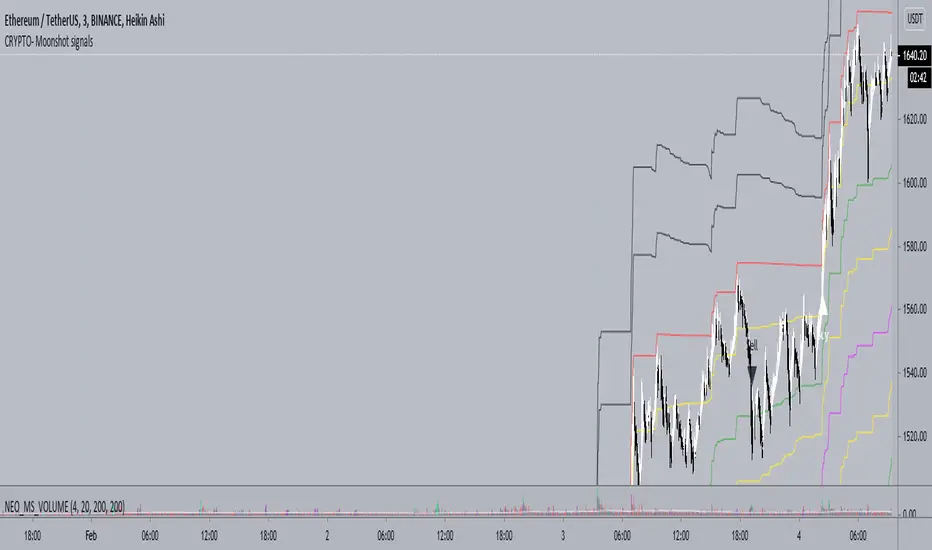
Neo_BTC - CRYPTO - Moonshot signalsCRYPTO - Moonshot signals indicator is designed to work well in trending markets and scalping using the levels in sideways market
FAQs
1. What is the optimal TF (Time Frame) for the indicator?
A. 3 min HA (Heikin Ashi) Candles
2. Will it work on other TFs?
A. Yes, 1min works well as well but less profitable. 1min TF is recommended during High volatility .
3. What does the levels do?
A. There are two levels Buy (B) and (S) Sell which is separated by mid level M.
Above mid level is bullish and below bearish .
As you get the Long or short signal, partially reduce your position at each levels to reduce risk and maximise profits.
4. How to scalp trade on the levels?
A. Depending on the trend you can short or long between the levels
5. How often the signals fire?
A. Only few in a week. But the levels are optimized for swing trades and works well. You are welcome to setup a grid bot to trade between the levels
6. I can only see Sell Labels - no Buy labels?
A. Sell labels are Black and Buy labels are White in colour. So if your TV background is white or black, the labels may not appear. You can change color in the indicator settings.
7. Will it work for Alts?
A. Yes, Alts and other tickers.
Fear N GreedOverview
The goal of this script was to apply the concept of Herd Mentality. While one voice may seem unique, when you combine all the voices together they average out and show an overall emotion of the herd. We should be able to apply this concept to indicators, giving us the Fear and Greed of the markets.
How to Use
Buy when there is fear and sell when there is greed. Pay attention to changes in direction of the indicator. If the data is fearful and the data is starting to change direction, it signals that it's probably a good time to buy because greed is slowly starting to enter the market. You can use this indicator in any time frame, just check the past data to determine how useful it will be for that specific period.
Options
Smoothing : This will smooth the data. Try to stay around 5-15. High values will cause the indicator to lag
Line Width : Visually changes the width of the data line
Top Band +- : Moves the top band up or down
Bot Band +- : Moves the bottom band up or down
Mid Band Width : Adjusts the width of the middle region
Fear Alert Level >= : Sets when the alert will start to trigger
Greed Alert Level >= : Sets when the alert will start to trigger
Indicators
There are multiple indicators used in this script. I used the Stochastic RSI to measure strength in the market. This combines well with the MACD indicator by giving you really good entry and exit points. There is an indicator combining money flow and rate of return to give a basic emotion of the data. I also included breadth and momentum and several others to help gauge the direction of the market. I then normalize all of the indicators between 0-100 so that I can get an overall average, smooth the noise, and ultimately plot the data.
Bands
While making this script I noticed flowing regions of the data that would act as support and resistance so I did my best to calculate where they might fall. I essentially take the high and low data points from various lengths averaging them and then apply a smoothing filter to the band. I then noticed that between the bands there was a significant region that acted as a middle resistance and support. I decided the best way to make this region was to take the average high + average low of the data and divide it by 2 to get the center region. The reason I did this instead of just using the mid point of the bands was because when the data stays in a similar region it creates resistance, so it's more accurate to base the mid point on a shorter time frame rather than the overall bands of higher timeframes.
Alerts
Alerts are set up based on the change in data direction. If you set Fear as the alert for Fear Alert >= it will wait for a change in direction if the data is greater than or equal to the selected Fear level.
When setting alerts, make sure to use Once Per Bar Close as the option. There are 3 alert types: Fear Alert, Greed Alert, and Fear and Greed Alert. Fear and Greed Alert will combine the alerts into one message so that it's usable for free accounts. Fear Alert and Greed Alert will only message for those specific positions.

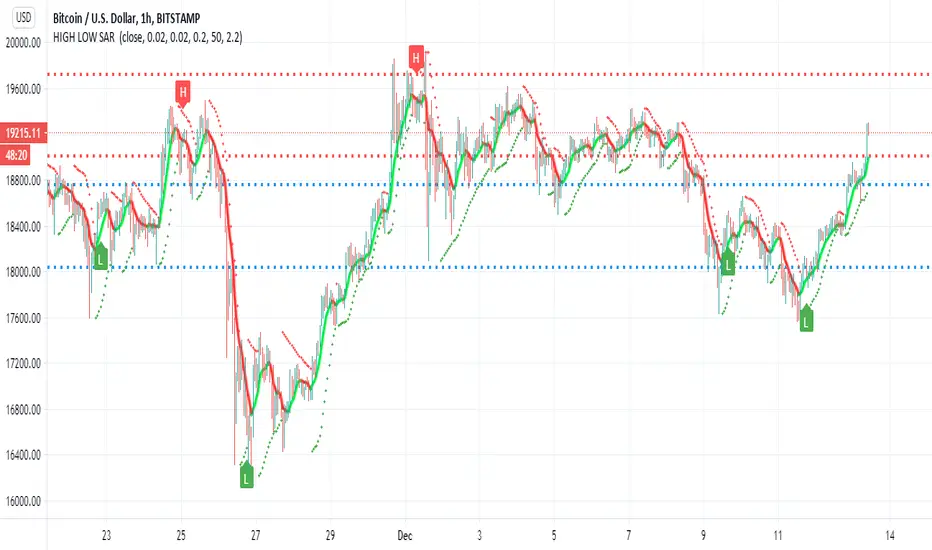
HIGH LOW SAR This script i try to detect high and low using SAR
the red and blue lines represent present and past support and resistance level
the trend line in lime and red is Hull
sar signals of high and low are done by cross of SAR and bollinger channel upper and lower and condition that it either below or above the resistance and support levels
there are alerts but i think as a bot it not so good , better to use this one as idea for possible high and low where the targets are shown by resistance and support level
this is just idea how to make the SAR to show us high and low , maybe with more refinement it would be better
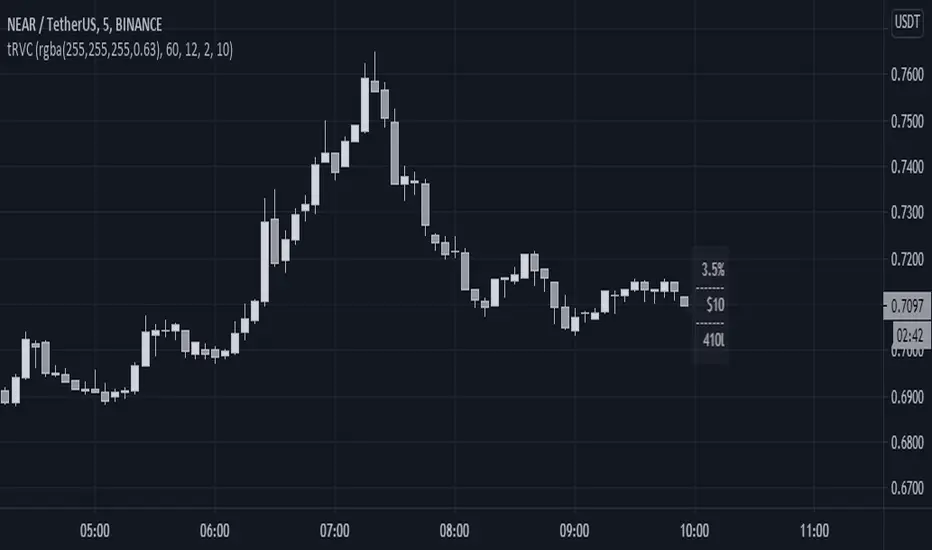
Risk Volume CalculatorBid volume calculation from average volatility
On label (top to bot):
Percents - averaged by moving in timeframe resolution
Cash - selected risk volume in usdt
Lots - bid volume in lots wich moving in Percents with used leverage is Cash
U can switch on channels to visualise volatility*2 channel or stakan settings
[astropark] DMI/ADX strategy [alarms]Dear Followers,
today I'm happy to share with you my DMI / ADX Strategy .
It provides directional trend information, so if a bullish or a bearish trend is going to start. Statistically it works better on lower timeframes (from 5 minutes to 1 hour).
It is both a Swing and Scalping Strategy indicator , based on a simple trend following theory , good for trading FOREX, Indexes, Stocks, Commodities and Cryptocurrencies.
To help in Taking Profits, the strategy integrates 2 special other than bull/bear signals:
Overbought and Oversold RSI Signals , which appear both as darker background (the darker the color, the more the price is in overbought/oversold) and green "ob"-"tp" / red "os"-"tp" labels (they optionally pop up only on a configurable stronger overbought/oversold condition) (you can enable/disable it optionally)
Peak Profit Tracker , which resets every time a new trade starts and keeps track of price fluctuation during the trade: the message is don't be too greedy and take profits or lock them with a stoploss in profit (you can enable/disable it optionally)
You can edit many options in order to
have more/less bull/bear signals
enable/disable showing bull/bear signals
enable/disable showing RSI TP signals (you can edit RSI length, overbought (OB) and oversold (OS) levels)
enable/disable showing peak profits on each trade
The user who wants to use this strategy, especially via an automated bot, must always set a stoploss (example 150$ from entry on bitcoin ) or use a proper risk management strategy .
This is not the "Holy Grail", so use it with caution. It's highly suggested to use a proper money management .
This script will let you set all notifications you may need in order to be alerted on each triggered signals.
You can find the strategy version for backtesting here below:
Here there are some examples how this DMI / ADX strategy works on many markets:
LTC/USDT 15m
BTC/USD 15m
BNB/BTC 15m
ETH/USD 15m
GOLD (XAU/USD) 15m
GOLD (XAU/USD) 1h
FB 15m
AAPL 15m
TSLA 1h
BANKNIFTY Index 5m
NIFTY 50 Index 5m
This is a premium indicator , so send me a private message in order to get access to this script .

RogTrader AlgoA simple BUY/SELL algorithm based on Moving Averages (EMA), MACD, RSI, Stochastic, ADX, ATR, CCI, OBV, Pivot Points, and Parabolic Sar, and Volume averaged.
Simple algo that uses multiples indicator strengths and weight them to generate buy and sell signals
Indicator strengths are displayed on each candle (green is bullish and red is bearish)
Green Buy and Red Sell shall be primarily used for long positions
Bull and Bear Strengths are created based on Price Action, and Volume, the length of the array shows upward or downward strength
Indicators' Signal Strength shows number Indicators' indication for the direction.
Bollinger Bands are in red and green filled
VWAP Bands are in gray, green, and red
Linear Regression is the blue line
Check multiple timeframes.

TBT ForecasterThe TBT Forecaster is a visual representation of the "weather forecast" for the crypto market, mainly Bitcoin and ALT coins.
Purpose:
The reason behind creating this indicator is to help give crypto traders a sense of what to expect in crypto currency markets. In general, crypto markets (ALT coins) are extremely dependent on the price action and sentiment of Bitcoin. By knowing what to expect for both BTC and ALT markets, crypto traders will have an edge on other traders by:
knowing when it's a good time to run BTC or stable coin pairs for bots on 3Commas
knowing when the ALT market is in a Bullish or Bearish mood
knowing if we're in a true ALT season or not
knowing if they should be focusing more on active trading on the BTC or stable coin market
Time Frame:
The TBT Forecaster can be viewed on any time frame, but it was originally designed to work off of the 6-hour time frame. Note that faster (higher) time frames can make the tool somewhat unreliable since faster (higher) time frames are subject to more sudden, volatile movements compared to the 6-hour or Daily time frames. To help users of the TBT Forecaster keep a healthy perspective, the indicator can be set to "same as symbol" (the indicator will adapt to any time frame you use) or "6 hours" (the original and intended time frame).
Metrics:
The two lines of the indicator represent Bitcoin (top) and ALT coins (below). The TBO Forecaster uses information derived from the price of Bitcoin, Bitcoin price volatility, moving averages, ATR (Average True Range), Bitcoin Dominance, and the ALT coin indexes (TOTAL2 and OTHERS). All of these metrics are combined and weighted into a system that quantifies the market sentiment for BTC and ALTs.
Sentiment:
The TBT Forecaster shows a gradient of market sentiment, from Bearish to Bullish. These market sentiment labels consist of a variety of different metrics that have to do with volume, price action, and several indices. The full gradient of sentiment is:
Bearish
Weak Bearish (ALT line only)
Neutral
Weak Bullish
Bullish
Realistic Expectations:
Note that it is impossible and unrealistic for the ALTs line to represent every single ALT coin/token/chart/symbol on every exchange. In my experience, there are always good charts to trade no matter what Bitcoin is doing. However, if we as traders know that ALTs are Bearish, then we can focus our efforts on trading Bitcoin (or just staying out of the ALT market until conditions change).
Use the link below to obtain access to this indicator

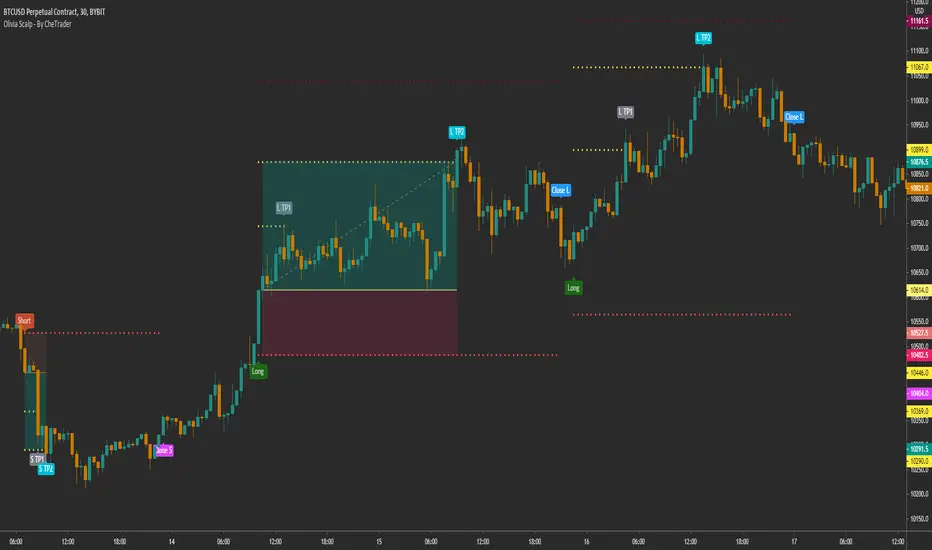
Olivia Scalp - By CheTrader
This is a complex strategy for Scalp that is fully configurable and can be automated
This script uses a combination of ma to detect the trend at a higher time frame, which can be defined by the user, as default set to 1D and 1M.
Triggers for long and short are given in a lower time frame, for example 30 minutes and are given by a combination of factors and oscillators. These include RSI, ADX, DMI
The script includes everything needed to follow the trade according to the habits of the trader.
This includes the option to use Take profit and Stop loss based on ATR that you can configure with the RR you like.
Similar to the risk-reward tool in tradingview.
You can also define a stop and take profit based on a percentage from the entry and also use a Trail stop, to finish the position when it is reached.
Each take profit and stop loss has a customized alarm so you can automate each action.
Also included is the option to use "advanced alerts"!
This is: You define how many seconds before you close the candle the alarm will be activated in TradingView. Very useful if you are going to automate, so that your alarm arrives just in time to your exchange.
Included:
Different trade entry options
Different forms of Take profit, included:
Take profit on squeeze candles
Take profit based on Risk-Benefit (RR)
Take profit a pre-determined %.
Different forms of Stop Loss, including
ATR-based stop loss
Trail stop loss (with option to use a trigger)
Stop loss a pre-determined %.
Contains a Risk Management section
May use a volatility filter
Statistics panel for backtest
Advanced alerts
As default is configured for BYBIT:BTCUSD 30 minutes
For access you can send a message or consult in my social networks.
Links in my tradingview signature (below).
EOD TraderMy EOD (End of Day) system for trading on the daily timeframe with minimum stress. Just pair the built-in alerts with the bot of your choice and then let the indicator do the rest. It'll determine the current trend, filter out as much noise as possible and then take you from long to short.
There are options to toggle the following:
Auto fibonacci levels with alerts for the look-back period of your choosing
Auto support and resistance with alerts
Alerts for the price closing above/below the 50MA
A coloured background to show the trend direction (green = up, red = down)
The fib and support levels can be handy when trying to determine when best to take profit or even exit the trade entirely.
Important: I personally use Heikin Ashi candles with this script to further filter entries. An option is available within the script settings to toggle this on/off should you wish to do the same.
This is a premium script. Please DM me for access.

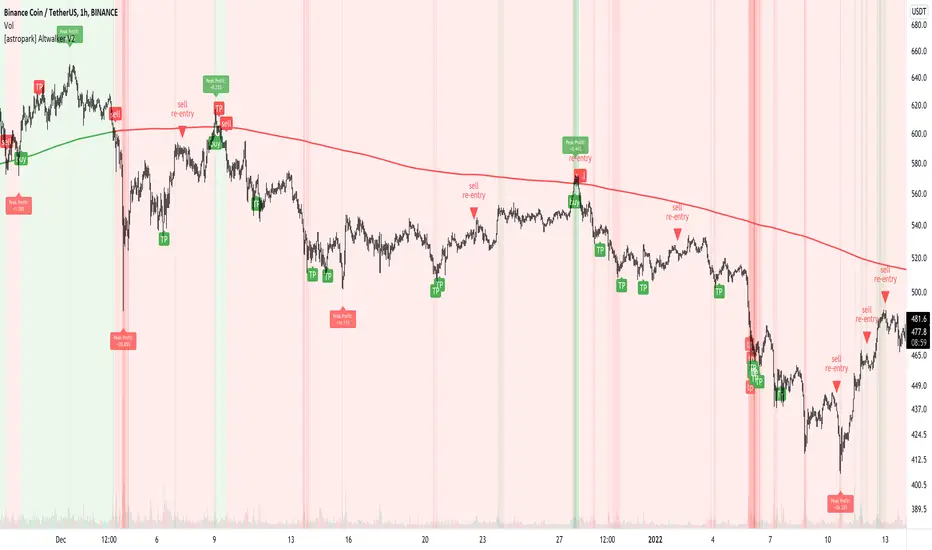
[astropark] Altwalker V2Dear Followers,
today I'm happy to share with you Altwalker V2 , an updated version of the former Altwalker for lower timeframes (from 5 minutes to 4 hours).
It is both a Swing and Scalping Strategy indicator , based on a simple trend following theory , mainly designed for Cryptocurrencies, Altcoins and of course Bitcoin.
Here you can see the Altwalker V1:
Based on Moving Average, Altwalker V2 on low timeframes dynamically identifies market resistance and support, so in which trend a cryptocurrency is during time:
green trendline and background means bullish trend , in fact it start with a "buy" signal
red trendline and background means bearish trend , in fact it start with a "sell" signal
if a series of buy and sell appears (this may happen especially in lower timeframes), this means price is in consolidation or distribution phase, so be prepared for a new trending phase coming soon, always remembering that taking profits is awesome and managing your risk by defining you position size and having a stoploss is a must in trading
To help in Taking Profits, Altwalker integrates also 2 special tools besides the trend highlighter:
Overbought and Oversold RSI Signals , which appear both as darker background (the darker the color, the more the price is in overbought/oversold) and green "ob"-"tp" / red "os"-"tp" labels (they optionally pop up only on a configurable stronger overbought/oversold condition) (you can enable/disable it optionally)
Peak Profit Tracker , which resets every time a new trade start and keeps track of price fluctuation during the trade: the message is don't be too much greedy and take profits or lock them with a stoploss in profit (you can enable/disable it optionally)
You can edit many options in order to
enable/disable showing buy/sell signals
enable/disable showing trendline
edit trendline variant (you have 2 options, by default variant 1 is selected)
enable/disable showing trend as background
enable/disable showing RSI TP signals
edit RSI length, overbought (OB) and oversold (OS) levels
enable/disable showing peak profits on each trade
The user who wants to use this strategy, especially via an automated bot, must always set a stoploss (example 150$ from entry on bitcoin ) or use a proper risk management strategy .
This is not the "Holy Grail", so use it with caution. It's highly suggested to use a proper money management .
This script will let you set all notifications you may need in order to be alerted on each triggered signals.
Here there are some examples how Altwalker V2 works on many timeframes and markets:
LINK/USDT 1h
XLM/BTC 1h
ETH/BTC 1h
ETH/USDT 1h
COMP/USDT 1h
YFI/USDT 15m
NEO/BTC 5m
VET/USDT 15m
This is a premium indicator , so send me a private message in order to get access to this script .
[NLX-L3] Alerts- Introduction: Alert Module -
This alert module is part of my powerful and flexible modular trading framework.
It can be used with any indicator that has a signal plot output (1 = long / -1 = short)
This trading framework is the result of many years experience building indicators and trading strategies.
I couldn’t find a trading framework in Pine Script that would suit my needs and so I started to design my own from scratch. I’m trading with this framework myself so I’ve made sure that it’s flexible and absolutely reliable in a live-trading environment.
- Architecture -
What makes this framework so flexible is the modular architecture, different layers that all serve a very specific purpose.
You will notice that the module names include either L1 - L2 - L3:
- Layer 1 (L1) is the base layer and the foundation. L1 indicators are used to determine the trend, volume profile and filter noise. You would use L1 to see if it’s a good time to trade, what is the direction - or if it's better to trade at all in unfavourable conditions
- Layer 2 (L2) receives the result of L1 and if the market conditions are good the L2 indicator looks for an optimal entry point to go long or short. It is possible to combine several L2 indicators and trigger a long/short signal only if all L2 indicators agree.
- Layer 3 (L3) receives the final signal from L2 and it’s where we can now backtest the result of our trading strategy and trigger trade alerts with help of the alert module.
- Features -
External Input Source (any indicator with signal plot can be used)
Safe Entries Option: Enter a trade only if the position is profitable ad the momentum allows
Pyramid Entries
Partial Take-Profit: %-Step Interval and Quantity per Step
Stop Methods: Trailing Stop, TP/SL with ATR Option, several type of stop bands...
Profit/Loss Label with Fee, Slippage and Leverage Calculation
- Additional Modules -
L3 - Backtest Module
L2 - Noise Filter
L2 - QQE++
L1 - Trend Index
Trend Matrix (Coming soon)
Dynamic Range Breakout (Coming soon)
Breakouts & Pullbacks
- Request Access -
Contact me - see my signature below

Hull MACDMACD constructed using Hull MA and triangular MA.
HMA overshoots while TMA lags, producing an interesting MACD even when the two MAs have the same period.
Coloring shows tops, bots, and inflections.
