Profit-sync script for TrexenThere are various scripts and indicators on Tradingview, but not many of them combine theories to improve the profitability of an indicator using settings from multiple time frames.
This script takes the Average True Range trailing exit idea to enter trades. Many other ideas have been tested to filter entry signals which may be weak or not profitable such as a second ATR with Higher TF, MFI/VFI, RSI, Momentum wavetrend, Weis Wave, MACD, Stochastic etc, but I felt the following works best:
- Over the ATR entries there is a directional filter very similar to Renko candles which can be set to a higher time frame, I use 4 hour with 15 min candles for example, this will only allow 15 min buy signals to execute if the 4 hour is also on the buy side.
- There is also a Trend directional filter which can be set to a higher/lower time frame, currently I am using this on allow setting to allow more trades
The higher both filter are, the more accurate the trades will be, but less frequent. The filters convert entry signals into exit signal which can be used as take profit point with alerts if there is a position open.
The overall theory is to follow trend and to exit with profit. I have tested different take profit alerts but think it’s better to either catch a whole price move or sell with a set trailing limit order at like 0.4/0.5%.
As I am trading BTC with a bot and not with TA I think it is good to get in on a trend reversal, follow the trend up and get out quick with profit. There is a lot of manipulation with crypto so things like Momentum indicators and money-flow may not represent what is actually happening in the market.
Cerca negli script per "bot"

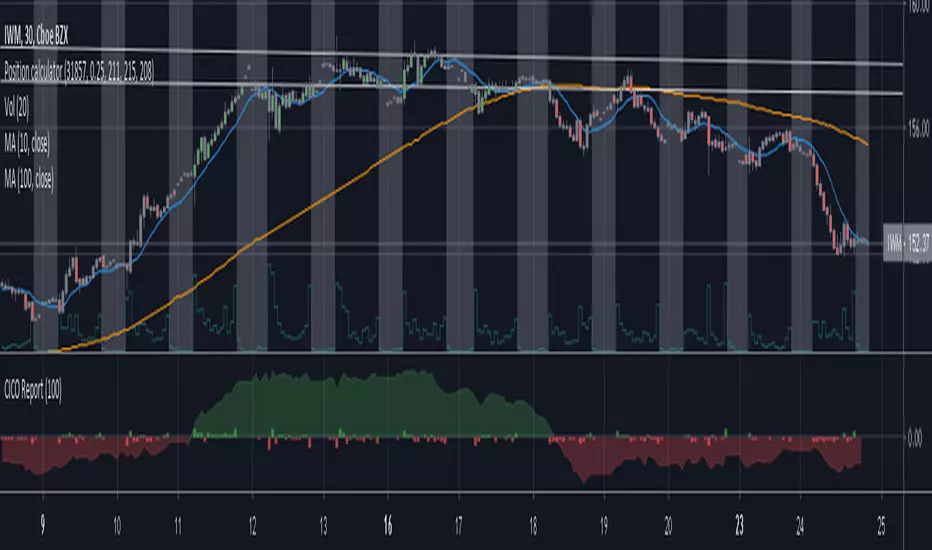
Cash in/Cash out Report (CICO) - Quiets market noiseThe cash in/cash out report (CICO for short) was built with the intent to quiet the market noise. The blunt way to say it, this indicator quiets the market manipulators voice and helps the retail investor make more money. I believe money is better of in the 99% hands versus the greedy hoarding that is currently going on. There are dozens of companies in the SP500 that have the same tax rate as unborn babies, nada. These hoarders also have machine learning high frequency trading bots that purposely create fear and anxiety in the markets. When all of the major markets move at the exact same time of day on frequent occasions, I see red flags. I recommend looking into Authorized participants in the ETF market to understand how the markets can be manipulated, specifically Creation and Redemption.
Enough of my rant. This indicator is open source. Directions on how to use the indicator can be found within the code. The basic summary is, clear your charts to bare minimums. Make the colors gray on all candles. Then apply this indicator. The indicator will color the "buy" and "sell" signals on the chart. Keep in mind, markets are manipulated to create fear in the retail investors little heart and can change drastically at any second. This indicator will show real time changes in running sum into and out of the market, it is estimated by average prices and not exact.
Once the chart is all greyed out and the indicator is applied you will see an area colored red and green. What this indicator does is takes a running sum of the new money into and out of the market. It takes the average of the high and low price times the volume. If the price is going up the value is positive, going down will be negative. Then the running sum is displayed. The area section is the running sum and the column bars are each value. When a market is steadily increasing in value you will see the large green area grow. When markets shift, values and display will change in color and vector. Full descriptions are available within the script in the comment sections.
I hope this help you make more money. If this helps you grow profits, give it a like!
Happy investing 99%er!
ck - CryptoSniper (Indicator) v1Due to popular demand, here is an Indicator version on Cryptosniper v1 (with alerts).
This indicator repaints and should be used with a confirmation indicator as part os your strategy.

VWAP Bands This is a free script I made for the users of my FREE Liquidation Hunter BOT to help visualize vwap offsets over time.

Any MA bands (TMA bands V2)Hi everyone
Website will be opening very shortly :) Sorting out the last details and we're so excited to finally roll-out our different Algorithm Builders for you guys
Forewords
This present script is an evolution of the TMA bands . I would never have expected that script to become so popular to be honest
This is not only a study or idea but a really proven method and I'm glad that many of you are using it already. But please, whenever you see a new script out there, even if it looks cool and promising, please test it on a demo account for a week or on a LIVE account but with tiny amounts every time.
Many times, what you see on the chart is not what will happen in reality. I know that most of you will agree and I know exactly why we see this behavior... I'll give more details in a later post
I have plenty of methods like that one and I'll detail them on my website (and a bit on TradingView) starting next month
TMA bands on steroids
Someone asked me privately to make a generic version of the TMA bands and make it compatible with other standards Moving Average types. That's it for the specifications really as I didn't do much than re-using some piece of my own code
Suggested (but not mandatory) methodology
1) The Take Profit 1 is the middle line, Take Profit 2 is the opposite band.
2) Once the TP1 is hit, set your Stop Loss to breakeven
3) Once the TP2 is hit, if you still want to stay in the trade, set your Stop Loss to the TP1
It will be a powerful tool in your arsenal for some scalp/intraday trades
Wishing you all of you a great and profitable day
PS
It's strictly forbidden to republish this script without my explicit approval. All my posts are copyrighted from now on
Obviously you can use but not republish and get the credit or even worse... some money from your own clients
Dave
____________________________________________________________
Be sure to hit the thumbs up. Building those indicators take a lot of time and likes are always rewarding for me :) (tips are accepted too)
- If you want to suggest some indicators that I can develop and share with the community, please use my personal TRELLO board
- I'm an officially approved PineEditor/LUA/MT4 approved mentor on codementor. You can request a coaching with me if you want and I'll teach you how to build kick-ass indicators and strategies
Jump on a 1 to 1 coaching with me
- You can also hire for a custom dev of your indicator/strategy/bot/chrome extension/python
Disclaimer:
Trading involves a high level of financial risk, and may not be appropriate because you may experience losses greater than your deposit. Leverage can be against you.
Do not trade with capital that you can not afford to lose. You must be aware and have a complete understanding of all the risks associated with the market and trading. We can not be held responsible for any loss you incur.
Trading also involves risks of gambling addiction.
Please notice I do not provide financial advice - my indicators, strategies, educational ideas are intended to provide only some source code for anyone interested in improving their trading
The proprietary indicators and strategies developed by Best Trading Indicator, the object of intellectual property rights are and remain the exclusive property of Best Trading Indicator, at the exclusion of images and videos and texts free of rights or provided by the Company or external legal or physical person.
No assignment of intellectual property rights is carried out through these Terms and Conditions.
Any total or partial reproduction, modification or use of these properties for any reason whatsoever is strictly prohibited without the express written authorization of the Company.

SkyBot - BTC and XBTUSD Trading Bot for CryptoThe SkyBot is written to provide a good balance between long-term trading and short-term for more action. It has been running for over a year before it was decided to share with the public.
SkyBot uses moving price action data from multiple time frames to determine when to go long or short. It also provides the user with the ability to use stop loss and take profit values to match whatever risk management rules you use in your trading.
SkyBot has simple to use alerts making it simple to use with many auto-trading offers.
SkyBot has been coded in the latest version of Pine (v4) and will be updated as new features, functionality, and support is released with Pine.
To get access to SkyBot, please signup here: cryptoscriptking.com
This is the indicator script that is intended to be used to get alerts for the purposes of automation. The strategy script is also included allowing you to do your own backtesting.

Trend Direction Helper (ZigZag and S/R and HH/LL labels)Hey everyone
First of all, I'd like to thank Ricardo Santos, Backtest Rookies for the inspiration for this script.
Actually, most of it is coming from them and I only mixed them up (and added my secret sauce ^^). If some of you are not thinking about a trading secret sauce, please get serious for a moment :)
Some of you asked me how I do to set the trend direction. You all understood that if you get an UP label, then the price should go up and vice-versa for down.
But it's not so easy to define the good signals for each asset and each timeframe. I'm going to repeat what I said yesterday because ... well... that's what trading is about
So quoting myself here "The inputs set by default will have to be changed for your asset/timeframe and can't be generic for everything. You have to play with the inputs until the signals will make sense to you
The indicator/strategy with a unique configuration that you'll never check or update according to the market condition DOES NOT exit. "
BUT... a bit of patience and practice and you might do wonders.
The Method
I never realized until now but by connecting the higher highs/lower lows, I was drawing zigzag lines.
The Zig Zag Master is Ricardo Santos . Please give him a follow, he's awesome
For those who don't want to draw on the chart or (my preferred choice) need some inspiration to define your trend directions, this script is for YOU (and your family, your pet, your girlfriend/boyfriend, ...)
I think that each asset/timeframe chart has its own history. What worked in a post could work in the future.
In that regard, if a trend direction worked in the past, that's the parameter that I'll use to trade with it in a demo account and make sure it's relevant. If not then I will adjust
If you're trading with new indicators or a new method right away on your real trading account, you're gonna have a bad time imgflip.com
Lines EVERYWHERE
The script draws the classical horizontal pivots + the zig zag lines + the Higher Highs/Lower Lows label in just 1 script. I'm very excited to share a script (on which I coded 100 lines out of 500) but no one else did it
The horizontal pivots part are coming from Backtest Rookies
For more security, you can add a pullback on a moving average after getting a signal. Pullbacks are necessary to limit any eventual loss or maximize your gains by getting in the trend sooner.
I really give you a solid method and a great script in my opinion. 6 years of experience given away for FREE :p (when Dave will start thinking as a business man instead :O)
Does it repaint ?
Getting this question twice a day. You guys are obsessed with the repainting :)
Short answer, yes because it will calculate the pivots and zig zags whenever new higher highs/lower lows will be formed.
However, the trend direction code is based on the candle close so it shouldn't repaint. If it does, please let me know
See you all on Monday
Love you all
Dave
____________________________________________________________
Be sure to hit the thumbs up. Building those indicators take a lot of time and likes are always rewarding for me :) (tips are accepted too)
- If you want to suggest some indicators that I can develop and share with the community, please use my personal TRELLO board
- I'm an officially approved PineEditor/LUA/MT4 approved mentor on codementor. You can request a coaching with me if you want and I'll teach you how to build kick-ass indicators and strategies
Jump on a 1 to 1 coaching with me
- You can also hire for a custom dev of your indicator/strategy/bot/chrome extension/python
Disclaimer:
Trading involves a high level of financial risk, and may not be appropriate because you may experience losses greater than your deposit. Leverage can be against you.
Do not trade with capital that you can not afford to lose. You must be aware and have a complete understanding of all the risks associated with the market and trading. We can not be held responsible for any loss you incur.
Trading also involves risks of gambling addiction.
Please notice I do not provide financial advice - my indicators, strategies, educational ideas are intended to provide only some source code for anyone interested in improving their trading
The proprietary indicators and strategies developed by Best Trading Indicator, the object of intellectual property rights are and remain the exclusive property of Best Trading Indicator, at the exclusion of images and videos and texts free of rights or provided by the Company or external legal or physical person.
No assignment of intellectual property rights is carried out through these Terms and Conditions.
Any total or partial reproduction, modification or use of these properties for any reason whatsoever is strictly prohibited without the express written authorization of the Company.

CCI Stochastic and a quick lesson on Scalping & Trading SystemsHello traders
Still on holidays but I don't and will never forget you <3
I realize more and more that you guys don't only want some indicators and learn about pinescript. You also want some guidance and get some mentors providing you with comprehensive and simple trading methods and tricks.
I'm against those posting many scripts a day that in the end will make you lose your money because they don't give you the methodology to use them
It might look nice on the charts but we're not here to do some painting.... but to improve our lifestyle right :)
The today indicator is based on an indicator that I used for scalping : Fxcodebase CCI Stochastic
A CCI stochastic is very reactive and allows us to take many scalps trades per day with a few pips/USD gain for each trade. I don't recommend novice traders to use it and I strongly recommend everyone reading my disclaimer below basically saying "I'm not a financial advisor, don't be dumb, stay safe"
(I also recommend the few scripts copy-pasters to read my disclaimer as well)
What's a novice trader, sir? Well... thanks for asking. A novice trader is any trader with less than 5 years of live trading experience
From a pinescript perspective, this script will be however interesting for everyone :)
How to use it?
The indicator gives 3 possible entries for Longs and Shorts:
- Arrows at Enter - Will give signals whenever the Stoch CCI will enter in the BUY/SELL zone
- Arrows at Exit - Will give signals whenever the Stoch CCI will exit the BUY/SELL zone
- Arrows at Center - Signals whenever the Stoch CCI will cross the mid-line (50)
All arrows have different colors because ... painting is cool and nice.... kidding.... it gives clearer and more readable signals on the chart (but painting sir...)
A possible trading method could be to use the 3 modes at the same time to get the maximum of opportunities.
The safer bet is to use the "Arrows at Exit" only mode but for those who want to accumulate more scalping positions, adding the "Arrows at Enter" mode is an option as well. In other words, you accumulate a few scalping positions whenever the Stoch CCI get in the BUY/SELL zone and will stop accumulating whenever it will exit the BUY/SELL zone
You can add a few extra positions whenever the Stoch CCI will cross the mid-line as it often translates in a trend continuation
Life hack
Very important note : (probably the most important gem I shared until now) The inputs set by default will have to be changed for your asset/timeframe and can't be generic for everything. You have to play with the inputs until the signals will make sense to you
The indicator/strategy with a unique configuration that you'll never check or update according to the market condition DOES NOT exit.
If you find such a tool and prove me that you're making constant gains with it over a year, please patent it and then show it to me as I'd like to study it to replicate :) But most likely this is a myth/unicorn
Who I am to say this? Well, I worked in a Bank with real traders and I have a good sense of what works and what will certainly not work
My guru said scalping crypto in 1 second timeframe was the way to get rich quick. Do you agree sir?
But in trading, this is not because you take the maximum of trades possible that your gains will increase. This is the contrary.
There is a strong and proven inverse correlation between the number of trades taken and how fast you'll burn your capital. A swing trader taking 2/3 trades a month is more likely to beat 99% of the scalpers out there trying to predict all market movements. (and I'm not even talking about how dangerous it is to scalp with leverage)
You're starting to know me a bit more right now. I prefer to tell you what you need to hear vs what you want to hear because the second option doesn't allow to stay in the game very long.
I might lose some futures clients along the way by saying that but for my own conscience and ethics, I prefer to warn about the true risks of trading and to select who you listen very carefully (the advice also works for me, if you feel what I said doesn't make sense, this is totally your right but I hope this is because I'm french and not because of the content ^^).
See you tomorrow for another indicator or idea
Love you all
Dave
____________________________________________________________
Be sure to hit the thumbs up. Building those indicators take a lot of time and likes are always rewarding for me :) (tips are accepted too)
- If you want to suggest some indicators that I can develop and share with the community, please use my personal TRELLO board
- I'm an officially approved PineEditor/LUA/MT4 approved mentor on codementor. You can request a coaching with me if you want and I'll teach you how to build kick-ass indicators and strategies
Jump on a 1 to 1 coaching with me
- You can also hire for a custom dev of your indicator/strategy/bot/chrome extension/python
Disclaimer:
Trading involves a high level of financial risk, and may not be appropriate because you may experience losses greater than your deposit. Leverage can be against you.
Do not trade with capital that you can not afford to lose. You must be aware and have a complete understanding of all the risks associated with the market and trading. We can not be held responsible for any loss you incur.
Trading also involves risks of gambling addiction.
Please notice I do not provide financial advice - my indicators, strategies, educational ideas are intended to provide only some source code for anyone interested in improving their trading
The proprietary indicators and strategies developed by Best Trading Indicator, the object of intellectual property rights are and remain the exclusive property of Best Trading Indicator, at the exclusion of images and videos and texts free of rights or provided by the Company or external legal or physical person.
No assignment of intellectual property rights is carried out through these Terms and Conditions.
Any total or partial reproduction, modification or use of these properties for any reason whatsoever is strictly prohibited without the express written authorization of the Company.

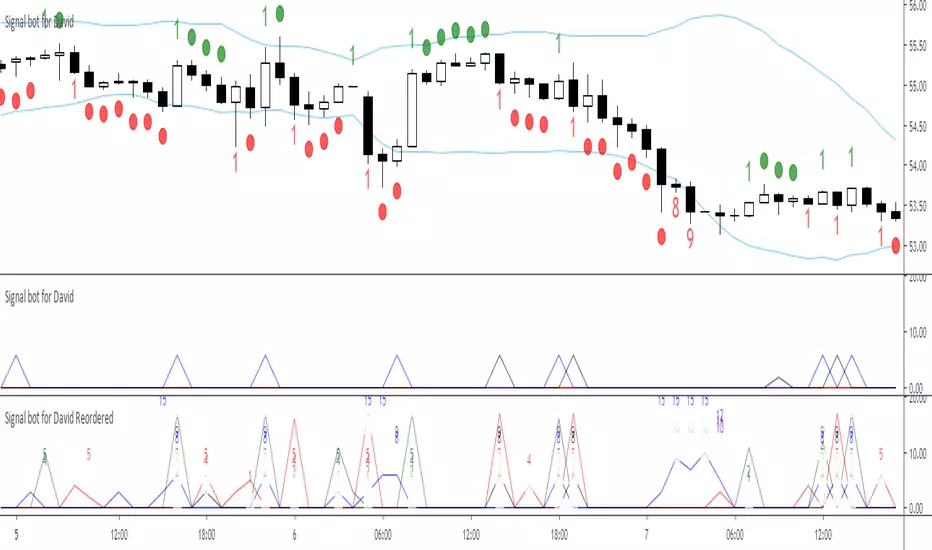
Signal bot for David Reordered
New #2
#2-5.5
Old #10 - remove TD10
#1 - body vs avg, body vs max, high vs high, high vs avg(high)
#1 - option for compare wick/close to prev body
Min body 0
TD next, using close/range to compare
BB & EMA use prev value
#10 add min body
#11 toggle all TD/TD1 + show score
#12 13, add toggle compare body
#14 check score (bug)
#20 21 double if consecutive
Comparison logic, right now new #4, 5, 11
Change order
Your CRYPTO Screener - MACD 0 LAG editionHello traders
What's good?
1 - Quick introduction
This script is to demonstrate a proof-of-concept - showing you again what you thought wasn't possible might become (with some tricks) in the realm of possibles !!!.
I get requests for people who want a custom screener because the native TradingView Stocks/Forex/Crypto screeners don't allow to plug external indicators. (example: www.tradingview.com
This is entirely true and I have also good news for you, we can hack the system one more time. As Hackerman would say, "IT"S HACKING TIME !!!" (ref : KUNG FURY . (#geek #reference #done #for #today)
What if you could build your own personalized screener based on your custom indicator? "No Dave stop smoking, that's not possible, go back to eating your baguette". Say no more, let me present you my new script called YOUR CRYPTO Screener (MACD 0 LAG)
2 - What is a MACD ZERO LAG?
We'll all agree this indicator is NOT in the TradingView screeners so I'm not cheating here :)
A MACD ZERO LAG is a MACD that .... suspens.... wait for it.... DOES NOT lag.
The traditional MACD is based on exponential moving averages and as moving averages are lagging, then the MACD is lagging also. I'll spare you all the maths behind the MACD ZERO LAG but in short, this is a way more reactive indicator than the traditional MACD
I shared before the version that I personally use for my own trading : MACD 0 LAG nTREND coloring
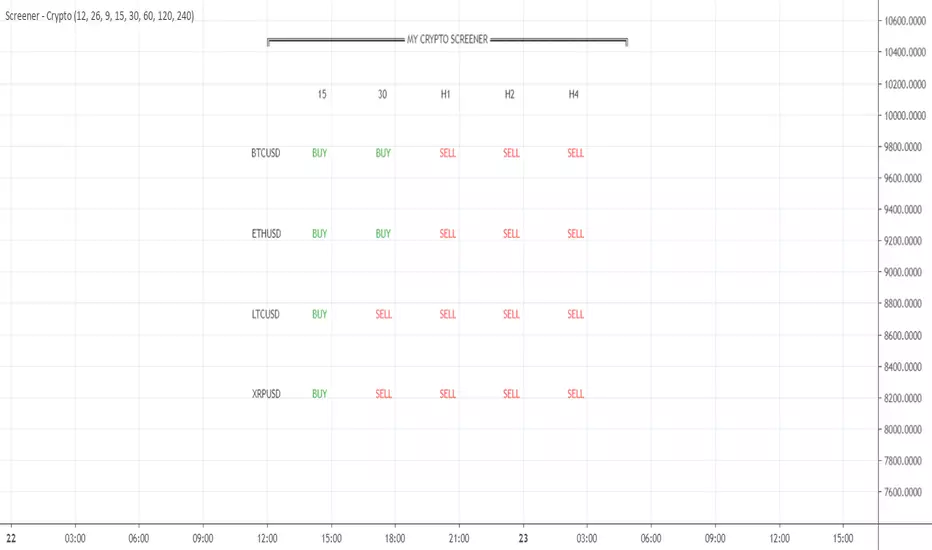
3 - Crypto Screener specifications
If I could do a screener as complete as the native one, this would be wonderful but ... we cannot and this is due to technical reasons. To call indicators from different timeframes, I have to use the security function. And we're limited to 40 security calls per indicator.
That explains why I selected 4 crypto assets and 5 timeframes and the MACD zero lag output for each asset/timeframe - which gives a total of 4 * 5 * 2 = 40
You'll be able to select from the interface the 5 timeframes that you want for your screener
In this script, you'll get a :
- BUY whenever the MACD ZERO LAG for your asset/timeframe is green.
- SELL whenever the MACD ZERO LAG for your asset/timeframe is red.
4 - Can you hack it even more?
If you want to add other timeframes or assets, you can either, change the code or add the indicator on another chart.
I made the source code generic enough so that you can update it yourself easily
Example:
Chart 1 will list BTCUSD, ETHUSD, LTCUSD, and XRPUSD in m5/m15/m30/H1/H4 and Chart2 could list BTCUSD, ETHUSD, LTCUSD and XRPUSD in H6/H8/H12/Daily, etc...
Once again the sky (and your computer RAM capacity) is the limit
5 - Can you super hack it even more?
1/ This script is only a proof-of-concept that you can build your own custom screener. Imagine having the Algorithm Builder and being able to connect it in a single click to a custom screener using your own configuration :)
How coooooooooooooooool would that be!!!
This screener version will be available on my website in a few weeks along with all the tools I'm spamming you about since the beginning of July (#shameless #self-advertising)
2/ For a nicer scripter, let's keep in mind that TradingView just enabled Webhooks this week. This will allow my company to offer custom screeners design and hosted on your own website. Those screeners will be for sure nicer than the indicator version
That's it for today and for this week
I won't even touch the laptop this weekend and will enjoy life a bit
Love you all
Dave
____________________________________________________________
Be sure to hit the thumbs up. Building those indicators take a lot of time and likes are always rewarding for me :) (tips are accepted too)
- If you want to suggest some indicators that I can develop and share with the community, please use my personal TRELLO board
- I'm an officially approved PineEditor/LUA/MT4 approved mentor on codementor. You can request a coaching with me if you want and I'll teach you how to build kick-ass indicators and strategies
Jump on a 1 to 1 coaching with me
- You can also hire for a custom dev of your indicator/strategy/bot/chrome extension/python

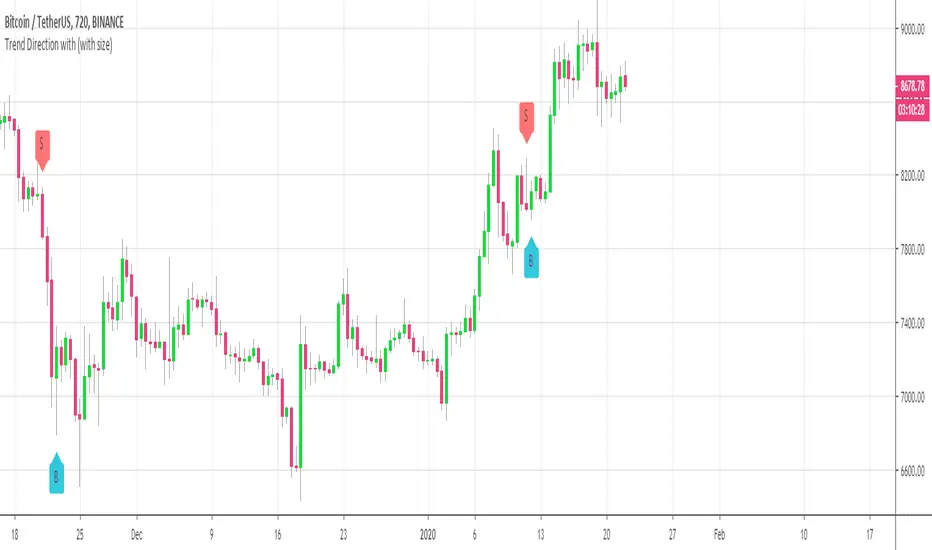
Customizable Trend Direction (Open-Source)Hello everyone
I received a ton of requests for this script so I decided to share it
I did it for a client who didn't want to pay (you can all blame... or even thank him for this script) in the end and I don't want to sell it on my website.
Not because it's not interesting but because my website will be a place to showcase and rent the Algorithm Builders mostly
What is it about?
Basically, it shows how you could convert a plotshape into a label.new object. Very interesting if you want someday to convert your V3 script into V4
With this script, it shows that you can in V4 ( but couldn't do in V3 ) do the followings :
- change dynamically the size (from tiny to huge) of any object
- change dynamically the text (from whatever to whatever) of any object
Screenshot of the user interface
imgur.com
Other use cases
I did it with the Trend Direction but could work with anything really.
- Any indicator with a visual signal. You can know personalized from a user interface the text, size and also the vertical shift. I didn't do it for that one but label.new takes a (x,y) coordinates so playing with y is fairly easy to achieve a dynamic vertical shift
- Even with this script Plotchar-How-to-draw-external-symbols-on-a-chart/ but would require to be updated with a label.new object and with a shape.none parameter so that we'll only see the icon/symbol displayed
- The colors also can be change dynamically using presets Presets-Selector-FRIDAY-NIGHT-CHALLENGE/ . If you have an indicator showing a BULLISH and a BEARISH signal, then you could, for instance, configure colors presets according to the timeframe of the chart or the indicator input, etc (sky is the limit ^^)
Be sure to hit the thumbs up at it motivates me to research what Pinescript can offer and share with the community
Dave
____________________________________________________________
- I'm an officially approved PineEditor/LUA/MT4 approved mentor on codementor. You can request a coaching with me if you want and I'll teach you how to build kick-ass indicators and strategies
Jump on a 1 to 1 coaching with me
- You can also hire for a custom dev of your indicator/strategy/bot/chrome extension/python
Plotchar - How to draw external symbols on a chartHey everyone
It's been a while :) but still on holidays and working on the website. I'll resume the scripts sharing shortly once I'll get back home
For today, I wanted to share a very useful script that is going to make you a top of money 100% guaranteed and you'll even have a Lamborghini delivered at your place by tomorrow... (imagine some followers would believe me for this)
This "script" is a proof of concept that you can draw external Unicode symbols on a chart.
If you're tired with the plotshape shapes by default, you can use some others - I usually find mine there emojipedia.org
What are the use cases?
- Draw a dead skeleton when your stop-loss is hit
- Draw a winning cup when your take profit is hit
- Draw a coffin when you run out of capital
FAQ
Q: Does this script has any interest?
A: I'm not sure myself
Q: Will you make money using it?
A: I'm not a financial advisor but ... very likely NO
Q: Is it cool though?
A: Hell yeah!!
Be sure to hit the thumbs up so that I'll share real scripts the next times and not "joke scripts". I promise it's the first and last time I'm sharing such a script
Dave
____________________________________________________________
- I'm an officially approved PineEditor/LUA/MT4 approved mentor on codementor. You can request a coaching with me if you want and I'll teach you how to build kick-ass indicators and strategies
Jump on a 1 to 1 coaching with me
- You can also hire for a custom dev of your indicator/strategy/bot/chrome extension/python
Correlation MATRIX (Flexible version)Hey folks
A quick unrelated but interesting foreword
Hope you're all good and well and tanned
Me? I'm preparing the opening of my website where we're going to offer the Algorithm Builder Single Trend, Multiple Trends, Multi-Timeframe and plenty of others across many platforms (TradingView, FXCM, MT4, PRT). While others are at the beach and tanning (Yes I'm jealous, so what !?!), we're working our a** off to deliver an amazing looking website and great indicators and strategies for you guys.
Today I worked in including the Trade Manager Pro version and the Risk/Reward Pro version into all our Algorithm Builders. Here's a teaser
We're going to have a few indicators/strategies packages and subscriptions will open very soon.
The website should open in a few weeks and we still have loads to do ... (#no #summer #holidays #for #dave)
I see every message asking me to allow access to my Algorithm Builders but with the website opening shortly, it will be better for me to manage the trials from there - otherwise, it's duplicated and I can't follow all those requests
As you can probably all understand, it becomes very challenging to publish once a day with all that workload so I'll probably slow down (just a bit) and maybe posting once every 2/3 days until the website will be over (please forgive me for failing you). But once it will open, the daily publishing will resume again :) (here's when you're supposed to be clapping guys....)
While I'm so honored by all the likes, private messages and comments encouraging me, you have to realize that a script always takes me about 2/3 hours of work (with research, coding, debugging) but I'm doing it because I like it. Only pushing the brake a bit because of other constraints
INDICATOR OF THE DAY
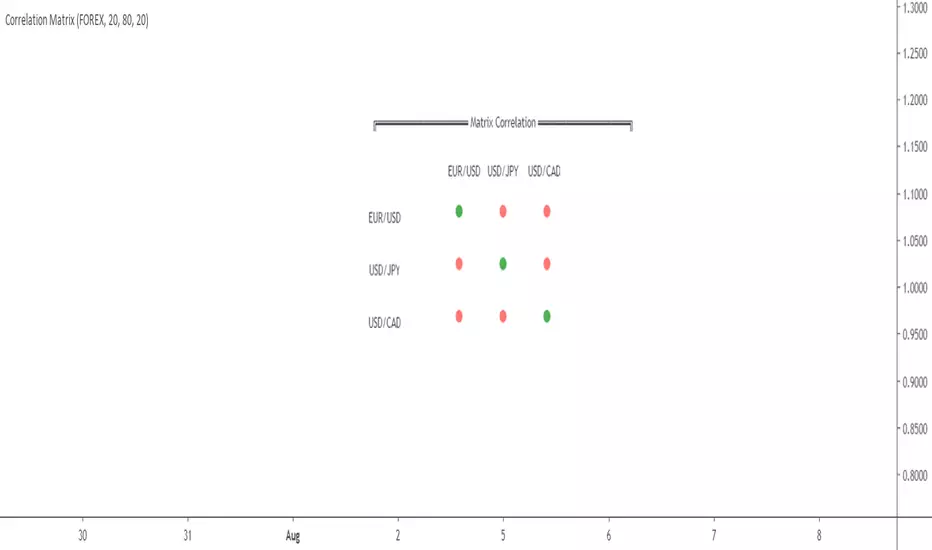
I made a more flexible version of my Correlation Matrix .
You can now select the symbols you want and the matrix will update automatically !!! Let me repeat it once more because this is very cool... You can now select the symbols you want and the matrix will update automatically :)
Actually, I have nothing more to say about it... that's all :) Ah yes, I added a condition to detect negative correlation and they're being flagged with a black dot
Definition : Negative correlation or inverse correlation is a relationship between two variables whereby they move in opposite directions.
A negative correlation is a key concept in portfolio construction, as it enables the creation of diversified portfolios that can better withstand portfolio volatility and smooth out returns.
Correlation between two variables can vary widely over time. Stocks and bonds generally have a negative correlation, but in the decade to 2018, their correlation has ranged from -0.8 to 0.2. (Source : www.investopedia.com
See you maybe tomorrow or in a few days for another script/idea.
Be sure to hit the thumbs up to cheer me up as your likes will be the only sunlight I'll get for the next weeks.... because working on building a great offer for you guys.
Dave
____________________________________________________________
- I'm an officially approved PineEditor/LUA/MT4 approved mentor on codementor. You can request a coaching with me if you want and I'll teach you how to build kick-ass indicators and strategies
Jump on a 1 to 1 coaching with me
- You can also hire for a custom dev of your indicator/strategy/bot/chrome extension/python

TrendAID XVPlay off of TrendAID in which you are able to set alerts to fire towards your email and or bot if you have the capabilities :)
Alerts are
Long
Short
Close Long
Close Short
Close Long (stop)
Close Short (stop)

Presets Selector - FRIDAY NIGHT CHALLENGEBonjour/Salut ça va?
Ok enough for the french :) You guys should really stop challenging me on things on Pinescript and asking me if it's possible or not because... that's the second time in a row I'm about to reveal a nice trick
Please take this example as a proof of concept/feasability. This follower said "I'm tired of manually filling the fields of my indicator, my fingers are dead.... every time I change something in the code, I lose the configuration by default"
Say no more sir.... challenge accep..... wait for it ....ted (that's his real name actually) !!!!
Mesdames et messieurs (damn... my french accent is back), let's unveil the curtain on... the PRESETS SELECTOR (please try to imagine someone super famous shouting it and everyone standing and clapping their hands...)
What I mean by presets is THIS
I inspired myself from this script MacD-Custom-Indicator-Multiple-Time-Frame-All-Available-Options/ (this guy has more likes in a single indicator than me and my friends and my family in all social media channels combined over the past 15 years or so....#humbled)
Anywoo.... the concept is that you can define presets in your script .... which is not possible by TradingView at the moment. If you always have the same set of parameters for a given indicator, please think about your fingers too and give them some rest by implementing a preset in the code directly
I also added a few features :
- You can choose the resolution of the indicator (from 1 minute to 1 month)
- You can choose also between displaying a MACD or a MACD ZERO LAG
Imagine now you have a super complex backtest with hundreds of fields... and unfortunately ... you'll have to fill some of them for each of your tests. Might change in the future if TradingView will add the feature though :)
PS
I'm writing the Algorithm Builder documentation this weekend and the website should open in 3 weeks maximum. I think it's one of the most beautiful trading websites I've seen ever (I didn't do it, my friend did but who cares... it's mine :p)
PS2
I didn't post yesterday the script of the day so I'll post it tomorrow. What is due is due and I won't fail my challenge even ONCE !!!! ("But you just did yesterday bro...")
Have a great weekend
Dave
____________________________________________________________
Be sure to hit the thumbs up
- If you want to suggest some indicators that I can develop and share with the community, please use my personal TRELLO board
- I'm an officially approved PineEditor/LUA/MT4 approved mentor on codementor. You can request a coaching with me if you want and I'll teach you how to build kick-ass indicators and strategies
Jump on a 1 to 1 coaching with me
- You can also hire for a custom dev of your indicator/strategy/bot/chrome extension/python

Supertrend Heatmap Multi timeframesHey everybody
A follower asked me if the heatmap is only applicable to detect Moving Averages crosses... I told him I'll publish a script answering his question. Here's your answer my friend: HELL NOOOOOOOOOOO !!!!
My heatmap works with any indicator and any timeframe.
In this script, I did it with a collection of supertrend in different timeframes but the possibilities are limitless. I shared in the past my Supertrend collector displaying multiple supertrends in different timeframes
In case you don't like this kind of display, here's an alternative again. You can call me the HEATMAP guy or the ALTERNATIVE INDICATOR guy from now on .... (Dave is fine too)
Please take a look here and you'll understand right away how to read this heatmap Example with the Daily Supertrend
Basically, there is a line per timeframe and whenever the supertrend changes color in a given timeframe, it will get updated into the heatmap as well !! #amazing #awesome #so#coool#bro
Obviously, I won't post the heatmaps for all the indicators in the world, I'm very sure I'll get the same amount of likes and engagement but it's not challenging for me and... to be honest it won't be interesting at some point for you guys. I'm sharing this one because this is an alternative to the supertrend collector and I feel it could interest many of you.
PS
You're a lot (and I really mean a lot asking me about the Algorithm Builder), I don't communicate too much because I'm writing the documentation and I'll be finished by the end of this week.
Love you all (even the trolls)
Dave
____________________________________________________________
Be sure to hit the thumbs up
- If you want to suggest some indicators that I can develop and share with the community, please use my personal TRELLO board
- I'm an officially approved PineEditor/LUA/MT4 approved mentor on codementor. You can request a coaching with me if you want and I'll teach you how to build kick-ass indicators and strategies
Jump on a 1 to 1 coaching with me
- You can also hire for a custom dev of your indicator/strategy/bot/chrome extension/python
- if you like my work and wants to buy me some coffee :
- BTC TipJar: 3MKDve7stWTe1io99oFxeQXvP8XB4zCQ8m
- LTC TipJar: MC5oeBAhw9BLqyi65TR3J1Lid8io9uHADw

Candles - Cheat SheetWhat is up y'all ? (french trying to sound American)
I found that in my script archives, way back in an old cave. I think this might be useful as a few really asked me how to define a green/red candle, how to capture the wick value, the body, etc..
This is not a fancy script as usual and I'm sure they're plenty of candles pattern scripts out there but I saw no one sharing a simple candle cheat sheet for pinescript coding
Being able to define candles using codes is an essential skill to have for any Pinescripter
Still on the train so won't write a roman as usual... Kidding... I actually did it here What-is-an-Hard-Exit-and-a-few-notes-on-trading-management/
It won't bring me as many likes as any magic p**p cannon accounts promising the moon at each trade but if I can help at least 1 trader a day not losing his/her money, I'll be happy and my daily goal will be fulfilled
All the best
Dave
____________________________________________________________
Be sure to hit the thumbs up
- I'm an officially approved PineEditor/LUA/MT4 approved mentor on codementor. You can request a coaching with me if you want and I'll teach you how to build kick-ass indicators and strategies
Jump on a 1 to 1 coaching with me
- You can also hire for a custom dev of your indicator/strategy/bot/chrome extension/python
Correlation Matrix by DaveattHi everyone
A co-pinescripter friend told me this was impossible to do and we bet a free dinner tomorrow. Guess who's going to be invited to a very fancy restaurant tomorrow :) :) :) (hint: not him)
What's the today script is about?
This script is based on this MT4 correlation matrix
Asset correlation is a measure of how investments move in relation to one another and when. ... Under what is known as modern portfolio theory, you can reduce the overall risk in an investment portfolio and even boost your overall returns by investing in asset combinations that are not correlated.
I did it because it wasn't existing before with this format. What I discovered was only correlations shown as plot lines... #this #is #not #pretty
How does it work?
The correlation matrix will not be based on the current asset of the chart BUT will be based on the current timeframe (confusing? if yes, read it again until you'll get it)
- Numbers of bars back: numbers of bars used for the correlation calculation
- High correlation level: Correlation upper threshold. If above, then the correlation will be green
- Low correlation level: Correlation lower threshold. If below, then the correlation will be red
If the correlation is between the high and low levels, then it will be displayed in orange
- FOREX/INDEX: You can choose between displaying the correlation matrix between 3 FOREX or 3 INDEX assets
Also...
So far the scale doesn't respond too well to the matrix so you'll have to adapt the scale manually. I'll publish a V2 if I'll find a way to solve this issue from the code directly #new #challenge
A quick final note on why I'm sharing so much?
It challenges me to think out of the norm, get out of my bubble and explore areas of Pinescript that I still don't know. This "a script a day" challenge allows me to speed up my learning curve on Pinescript by a billion factor (and I get a few interesting gigs as well)
Let's bring this indicator to 100 LIKES guys !!!!! I think it deserves it, don't you think? :)
PS
Before all copy/pasters will add a version with crypto tomorrow, don't bother, I already did it and will post it in a few minutes for FREE :p
____________________________________________________________
Be sure to hit the thumbs up as it shows me that I'm not doing this for nothing and will motivate to deliver more quality content in the future.
- I'm an officially approved PineEditor/LUA/MT4 approved mentor on codementor. You can request a coaching with me if you want and I'll teach you how to build kick-ass indicators and strategies
Jump on a 1 to 1 coaching with me
- You can also hire for a custom dev of your indicator/strategy/bot/chrome extension/python
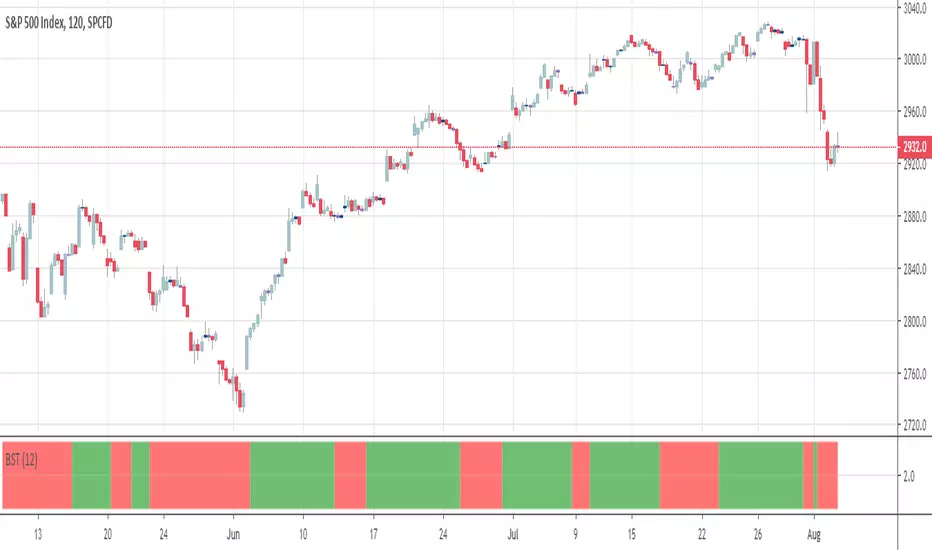
BSTtrend (and a quick note on trading psychology)Hi again :)
Script #2 for tonight, more to come :)
This one is a Pine transcription of a FXCM/LUA script called BSTrend
I used it years ago to trade index on very low timeframes with it. I'm always looking for oscillators that are more reactive than the traditional MACD. And even more reactive than the MACD Zero Lag
This is a proof of concept that Pinescript is my favorite trading programming language vs MT4/LUA/PRT. I just find it easier and the Pinescript community is helping a lot
With the BSTrend you can win but also lose. I see a lot of scripts out there but there is not a better or worst indicator. The key is HOW to use it.
In other words the key is your PSYCHOLOGY, without a rock-solid psychology, you'll end up committing a mistake even with G. himself whispering "BUY NOW", "SELL NOW" to your ears. (wait..... Do you mean this is happening only to me ????)
However, indicators help immensely in reducing the psychology pressure that we have to endure ... sometimes for days..... But better not to overcharge with dozens of indicators per chart and have a tool to detect whenever there is a confluence/convergence of your favorite indicators :) #algorithm #builder
I'll publish an educational post about next week
Those are the exact words that my mentor traders told me 6 years ago when I started trading
PS
____________________________________________________________
Be sure to hit the thumbs up as it shows me that I'm not doing this for nothing and will motivate to deliver more quality content in the future.
- I'm an officially approved PineEditor/LUA/MT4 approved mentor on codementor. You can request a coaching with me if you want and I'll teach you how to build kick-ass indicators and strategies
Jump on a 1 to 1 coaching with me
- You can also hire for a custom dev of your indicator/strategy/bot/chrome extension/python
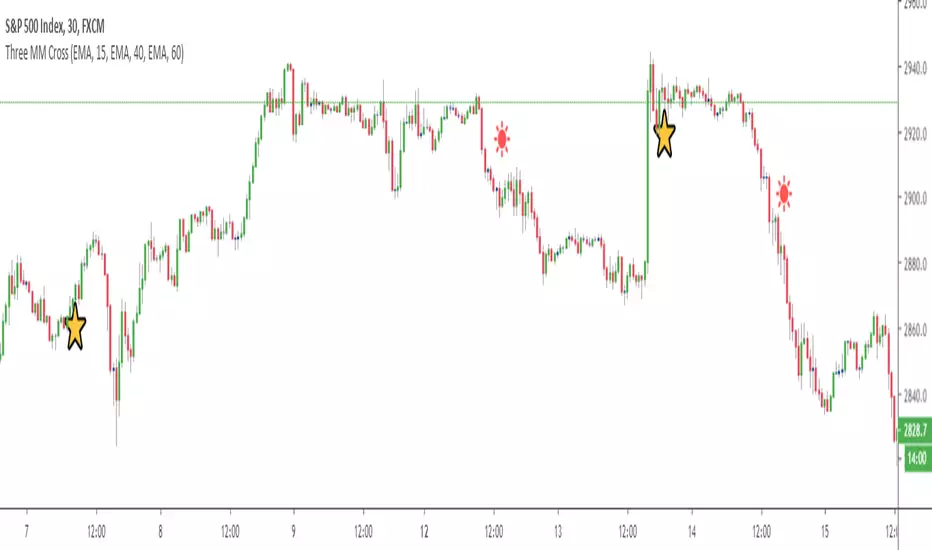
Triple Moving Average HeatmapHi everyone
I didn't publish on Friday because I was working on an Expert Advisor in MT4. The day I don't publish, some scripts spamming guys published many (not useful) scripts the same to kick me out of the TOP #1 ranking.
So what I'm going to do about it? crying or sharing more quality scripts than before? :)
I guess you know the answer :) I'm gonna share a few quality scripts that I have in my library. I noticed that you guys tend to like more the scripts useful for your trading actually making you money rather than a copy-paste (of another copy-paste)
Alright, enough for the trolling now let's introduce the Three MA heatmap which is an upgrade of that script : MA-heatmap-Double-cross-edition/
The challenge was to keep the heatmap not rolling and to make it match with the MA cross. I did it using this
```
since_ma_buy = barssince(macrossover)
since_ma_sell = barssince(macrossunder)
heatmap_color() =>
since_ma_buy < since_ma_sell ? color.new(color.green, 20) : since_ma_buy > since_ma_sell ? color.new(color.red, 20) : na
```
This is a technique that I found after drinking three glasses of red wine (#french) to keep the heatmap stable and not rolling.
To get what I'm saying I invite you to replace the piece of code above by what everyone would normally do
```
heatmap_color() =>
macrossunder() ? color.new(color.green, 20) : macrossover() ? color.new(color.red, 20) : na
```
Ah and I'm not done sharing for the day, a few scripts are coming also after that one and tonight !!!!! I want to live in a world where you guys can enjoy quality scripts (mostly) :)
PS
____________________________________________________________
Feel free to hit the thumbs up as it shows me that I'm not doing this for nothing and will motivate to deliver more quality content in the future.
- I'm an officially approved PineEditor/LUA/MT4 approved mentor on codementor. You can request a coaching with me if you want and I'll teach you how to build kick-ass indicators and strategies
Jump on a 1 to 1 coaching with me
- You can also hire for a custom dev of your indicator/strategy/bot/chrome extension/python

Crypto Prices InfoPanel V2Hello traders
Following the introduction of ByBit to TradingView ByBit on TradingView
I decided to upgrade my previous Bitcoin InfoPanel Bitcoin-Prices-InfoPanel/
Now it's more dynamic (thumbs up) but only work with Bitcoin, Ethereum and Litecoin . If you select any other asset than those 3, the script won't work
This is due to a technical limitation on TradingView because I can't do more than 40 security calls per script
If you don't know what the security function is, here's a reminder : Security documentation . If you don't know what is TradingView... I cannot do anything for you...
Now you can use this panel to have a very cool arbitrage view directly from TradingView and use the info to gamble between brokers (not financial advice)
See you all tomorrow for a huge update regarding the Strategy Builder. I'll show you how to connect it to a Backtest system
____________________________________________________________
Feel free to hit the thumbs up as it shows me that I'm not doing this for nothing and will motivate to deliver more quality content in the future.
- I'm an officially approved PineEditor/LUA/MT4 approved mentor on codementor. You can request a coaching with me if you want and I'll teach you how to build kick-ass indicators and strategies
Jump on a 1 to 1 coaching with me
- You can also hire for a custom dev of your indicator/strategy/bot/chrome extension/python

Triangular Moving Average (TMA) bandsWhat in the world is up folks ??!??
Here's the indicator of the day. Sharing a simple one today because I'm busy coding for a few clients (fun life of a top script author on TradingView)
The TMA bands is an indicator that I discovered on FXCM a few years ago FXCM TMA bands
From the screenshot above, we see that when the price hits the lower band, it's a possible reverse BUY signal. When it hits the upper band, it's a possible SELL signal
Methodology
1) The Take Profit 1 is the middle line, Take Profit 2 is the opposite band.
2) Once the TP1 is hit, set your Stop Loss to breakeven
3) Once the TP2 is hit, if you still want to stay in the trade, set your Stop Loss to the TP1
That's what we call a trailing stop loss which I offered in the Trade Manager : Trade-Manager-Open-Source-Version/
It will be a powerful tool in your arsenal for some scalp/intraday trades
After years of coding for traders, I worked with many brokers/API/languages so I'm very used to convert a script from a broker to another one (shameless self-advertising)
PS
Tomorrow I'll share the Signal version of my Algorithm Builder:
You'll be able to connect it in a single click to a very cool Backtest System made by the Pinescripters community
In other words, I'm selling the scripts to allow you to build your own signals in a few clicks AND to connect it easily to a kick-ass backtesting tool. More to come tomorrow
Hope you'll like it, like me, love it, love me, tip me :)
____________________________________________________________
Feel free to hit the thumbs up as it shows me that I'm not doing this for nothing and will motivate to deliver more quality content in the future. (Meaning... a few likes only = no indicators = Dave enjoying the beach)
- I'm an officially approved PineEditor/LUA/MT4 approved mentor on codementor. You can request a coaching with me if you want and I'll teach you how to build kick-ass indicators and strategies
Jump on a 1 to 1 coaching with me
- You can also hire for a custom dev of your indicator/strategy/bot/chrome extension/python
