Targets For Overlay Indicators [LuxAlgo]The Targets For Overlay Indicators is a useful utility tool able to display targets during crossings made between the price and external indicators on the user chart. Users can display a series of two targets, one for crossover events and another one for crossunder event.
Alerts are included for the occurrence of a new target as well as for reached targets.
🔶 USAGE
In order for targets to be displayed users need to select an appropriate input source from the "Source" drop-down input setting. In the example above we apply the indicator to a volatility stop.
This can also easily be done by adding the "Targets For Overlay Indicators" script on the VStop indicator directly.
Targets can help users determine the price limit where the price might start deviating from an indication given by one or multiple indicators. In the context of trading, targets can help secure profits/reduce losses of a trade, as such this tool can be useful to evaluate/determine user take profits/stop losses.
Due to these essentially being horizontal levels, they can also serve as potential support/resistances, with breakouts potentially confirming new trends.
Users might be interested in obtaining new targets once one is reached, this can be done by enabling "New Target When Reached" in the target logic setting section, resulting in more frequent targets.
Lastly, users can restrict new target creation until current ones are reached. This can result in fewer and longer-term targets, with a higher reach rate.
🔹 Examples
The indicator can be applied to many overlay indicators that naturally produce crosses with the price, such as moving average, trailing stops, bands...etc.
Users can use trailing stops such as the SuperTrend or VStop to more easily create clean targets. Do note that certain SuperTrend scripts separate the upper and lower extremities of the SuperTrend into two different plot, which cannot be used with this tool, you may use the provided SuperTrend script below to have a compatible version with our tool:
//@version=5
indicator("SuperTrend", overlay = true)
factor = input.float(3, 'Factor', minval = 0)
atrLen = input.int(10, 'ATR Length', minval = 1)
= ta.supertrend(factor, atrLen)
plot(spt, 'SuperTrend', dir != dir ? na : dir < 0 ? #089981 : #f23645, 2)
plot(spt, 'Circles', dir > dir ? #f23645 : dir < dir ? #089981 : na, 3, plot.style_circles)
Using moving averages can produce more targets than other overlay indicators.
Users can apply the tool twice when using bands or any overlay indicator returning two outputs, using crossover targets for obtaining targets using the upper band as source and crossunder targets for targets using the lower band. We can also use the Trendlines with breaks indicator as example:
🔹 Dashboard
A dashboard is displayed on the top right of the chart, displaying the amount, reach rate of targets 1/2, and total amount.
This dashboard can be useful to evaluate the selected target distances relative to the selected conditions, with a higher reach rate suggesting the distance of the targets from the price allows them to be reached.
🔶 SETTINGS
Source: Indicator source used to create targets. Targets are created when the closing price crosses the specified source.
Show Target Labels: Display target labels on the chart.
Candle Coloring: Apply candle coloring based on the most recent active target.
🔹 Target
Crossover and Crossunder targets use the same settings below:
Show Target: Determines if the target is displayed or not.
Above Price Target: If selected, will create targets above the closing price.
Wait Until Reached: When enabled will not create a new target until an existing one is reached.
New Target When Reached: Will create a new target when an existing one is reached.
Evaluate Wicks: Will use high/low prices to determine if a target is reached. Unselecting this setting will use the closing price.
Target Distance From Price: Controls the distance of a target from the price. Can be determined in currencies/points, percentages, ATR multiples, or ticks.
Cerca negli script per "break"

Range Detector [LuxAlgo]The Range Detector indicator aims to detect and highlight intervals where prices are ranging. The extremities of the ranges are highlighted in real-time, with breakouts being indicated by the color changes of the extremities.
🔶 USAGE
Ranging prices are defined by a period of stationarity, that is where prices move within a specific range.
Detecting ranging markets is a common task performed manually by traders. Price breaking one of the extremities of a range can be indicative of a new trend, with an uptrend if price breaks the upper range extremity, and a downtrend if price breaks the lower range extremity.
Ranges are highlighted as zones and are set retrospectively, that is the starting point of a range is offset in the past. The exact moment a range is detected is highlighted by a gray background color. The average between the maximum/minimum of a zone is also highlighted as a dotted line and is also set retrospectively.
The range extremities are set in real-time, blue extremities indicate the range extremities were not broken, green extremities indicate that price broke the upper range extremity, while red extremities indicate price broke the lower range extremity.
Extremities are extended until a new range is detected, allowing past ranges extremities can be used as future support/resistances.
🔶 DETAILS
The detection algorithm used to detect ranges tests if all the prices within a user-set window are all within two extremities. These extremities are determined by the mean of the detection window plus/minus an ATR value.
When a new range is detected, the script checks if this new range overlaps with a previously detected range, if this is the case, both ranges are merged into one; updating the extremities of the previous range.
This can be observed with the real-time extremities changing within a highlighted zone.
🔶 SETTINGS
Minimum Range Length: Minimum amount of bars needed to detect a range.
Range Width: Multiplicative factor for the ATR used to detect new ranges. Lower values detect ranges with a lower width. Using higher values might return false positives.
ATR Length: ATR length used to determine the range width.

Daily Pivots with Fakeout Protection█ OVERVIEW
The "Daily Pivots with Fakeout Protection" indicator is a powerful tool designed to help traders identify potential price breakouts and pivot levels on daily charts. This indicator calculates and displays daily pivot points along with breakout lines that are adjusted to provide a certain level of protection against fakeouts, which are false price movements that can mislead traders.
█ FEATURES
• Pivot Timeframe Selection: You can choose the timeframe for the pivot calculations. The default is set to daily (D), but you have the flexibility to select other timeframes as well.
• Fakeout Protection: A percentage-based parameter allows you to define the amount of protection you want against fakeouts. This helps filter out potentially unreliable breakouts.
• Bullish and Bearish Signals: The indicator distinguishes between bullish and bearish conditions by comparing the closing price to the daily high and low.
• Breakout Signals: Triangular symbols (upward and downward) appear below and above bars to signal potential breakout points. These are based on the closing price crossing the adjusted breakout lines.
• Visual Representation: Pivot points, daily high, and daily low are plotted on the chart, with distinctive line styles and colors for easy identification.
• Background Highlighting: The background color of the chart changes when a new period begins, helping you quickly recognize the start of a new trading day.
• Color-Coded Zones: The indicator colors the background around the closing price differently based on whether the market is bullish (green) or bearish (red).
█ HOW TO USE
1 — Apply the "Daily Pivots with Fakeout Protection" indicator to your TradingView chart.
2 — Customize the parameters like pivot timeframe and fakeout protection percentage according to your trading preferences.
3 — Watch for the triangular breakout symbols that appear above and below bars, indicating potential breakout points.
4 — Keep an eye on the pivot points, daily high, and daily low lines to understand price levels relevant to the current trading day.
5 — Use the background color changes to quickly identify the beginning of a new trading day and any potential shifts in market sentiment.
Note:
• This indicator is designed for daily charts but can be adjusted to work with other timeframes as well.
• Be cautious of relying solely on breakout signals; consider using additional technical and fundamental analysis for confirmation.
Start integrating the "Daily Pivots with Fakeout Protection" indicator into your trading strategy to enhance your ability to identify breakouts and pivot levels more effectively.

Price Percentage Breakout by Time PeriodDescription:
The Price Percentage Breakout by Time Period (P%BTP) indicator is a technical analysis tool designed to identify potential breakout signals based on the percentage change in price over a specified lookback period. It helps traders identify significant price movements that exceed a user-defined threshold, indicating potential trading opportunities.
How it Works:
The P%BTP indicator calculates the percentage change between the open and close prices of each candle. It compares this percentage change to the highest percentage change observed over the specified lookback period. When the percentage change exceeds or equals this highest value, it indicates a potential breakout signal. The indicator colors the bars on the chart based on whether it's a bullish or bearish breakout.
Usage:
To effectively utilize the Price Percentage Breakout by Time Period indicator, follow these steps:
1. Apply the P%BTP indicator to your chart by adding it from the available indicators.
2. Customize the input settings to suit your preferences. You can define the lookback period, which determines the number of bars used for calculating the percentage change, as well as choose colors for bullish and bearish breakouts.
3. Observe the bars on the chart:
- Bars highlighted in the bullish color indicate potential bullish breakout signals.
- Bars highlighted in the bearish color indicate potential bearish breakout signals.
4. Interpret the breakout signals:
- A bullish breakout signal occurs when the percentage change in price exceeds or equals the highest percentage change observed over the lookback period, indicating a potential upward movement.
- A bearish breakout signal occurs when the percentage change in price exceeds or equals the highest percentage change observed over the lookback period, indicating a potential downward movement.
5. Consider additional analysis:
- Combine the breakout signals from the P%BTP indicator with other technical analysis tools, such as support and resistance levels, trend lines, or candlestick patterns, to confirm potential trade setups.
6. Implement appropriate risk management strategies, including setting stop-loss orders and position sizing, to manage your trades effectively and protect your capital.
Note: The Price Percentage Breakout by Time Period indicator provides insights into potential breakout signals based on the percentage change in price over a specified lookback period. However, it is recommended to use this indicator in conjunction with other technical analysis tools and perform thorough analysis before making trading decisions.

Price Percentage Breakout by Chosen PercentageDescription:
The Price Percentage Breakout indicator (P%B) is a technical analysis tool designed to identify potential breakout signals based on percentage changes in price. It helps traders identify significant price movements that exceed a specified threshold, indicating potential trading opportunities.
How it Works:
The Price Percentage Breakout indicator calculates the percentage change between the open and close prices of each candle. It compares this percentage change to a user-defined threshold to determine if a breakout has occurred. When the percentage change exceeds the threshold, indicating a significant price movement, the indicator highlights the breakout on the chart. Additionally alerts can be created by the user that display the percentage of the breakout.
Usage:
To effectively utilize the Price Percentage Breakout indicator, follow these steps:
1. Apply the P%B indicator to your chart by adding it from the available indicators.
2. Customize the input settings to suit your preferences. You can choose the color for highlighting the breakout and set the percentage threshold for detecting breakouts.
3. Observe the bars on the chart:
- Bars highlighted in the chosen color indicate potential breakout signals.
4. Interpret the breakout signals:
- A breakout signal occurs when the percentage change in price exceeds the specified threshold. This suggests a significant price movement.
5. Consider additional analysis:
- Combine the breakout signals from the Price Percentage Breakout indicator with other technical analysis tools, such as support and resistance levels, trend lines, or candlestick patterns, to confirm potential trade setups.
6. Implement appropriate risk management strategies, including setting stop-loss orders and position sizing, to manage your trades effectively and protect your capital.
Note: The Price Percentage Breakout indicator provides insights into potential breakout signals based on percentage changes in price. However, it is recommended to use this indicator in conjunction with other technical analysis tools and perform thorough analysis before making trading decisions.
Range BreakerStrategy Description: Range Breaker
The Range Breaker strategy is a breakout trading strategy that aims to capture profits when the price of a financial instrument moves out of a defined range. The strategy identifies swing highs and swing lows over a specified lookback period and enters long or short positions when the price breaks above the swing high or below the swing low, respectively. It also employs stop targets based on a percentage to manage risk and protect profits.
Beginner's Guide:
Understand the concepts:
a. Swing High: A swing high is a local peak in price where the price is higher than the surrounding prices.
b. Swing Low: A swing low is a local trough in price where the price is lower than the surrounding prices.
c. Lookback Period: The number of bars or periods the strategy analyzes to determine swing highs and swing lows.
d. Stop Target: A predetermined price level at which the strategy will exit the position to manage risk and protect profits.
Configure the strategy:
a. Set the initial capital, order size, commission, and pyramiding as needed for your specific trading account.
b. Choose the desired lookback period to identify the swing highs and lows.
c. Set the stop target multiplier and stop target percentage as desired to manage risk and protect profits.
Backtest the strategy:
a. Set the backtest start date to analyze the strategy's historical performance.
b. Observe the backtesting results to evaluate the strategy's effectiveness and adjust the parameters if necessary.
Implement the strategy:
a. Apply the strategy to your preferred financial instrument on the TradingView platform.
b. Monitor the strategy's performance and adjust the parameters as needed to optimize its effectiveness.
Risk management:
a. Always use a stop target to protect your trading capital and manage risk.
b. Don't risk more than a small percentage of your trading capital on a single trade.
c. Be prepared to adjust the strategy or stop trading it if the market conditions change significantly.
Adjusting the Lookback Period and Timeframes for Optimal Strategy Performance
The Range Breaker strategy uses a lookback period to identify swing highs and lows, which serve as the basis for determining entry and exit points for long and short positions. By adjusting the lookback period and analyzing different timeframes, you can potentially find the best strategy configuration for each specific asset.
Adjusting the lookback period:
The lookback period is a critical parameter that affects the sensitivity of the strategy to price movements. A shorter lookback period will make the strategy more sensitive to smaller price fluctuations, resulting in more frequent trading signals. On the other hand, a longer lookback period will make the strategy less sensitive, generating fewer signals but potentially capturing larger price movements.
To optimize the lookback period for a specific asset, you can test different lookback values and compare their performance in terms of risk-adjusted returns, win rate, and other relevant metrics. Keep in mind that using an overly short lookback period may lead to overtrading and increased transaction costs, while an overly long lookback period may cause the strategy to miss profitable trading opportunities.
Analyzing different timeframes:
Timeframes refer to the duration of each bar or candlestick on the chart. Shorter timeframes (e.g., 5-minute, 15-minute, or 30-minute) focus on intraday price movements, while longer timeframes (e.g., daily, weekly, or monthly) capture longer-term trends. The choice of timeframe affects the number of trading signals generated by the strategy and the length of time each position is held.
To find the best strategy for each asset, you can test the Range Breaker strategy on different timeframes and analyze its performance. Keep in mind that shorter timeframes may require more active monitoring and management due to the increased frequency of trading signals. Longer timeframes, on the other hand, may require more patience as positions are held for extended periods.
Finding the best strategy for each asset:
Every asset has unique price characteristics that may affect the performance of a trading strategy. To find the best strategy for each asset, you should:
a. Test various lookback periods and timeframes, observing the strategy's performance in terms of profitability, risk-adjusted returns, and win rate.
b. Consider the asset's historical price behavior, such as its volatility, liquidity, and trend-following or mean-reverting tendencies.
c. Evaluate the strategy's performance during different market conditions, such as bullish, bearish, or sideways markets, to ensure its robustness.
d. Keep in mind that each asset may require a unique set of strategy parameters for optimal performance, and there may be no one-size-fits-all solution.
By experimenting with different lookback periods and timeframes, you can fine-tune the Range Breaker strategy for each specific asset, potentially improving its overall performance and adaptability to changing market conditions. Always practice proper risk management and be prepared to make adjustments as needed.
Remember that trading strategies carry inherent risk, and past performance is not indicative of future results. Always practice proper risk management and consider your own risk tolerance before trading with real money.

Psychological levels (Bank levels) PsychoLevels v3 - TartigradiaPsychological levels (Bank levels) plots the closest "round" price levels above and below current price, based on neuroscience research of how humans intuitively calculate in logarithms.
Psychological levels, also called bank levels, are "round" price numbers, by truncating after the nth leftmost digits, around which price often experience resistance or support, because traders and investors tend to set orders around these round numbers.
The calculation done here is fully automatic and dynamic, contrary to other similar scripts, this one uses a mathematical calculation that extracts the 1, 2 or 3 leftmost digits and calculate the previous and next level by incrementing/decrementing these digits. This means it works for any symbol under any price range.
This approach is based on neuroscience research, which found that human brains intuitively approximate numbers on a logarithmic scale, adults and children alike, and similarly to macaques, for more info see Numerical Cognition , Weber-Fechner Law , Zipf law .
For example, if price is at 0.0421, the next major price level is 0.05 and medium one is 0.043. For another asset currently priced at 19354, the next and previous major price levels are 20000 and 10000 respectively, and the next/previous medium levels are 20000 and 19000, and the next/previous weak levels are 19400 and 19300.
IMPORTANT: Please enable "Scale price chart only" in the chart's scale's options, as otherwise major levels may make the chart's scale very small and hard to read.
How it works
At any time, there are 3 levels of strength (1 leftmost digit, 2 leftmost digits, 3 leftmost digits) represented by different sizes, and 3 directional levels for each of these strengths (level above, level below, and half-level) represented by different colors and positions, around current price.
Indeed, contrary to other similar price levels scripts, we do not plot ALL price levels at all times, because otherwise the chart becomes wayyy too cluttered, and also it's highly processing intensive to plot so many lines. So we here use a dynamical approach: we plot only the relevant levels, the closest ones according to current price.
Hence, when a level disappears, it does not mean that it does not exist anymore, but simply that we are not drawing it right now because it is not pertinent for the current price movement (ie, too far away).
Breakouts can be detected in two different ways depending on if SMA is set to a value higher than 1 or not: if SMA == 1, then there is no smoothing, so the levels adapt instantaneously to the current price, so to detect breakout, you should refer to the levels at the previous tick and whether they were broken by current tick's price; if SMA > 1, then there is some smoothing, and so the levels will stay in-place even if there is a breakout, so it's easier to spot breakouts without having to look at the previous ticks, but on the other hand you won't see the new levels for the new price range until after a few more ticks for the smoothing window to adapt. Hence, by default, smoothing is disabled, so that you can see the currently pertinent levels at all time, even right after or during a breakout.
By default, the strong above level is in green, strong below level is in red, medium above level is in blue, medium below level is in yellow, and weak levels aren't displayed but can be. Half levels are also displayed, in a darker color. Strong levels are increments of the first leftmost digit (eg, 10000 to 20000), medium levels are increments of the second leftmost digit (eg, 19000 to 20000), and weak levels of the third leftmost digit (eg, 19100 to 19200). Instead of plotting all the psychological levels all at once as a grid, which makes the chart unintelligible, here the levels adapt dynamically around the current price, so that they show the above/below/half levels relatively to the current price.
Indeed, "half-levels" are also displayed (eg, medium level can also display 19500 instead of only 19000 or 20000). This was made because otherwise the gap between two levels was too big, especially for the strongest levels (eg, there was no major level between 20000 and 30000, but with a half-step we also get a half-level at 25000, and empirically price tends to respect these half levels - I also tried quarter levels but empirically the results were not good). In addition to this hard-coded half-level, you can also create more subdivisions (eg, quarter levels) by setting the simple moving average to a value higher than 1.
The script can be made to run on the daily timeframe whatever the current chart's timeframe is, to reduce the variability in levels, to make it less noisy than intraday price movement. But by default, the chart resolution is used, because I empirically found that the levels found with this indicator work on all time resolutions quite well.
The step can be adjusted to increase the gap between levels, eg, if you want to display one every 2 levels then input step = 2 (eg, 22000, 24000, 26000, etc), or if you want to display quarter levels, input 0.25 (eg, 22000, 22250, 22500, etc). The default values should fit most use cases and cover most psychological levels.
How to read
Focust first on bigger dotted levels, they are stronger and more likely to cause a rebound or a major event or price to stay at this level.
Remember that it's not enough to just look at levels, the context is important, because levels have various effects depending on current price movement: if price is above a level, the level is a support on which price can rebound; if price is below a level, the level is a resistance on which price can rebound (or break); and finally sometimes price also stays hovering around a level for some time.
Levels closer to 9 are less weaker, and levels closer to 0 are stronger, according to Zipf law. This is now reflected since v3 in the transparency, levels that are closer to 9 will be more transparent.
The switch in color for the same level illustrates how a level switches from being a support to a resistance and inversely. Eg, if a major level turns from green to red, then it changed from being a resistance (above) to a support (below).
As is well known in trading, longer standing levels are stronger. This indicator provides a direct illustration: in practice, the number of consecutive dots on the same line influences the strength of the level: the longer the chain of dots, the more you can expect this price level to be significant. The length does not mean the level will necessarily hold, but that other traders are likely to monitor if it holds, and if not then price will break down. Hence, longer levels are good spots to place stop losses, or to enter trades depending on your strategy. In general, a single dot is not enough to consider a level significant, but 2 or more is a good enough level, and 10+ is a strong level. Intuitively, this makes sense, and is what pro traders do: the longer a level is tested, the stronger it is. This indicator can visually represent this intuition and allows to use it as a more systematic trading signal.
Motivation
I initially made the first version of the PsychoLevels indicator mainly to train with PineScript, but I found it surprisingly accurate to define levels that are respected by price movements. So I guess it can be useful for new traders and experienced traders alike, as it's easy to forget that psychological levels can often be as strong if not stronger than technical levels. It can also be used to quickly screen other minor assets for trading opportunities. For example, a hybrid strategy would be to manually define levels on BTCUSD but using this script to automatically define levels in crypto altcoins and quickly screen them for a trade opportunity that can be greater than with BTCUSD but with the same trend.
Personally, although initially I did not believe an automated tool would work well for this purpose, I could now empirically verify that it is quite reliable for the purpose of detecting levels, and so I use it all the time to find the levels automatically and help me monitor them like a hawk, so that I only have to draw uber major levels, the ones that last between cycles and that are hard to autodetect, but otherwise all daily/weekly levels are usually covered. However, trendlines must still be drawn manually or with another indicator (but note that up to now I have found none that worked well enough), as PsychoLevels only draws levels (ie, horizontal lines, not oblique ones!).
Differences with the previous version PsychoLevels v2
price levels now have a transparency according to their importance for the human brain: numbers closer to 9 are weaker, and numbers closer to 0 are stronger and represent a major psychological threshold (eg, that's why prices marked as $9.99 sell better than $10.00). This option can be disabled to get the exact same behavior as v2.
modularized and typed code
PsychoLevels v2 can be found here:

Opening Range & Daily and Weekly PivotsThis script is for a combination of two indicators: an Opening Range Breakout (ORB) indicator and a daily/weekly high/low pivot indicator. The ORB indicator displays the opening range (the high and low of the first X minutes of the trading day, where X is a user-defined parameter) as two lines on the chart. If the price closes above the ORB high, the script triggers an alert with the message "Price has broken above the opening range." Similarly, if the price closes below the ORB low, the script triggers an alert with the message "Price has broken below the opening range."
The daily/weekly high/low pivot indicator plots the previous day's high and low as well as the previous week's high and low. If the current price closes above yesterday's high or last week's high, the script triggers an alert with the messages "We are now trading higher than the previous daily high" and "We are now trading higher than the last week high", respectively. If the current price closes below yesterday's low or last week's low, the script triggers an alert with the messages "We are now trading lower than the previous daily low" and "We are now trading lower than the last week low", respectively.
In addition to the visual representation on the chart, the script also triggers alerts when the price crosses any of these levels. These alerts are intended to help traders make decisions about entering or exiting trades based on the price action relative to key levels of support and resistance.

Sup/Res Levels [QuantVue]Shows basic pivot point of support and resistance levels. Will show alerts for break of sup. or res. Allows for a volume filter for sup. res. breaks as well.
"B" means break of either a Sup. or Res. level with volume greater than the threshold.
"Bull/Bear Wick" means bullish/bearish candle on break.
Left - number of bars left hand side of the pivot .
Right - number of bars right hand side of the pivot .
Volume Thres. - the threshold value (%) for the Volume.
This indicator is useful to filter our insignificant breaks of sup. or res. Can help trader determine when to sit on their hands, or enter a trade.

Strategy: Range BreakoutWhat?
In the price action, levels have a significant role to play. Based on the price moving above/below the levels - the underlying instrument shows some price-action in the direction of breakout/breakdown.
There are plenty of ways level can be determined. Levels are the decision point to take a trade or not. But if we make the level derivation complex, then the execution may get hamper.
This strategy script, developed in PineScript v5, is our attempt at solving this problem at the core by providing this simple, yet elegant solution to this problem.
It's essentially an attempt to Trade Simple by drawing logical (horizontal) lines in the chart and take actions, after multiple associated parameters confirmation, on the breakout / breakdown of the levels.
How?
Let us explain how we are drawing the levels.
We are depending on some of the parameters as described below:
Open Range : During intraday movement, often if prices move beyond a particular level, it exibits more movement in the same swing in same direction. We found out, through our back testing for Indian Indices like NSE:NIFTY , NSE:BANKNIFTY or NSE:CNXFINANCE the first 15m (i.e 09:15 AM to 09:30 AM, IST) is one of such range. For Indian stocks, it is 9:15 to 9:45. And for MCX MCX:CRUDEOIL1! it's 5:00 pm to 6:00 pm. There are our first levels.
PDHCL : Previous Day High, Close, Low. This is our next level
VWAP : The rolling VWAP (volume weighted average price)
In the breakout/breakdown of the Open Range and Previous Day High/Low, we are taking the trade decisions as follows using CEST principle:
C onditions :
If current bar's (say you are in 5m timeframe) closing is broken out the Open Range High or Previous Day High, taken a Buy/Long decision (let's say buying a Call Option CE or selling a Put Option PE or buying the future or cash).
If current bar's (say you are in 5m timeframe) closing is broken down the Open Range Low or Previous Day Low, taken a Sell/Short decision (let's say buying a Put Option CE or selling a Call Option PE or selling the future or cash).
Additionally, and optionally (default ON, one can turn off): we are checking various other associated multiple confirmations as follows:
1. Momentum : Checking 14-period RSI value is more than 50 or less than 50 (all parameters like period, OB, OS ranges are configurable through settings)
2. Current bar's volume is more than the last 20 bars volume average. How much more - that multiplier is also configurable. (default is 1)
3. The breakout candle is bullish (green) or bearish (red).
E ntry :
All of these happens only on the closing of the candle . Means: Non Repainting! .
Clearly in the chart we are showing as green up arrow BO (breakout for buy) and red down arrow BD (breakdown for sell) to take your decision process smooth.
So, on the closing of the decision BO/BD candle we are entering the trade (with a thumping heart and nail biting ...)
S top Loss :
We are relying on the time tasted (last 40 years) mechanism of Average True Range (ATR) of default 14 period. This default period is also configurable.
So for Long trades: the 14 period ATR low band is the SL.
For Short trades: the 14 period ATR high band is the SL.
T arget :
We are depending on the thump rule of 1:2 Risk Reward. It's simple and effective. No fancy thing. We are closing the trade on double the favorable price movement compared to the SL placed. Of course, this RR ratio is confiurable from the settings, as usual.
What's Unqiue in it?
The utter simplicity of this trading mechanism. No fancy things like complex chart pattern, OI data, multiple candlestick patterns, Order flow analysis etc.
Simple level determination,
Marking clearly in the chart.
Making each parameter configurable in Settings and showing tooltip adjacent to the parameter to make you understand it better for your customization,
Wait for the candle close, thus eliminating the chances of repainting menace (as much as possible)
Additional momentum and volume check to trade entry confirmation.
Works with normal candlestick (nothing special ones like HA ...)
Showing everything as a Summary Table (which, again can be turned off optionally) overlaying at the bottom-right corner of the chart,
Optionally the Summary Table can be configured to alert you back (say you get it notified in your email or SMS).
That way, a single, simple, effective trade setup will ease your journey as smooth sail as possible.
Mentions
There are plenty of friends from whom time to time we borrowed some of the ideas while working closely together over last one year.
From tradingview community, we took the spirit of @zzzcrypto123 awesome work done long back (in 2020) as the indicator "ORB - Opening Range Breakout". (We tried to reach him for his explicit consent, unable to catch hold of him).
Some other publicly available materials we have consulted to get the additional checks (like RSI, volume).
Lat word
Use it please and thank you for your constant patronage in following us in this awesome platform. Let's keep growing together.
Disclaimer :
This piece of software does not come up with any warrantee or any rights of not changing it over the future course of time.
We are not responsible for any trading/investment decision you are taking out of the outcome of this indicator.

Market Breadth: Trends & BreakoutsVisualize the percentage of stocks in an index participating in trends and breakouts/breakdowns.
The default data source is the S & P 500: the percent of stocks above/below the 200 and 50 day moving averages, and the percentage of stocks making new 52 week breakouts/breakdowns. You can pick new data sources in the settings.
The blue band represents the percentage of stocks above/below the 200 day moving average. (It's always 100% in width, unlike say Bollinger bands). The thin blue lines are the same but for the 50 day moving average. The red and green areas represent the percentage of stocks making new 52 week highs/lows.
In the example chart you can see a divergence between the market as a whole which continues up and to the right throughout 2021, where as fewer and fewer stocks were above their own 200 day moving average, causing the blue band to trend down. Before the market turns beginning 2022 you can see more stocks making new 52 week lows, even as other stocks make 52 week highs. After the market tops, the percentage of 52 week lows intensifies and the percentage of stocks below their 200 day moving average is already over 50%.

SBS AlgoHello traders, I am here again with a new and improved indicator.
This indicator is based on a pivot breakout algorithm which gives buy and sell signals according to the breakout of trendline. This is an advanced version of another script. It also takes price action into consideration along with some basic indicators like MACD and ADX to give good entry signals.
NOTE: This indicator is not designed to take entries completely based on signals it gives. Please use it along with your trading strategy to add more confluence to your trading system and maximize your profits.
I hope you guys will like this one too .Enjoy 👍
In case you find any bug, please do report in comment section .Thank you.

Rob Booker - ADX Breakout updated to pinescript V5Rob Booker - ADX Breakout. The strategy remains unchanged but the code has been updated to pinescript V5. This enables compatibility with all new Tradingview features. Additonally, indicators have been made more easily visible, default cash settings as well as input descriptions have been added.
Rob Booker - ADX Breakout: (Directly taken from the official Tradingview V1 version of the script)
Definition
Rob Booker’s Average Directional Index (ADX) Breakout is a trend strength indicator that affirms the belief that trading in the direction of a trend and continuing to follow its pull is more profitable for traders, while simultaneously reducing risk.
History
ADX was traditionally used and developed to determine a price’s trend strength. It is commonly known as a tool from the arsenal of Rob Booker, experienced entrepreneur and currency trader.
Calculations
Calculations for the ADX Breakout indicator are based on a moving average of price range expansion over a specific period of time. By default, the setting rests at 14 bars, this however is not mandatory, as other periods are routinely used for analysis as well.
Takeaways
The ADX line is used to measure and determine the strength of a trend, and so the direction of this line and its interpretation are crucial in a trader’s analysis. As the ADX line rises, a trend increases in strength and price moves in the trend’s direction. Similarly, if the ADX line is falling, a trend decreases in strength and price then enters a period of consolidation, or retracement.
Traditionally, the ADX is plotted on the chart as a single line that consists of values that range from 0-100. The line is non-directional, meaning that it always measures trend strength regardless of the position of a price’s trend (up or down). Essentially, ADX quantifies trend strength by presenting in both uptrends and downtrends of the line.
What to look for
The values associated with the ADX line help traders determine the most profitable trades and where risk lies in the current trend. It is important to know how to quantify trend strength and distinguish between the varying values in order to understand the differences in trending vs. non-trending conditions. Let’s take a look at ADX values and what they mean for trend strength.
ADX Value:
0-25: Signifies an absent of weak trend
25-50: Signifies a strong trend
50-75: Signifies a very strong trend
75-100: Signifies an extremely strong trend
To delve into this a bit further, let’s assess the meaning of ADX if it is valued below 25. If the ADX line remains below 25 for more than 30 or so bars, price then enters range conditions, making price patterns more distinguishable and visible to traders. Price will move up and down between resistance and support in order to determine selling and buying interest and may then eventually break out into a trend or pattern.
The way in which ADX peaks, ebs, and flows is also a signifier of its overall pattern and trend momentum. The line can clearly indicate to the trader when trend strength is strong versus when it is weak. When ADX peaks are pictured as higher, it points towards an increase in trend momentum. If ADX peaks are pictured as lower - you guessed it - it points towards a decrease in trend momentum. A trend of lower ADX peaks could be a warning for traders to watch prices and manage and assess risk before a trade gets out of hand. Similarly, whenever there is a sudden move that seems out of place or a change in trend character that goes against what you’ve seen before, this should be a clear sign to watch prices and assess risk.
Summary
The ADX Breakout indicator is a trend strength indicator that analyzes price movements relative to trend strength to signal a user when is best for a trade and when is best to manage risk and assess patterns. As long as a trader recognizes strong trends and assesses the risk of each trade properly, they should have no problem using this indicator and utilizing it to work in their favor. In addition, the ADX helps identify trending conditions, but while doing so, also aids traders in finding strong trends to trade. The indicator can even alert traders to specific changes in trend momentum, allowing them to be primed for risk management.

Support/Resistance With Breaks & Bounces [MyTradingCoder]This script uses the built-in pivothigh/pivotlow functions to find and identify new levels of basic support and resistance. The script will also automatically identify the first occurrence of a bounce/rejection off the most recent green/red line as well as automatically identify the first occurrence of a breakout of the most recent green/red line. This is a very basic, but effective indicator that is well written, and open source for anyone to learn from or build off of.
All details needed to understand how to use the script are listed below. Enjoy!
Customizable inputs:
- Option to change how pivot points are calculated('candle body' or 'candle wicks')
- Option to change the sensitivity of the pivots(leftbars and rightbars linked)
- Option to change the line width
Available Alert Options:
- Red Line Breakout
- Red Line Bounce/Rejection
- Green Line Breakout
- Green Line Bounce/Rejection
User Manual:
- All calculations are done on the last update of the bar(candle close)
- Only 1 breakout will be allowed per line
- Only 1 rejection will be allowed per line
- If the text is red, then the signal is related to the 'red line', if the text is green, then the signal is related to the 'green line'
- The code is open source, and is programmed using arrays/loops out of the gate, despite not needing to do so. This allows for easy modifications to the scripts behavior while keeping the functionality without it breaking.
- Pivot Rightbars is hardcoded to the same value for leftbars(leftbars = sensitivity). Uncomment the input for right_bars if you want the ability to change the rightbars independently from the leftbars
- When a new line is identified, the old one will stop updating, and no longer be considered for breakout/rejections. This can be changed with a bit of pine knowledge by performing some slight modifications to the code.
- When a new line is drawn, the old line will move backwards a little bit for cleanliness/clarity purposes
- If you have any questions/comments/requests/concerns please leave them down in the comments below
- Don't forget to leave a like if you find this script useful

MM Chop Filter Range BoxesMatch with the MM Chop Filter
This draw Non repainting range boxes when the oscillator see a range.
-Breakout Buy/Sell Signals and Exit signals when prices enters a range just in case you did get into a trade. .
-Alarms to match the signals
How to use
Match with the oscillator and always trade the trend with your strategy confirmation and the breakout this indicator provides

Bjorgum Key Levels
Key Levels Aims to capture 3 of the most significant points in price action
Breakouts
False Breakouts (Traps)
Back Checks
These 3 points alone, if properly identified, can be some of the most significant points of movement in the price history of an asset and bring significant gains to traders, if capitalized on. Here are a few examples of these setups
Breakouts
Breakouts can bring significant rallies as the market swings one sided after key levels are breached. This entry type can bring large trending runs to follow. Momentum is on your side, but the trade off is a higher entry.
False Breakouts
Also known as a bull trap or a bear trap, false breaks can lead to swift and significant reversals and potential for a large and sudden move to the opposite side. When a key level breakout fails to hold, parties entering to capitalize on the "epic breakout" can get left holding the bag forcing them to exit at a loss, which can double the force of pressure. Traps can bring swift gains from good entry prices. However, price is still in a larger trend against you so momentum is weak, so price action is susceptible to roll over.
Backchecks
Back checks are pull backs in trend that find middle ground to the 2 areas already described. Both momentum and entry price are decent, but risk is defined as a key level has flipped offering entry with stops below demand, or above supply.
Combining these 3 methods helps to diversify risk, understand trend development, and bring steady gains. This script helps to identify these points to traders with analysis of key levels, price structure, and trend direction, while providing visual signals and alerts for when they occur.
Best of luck in your coding and trading and thank you for your support

Newton theory (Bollinger Band Breakout)Initial capital 1000 USD
Order size 10%
Commission 0.3% with slippage
Timeframe 4h
This is Simple Bollinger Band Trend find out strategy.
I'm using the usual trailing offset as an exit for this strategy.
using 1x leverage to go long short within 3years backtest result more then 200% for all usd pair.
in next version i will try to find out more optimize sma,std,sl,tp parameter by using freqtrade hyperparameter optimization.
Happy Trading :)

Line breakI decided to help TradingView programmers and wrote code that converts a standard candles / bars to a line break chart. The built-in linebreak() and security() functions for constructing a Linear Break chart are bad, the chart is not built correctly, and does not correspond to the Line Breakout chart built into TradingView. I’m talking about simulating the Linear Break lines using the plotcandle() annotation, because these are the same candles without shadows. When you try to use the market simulator, when the gaps are turned on in the security() function, nothing is added to the chart, and when turned off, a completely different line break chart is drawn. Do not try to write strategies based on the built-in linebreak() function! The developers write in the manual: "Please note that you cannot plot Line Break boxes from Pine script exactly as they look. You can only get a series of numbers similar to OHLC values for Line Break charts and use them in your algorithms." However, it is possible to build a “Linear Breakthrough” chart exactly like the “Linear Breakthrough" chart built into TradingView. Personally, I had enough Pine Script functionality.
For a complete understanding of how such a graph is built, you can refer to Steve Nison's book “BEYOND JAPANESE CANDLES” and see the instructions for creating a “Three-Line Breakthrough” chart (the number of lines for a breakthrough is three):
Rule 1: if today's price is above the base price (closing the first candle), draw a white line from the base price to the new maximum price (before closing).
or Rule 2: if today's price is below the base price, draw a black line from the base price to the new low of prices (before closing).
Rule 3: if today's price is no different from the base, do not draw any line.
Rule 4: if today's price rises above the maximum of the first line, shift to the column to the right and draw a new white line from the previous maximum to the new maximum of prices.
Rule 5: if the price is below the low of the first line, move one column to the right and draw a new black line down from the previous low to the new low of prices.
Rule 6: if the price is kept in the range of the first line, nothing is applied to the chart.
Rule 7: if the market reaches a new maximum, surpassing the maximum of previous lines, move to the column to the right and draw a new white line up to a new maximum.
Rule 8: if today's price is below the low of previous lines (i.e. there is a new low), move to the right column and draw a new black line down to a new low.
Rule 9: if the price is in the range of the first two lines, nothing is applied to the chart.
Rule 10: if there is a series of three white lines, a new white line is drawn when a new maximum is reached (even if it is only one tick higher than the old one). Under the same conditions, for drawing a black reversal line, the price should fall below the minimum of the series of the last three white lines. Such a black line is called a black reversal line. It runs from the base of the highest white line to a new low of price.
Rule 11: if there is a series of three black lines, a new black line is drawn when a new minimum is reached. Under the same conditions, for drawing a white line, called a white reversal line, the price must exceed the maximum of the previous three black lines. This line is drawn from the top of the lowest black line to a new high of the price.
So, the script was not small, but the idea is extremely simple: if you need to break n lines to build a line, then among these n lines (or less, if this is the beginning of the chart), the maximum or minimum of closures and openings will be searched. If the current candles closed above or below these highs or lows, then a new line is added to the chart on the current candles (trend or breakout). According to my observations, this script draws a chart that is completely identical to the Line Breakout chart built into TradingView, but of course with gaps, as there is time in the candles / bar chart. I stuffed all the logic into a wrapper in the form of the get_linebreak() function, which returns a tuple of OHLC values. And these series with the help of the plotcandle() annotation can be converted to the "Linear Breakthrough" chart. I also want to note that with a large number of candles on the chart, outrages about the buffer size uncertainty are heard from the TradingView black box. Because of this, in the annotation study() set the value to the max_bars_back parameter.
In general, use it (for example, to write strategies)!
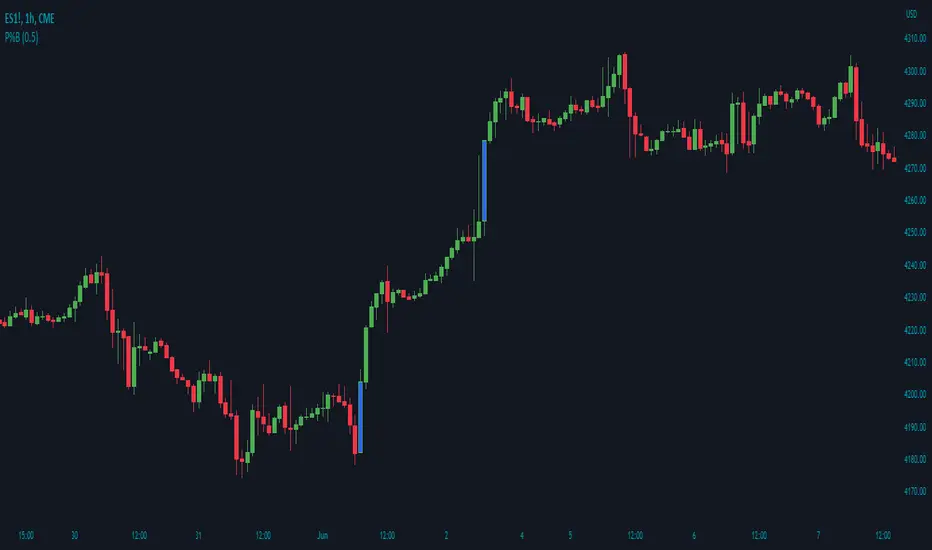
CME Equity Futures Price Limits
Breakers for CME's futures contracts. Should work on CST/EST/UTC charts.
CME says it uses the last 30 seconds of the session to grab a reference price, so I took the open of the last session's candle because it's easier.
Out of session breakers: +/-5%
Limit downs: -7%/-13%/-20%
There are some minor nuances for the later part of the NY session but I don't really care to add that in right now.
Options:
- Input a manual reference price to override the selected price for accuracy.
- Show only the current/last session's limits. This breaks the in session limit down lines.
Live prices:
www.cmegroup.com
Month codes:
www.cmegroup.com
Reference:
www.cmegroup.com
It's best to check the last updated reference price to ensure it's correct.

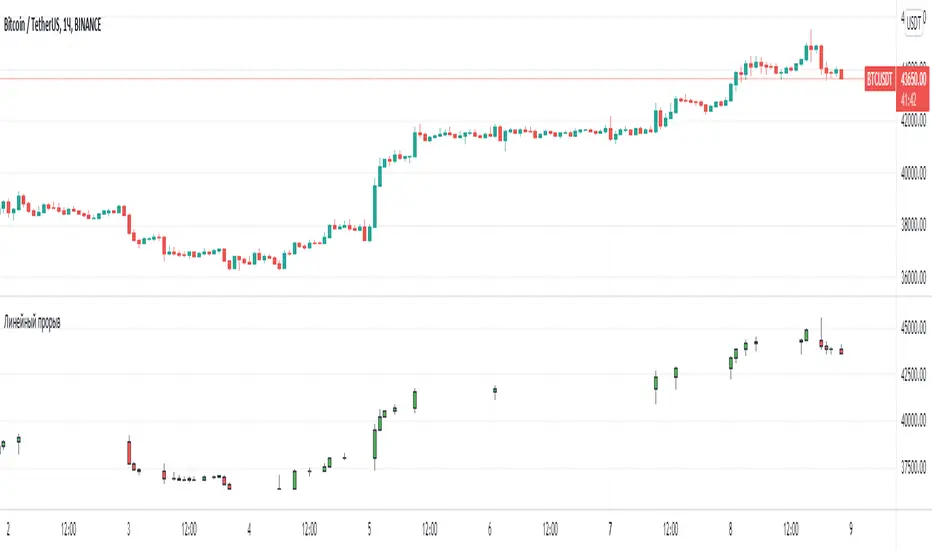
Volume w/ Threshold and Editable MA PeriodJust a simple script that tweaks the original Volume one.
The purpose is creating a threshold which we'll use to put an alert on. This way, we can be notified whether Volume pumps.
Useful for spotting breakouts, breakdowns and pumps.
Threshold is simply a coeff * ma(volume,period). Coeff is editable as well.
Hope this helps!

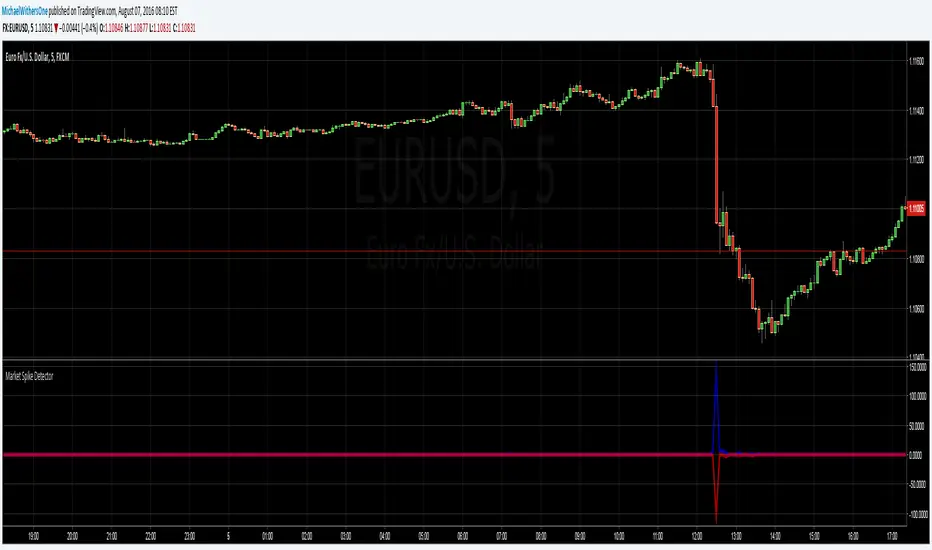
Seismic Market Spike Detector v1.0 Seismic Market Spike Detector v1.0
This indicator helps identify spikes in market activity , typified by bars with extreme open / close or high / low prices.
This indicator plots 2 lines. The Blue line simply depicts extreme price movements with in that bar regardless of the initial opening price of the closing price of the bar. This allows you to get an insight into the current volatility of the price at that time in the market. Quite often big price swings with in bars are missed as people pend to tunnel vision on the open or close price - or other indicators derived from open / close.
The Red line is similar to the blue bar as it depicts extreme price movements with in the bar , but it will show the direction the market moved in by the close of the bar - and relatively how much the market moved. This is helpful for spotting breakout price action or short term spikes. Quite often after a breakout the market will restore itself to an equilibrium in the opposite direction. Sometimes this happens with an opposing aggressive spike , some times it makes a steady return to a known price level. Either way its a great time to place entry orders if you are looking to turn a fast profit or alternatively a good warning of forth coming price volatility.
Here are some tips for analysing the red and blue lines :
1)If the red line is pointing upwards , this indicates a sharp rise in the price.
2)If the red line is pointing downwards , this indicates a sharp fall in the price.
3)If the red line is flat but the blue line is spiked in either direction - this indicates the price was volatile with in the bar , but the price closed relatively near to the surrounding price bars. Perhaps a limit / stop triggered by this kind of activity - this is an easy way to determine why and re-enter.
4)If the red and the blue lines are flat - the price is steadily moving with a trend or trading sideways in a confined range.
Smart S&D v1.0 [Breaker Blocks]Automatically marks off supply and demand zones based on previous and consequent candles.
Previous and consequent candles can be changed.
Recommend 5:3 for 15m, or 7:5 for 10m
ATR default 1
Volume confirmation off by default but there as an option
The number on bars is the number of times price has bounced off the zone. After 3 bounces (this can be changed/personalized in settings) the zone is exhausted and removed.
If price breaks through a zone, it becomes a breaker zone, flipping supply to demand, or demand to supply. Ideal for a break and retest setup.

Volume Edge Pro[wjdtks255]Volume Edge Pro: Indicator Description
Volume Edge Pro is an advanced volume analysis tool designed to identify institutional accumulation and significant supply levels. Unlike standard volume bars, this indicator categorizes trading volume into four distinct types based on price action and historical comparisons, helping traders spot high-probability breakout opportunities.
Key Components:
Blue Bars (PPV - Pocket Pivot Volume): Indicates institutional accumulation. It appears when up-day volume exceeds the highest down-day volume of the last 10 trading sessions.
Green Bars (RGV - Recent Green Volume): Represents strong buying pressure where up-day volume is higher than the 50-period moving average.
Red Bars (RRV - Recent Red Volume): Signifies heavy supply or selling pressure where down-day volume is higher than the 50-period moving average.
Grey Bars: Represents standard market volume without significant institutional involvement.
Trading Strategy (How to Trade)
1. Identifying Accumulation (The Base)
Look for multiple Blue Bars (PPV) during a consolidation phase or within a "base." This suggests that "Smart Money" is quietly accumulating shares without significantly driving up the price yet.
2. The Buy Signal
The ideal entry point is when the price breaks out of a consolidation resistance level, especially when the breakout is confirmed by a Blue (PPV) or Green (RGV) bar. The presence of PPV signals within the base increases the reliability of the breakout.
3. Overcoming Supply (The RRV Rule)
When a Red Bar (RRV) appears, it marks a level of "unconsumed supply."
Treat the high of the RRV candle as a resistance level.
A bullish reversal or continuation is confirmed only when the price reclaims the high of the RRV day or when subsequent PPVs/RGVs overwhelm the previous selling volume.
4. Risk Management
If a massive Red Bar (RRV) appears after a long uptrend and the price breaks below the prior support, it may indicate institutional distribution (selling), signaling a time to exit or tighten stop-losses.
