TrendCylinder (Expo)█ Overview
The TrendCylinder is a dynamic trading indicator designed to capture trends and volatility in an asset's price. It provides a visualization of the current trend direction and upper and lower bands that adapt to volatility changes. By using this indicator, traders can identify potential breakouts or support and resistance levels. While also gauging the volatility to generate trading ranges. The indicator is a comprehensive tool for traders navigating various market conditions by providing a sophisticated blend of trend-following and volatility-based metrics.
█ How It Works
Trend Line: The trend line is constructed using the closing prices with the influence of volatility metrics. The trend line reacts to sudden price changes based on the trend factor and step settings.
Upper & Lower Bands: These bands are not static; they are dynamically adjusted with the calculated standard deviation and Average True Range (ATR) metrics to offer a more flexible, real-world representation of potential price movements, offering an idea of the market's likely trading range.
█ How to Use
Identifying Trends
The trend line can be used to identify the current market trend. If the price is above the trend line, it indicates a bullish trend. Conversely, if the price is below the trend line, it indicates a bearish trend.
Dynamic Support and Resistance
The upper and lower bands (including the trend line) dynamically change with market volatility, acting as moving targets of support and resistance. This helps set up stop-loss or take-profit levels with a higher degree of accuracy.
Breakout vs. Reversion Strategies
Price movements beyond the bands could signify strong trends, making it ideal for breakout strategies.
Fakeouts
If the price touches one of the bands and reverses direction, it could be a fakeout. Traders may choose to trade against the breakout in such scenarios.
█ Settings
Volatility Period: Defines the look-back period for calculating volatility. Higher values adapt the bands more slowly, whereas lower values adapt them more quickly.
Trend Factor: Adjusts the sensitivity of the trend line. Higher values produce a smoother line, while lower values make it more reactive to price changes.
Trend Step: Controls the pace at which the trend line adjusts to sudden price movements. Higher values lead to a slower adjustment and a smoother line, while lower values result in quicker adjustments.
-----------------
Disclaimer
The information contained in my Scripts/Indicators/Ideas/Algos/Systems does not constitute financial advice or a solicitation to buy or sell any securities of any type. I will not accept liability for any loss or damage, including without limitation any loss of profit, which may arise directly or indirectly from the use of or reliance on such information.
All investments involve risk, and the past performance of a security, industry, sector, market, financial product, trading strategy, backtest, or individual's trading does not guarantee future results or returns. Investors are fully responsible for any investment decisions they make. Such decisions should be based solely on an evaluation of their financial circumstances, investment objectives, risk tolerance, and liquidity needs.
My Scripts/Indicators/Ideas/Algos/Systems are only for educational purposes!
Cerca negli script per "break"

PDHL levels with INTRADAY Auto FIBThe present script includes Previous day High/low levels and once the PDH or PDL breaks the present bar's background changes color according to the direction of price breakout.
It's helpful when working on lower timeframe charts with small screen space, so that the user can know that the PDHL has been taken out in one glance at the chart instead of scrolling all around to find out whether the PDH or PDL are broken or not.
The high and low of day before yesterday are also plotted for reference.
The intraday fib levels get drawn taking present day's high and low into account, useful to mark support/retest levels.
The color of the intraday AUTO FIB high and low lines also change from gray to respective assigned colors once the present day price crosses PDH or PDL this is helpful while viewing charts on mobile app.
Disclaimer: Only for studying price movement ideas, trading is not advised.

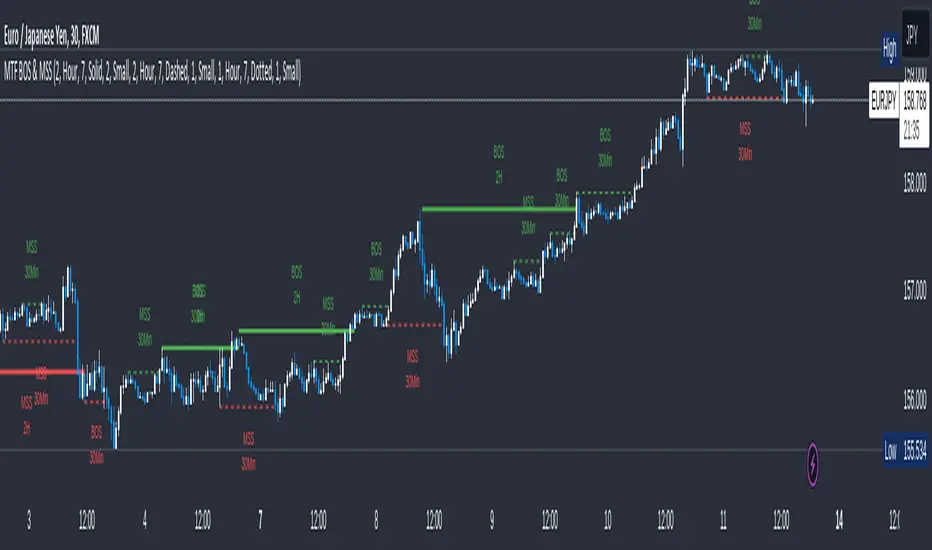
MTF Break of Structure(BOS) & Market Structure Shift(MSS)Brief Introduction
Hello fellow traders and coders, let me introduce to you the ultimate multi time-frame market structure indicator to cater to all your market structure needs. The script is extremely customizable with a maximum of 3 time-frames since I love top down analysis as I’m sure you do to, so without wasting any more time here are the available features.
List of Features
A maximum of 3 time-frames that can all be customized independently.
The ability to change individual swing lengths that create the market structure plots, all time-frames will come set at 7, you can however set this to whatever you are comfortable with.
BOS (Break of Structure) and MSS (Market Structure Shift) functionality fo all the individual time-frames.
The option to show market structure in the form of HH (Higher highs), HL (Higher Lows), LL (Lower Lows) and LH(Lower Highs).
The ability to either use (highs and lows) or closes for breaks of structure and market structure shifts, meaning a break of structure will only be valid if either a high or close (depending on your chosen input) crosses above the previous high for a bullish structural break.
The ability to change lines types for BOS and MSS.
The ability to change text sizes for the all the plots.
The ability to change the colors for nearly anything on the chart independently of any other line or plot.
The ability to change any time-frame to the chart’s time-frame.
The ability to prevent lower time frame structure from showing on higher time frames which I don’t advice as it will provide you with an inaccurate perception of the lower time frame structure hence I’ve made the feature available but set it to false.
The script also has a section called general settings that will allow you to hide all the market structure plots as well as all the lines on the chart and on all time-frames using just one input.
General Settings Functionality.
Input 1 if true will hide all market structure if true
Input 2 if true will hide all structural breaks (BOS and MSS)
Input 3 if false will show lower time frame structure on a higher time frame. High advice using it while its true as I work on this feature as it provide an innacurate depiction of structure.
Trend Channels With Liquidity Breaks [ChartPrime]Trend Channels
This simple trading indicator is designed to quickly identify and visualize support and resistance channels in any market. The primary purpose of the Trend Channels with Liquidity Breaks indicator is to recognize and visualize the dominant trend in a more intuitive and user-friendly manner.
Main Features
Automatically identifies and plots channels based on pivot highs and lows
Option to extend the channel lines
Display breaks of the channels where liquidity is deemed high
Inclusion of volume data within the channel bands (optional)
Market-friendly and customizable colors and settings for easy visual identification
Settings
Length: Adjust the length and lookback of the channels
Show Last Channel: Only shows the last channel
Volume BG: Shade the zones according to the volume detected
How to Interpret
Trend Channels with Liquidity Breaks indicator uses a combination of pivot highs and pivot lows to create support and resistance zones, helping traders to identify potential breakouts, reversals or continuations of a trend.
These support and resistance zones are visualized as upper and lower channel lines, with a dashed center line representing the midpoint of the channel. The indicator also allows you to see the volume data within the channel bands if you choose to enable this functionality. High volume zones can potentially signal strong buying or selling pressure, which may lead to potential breakouts or trend confirmations.
To make the channels more market-friendly and visually appealing, Trend Channels indicator also offers customizable colors for upper and lower lines, as well as the possibility to extend the line lengths for further analysis.
The indicator displays breaks of key levels in the market with higher volume.

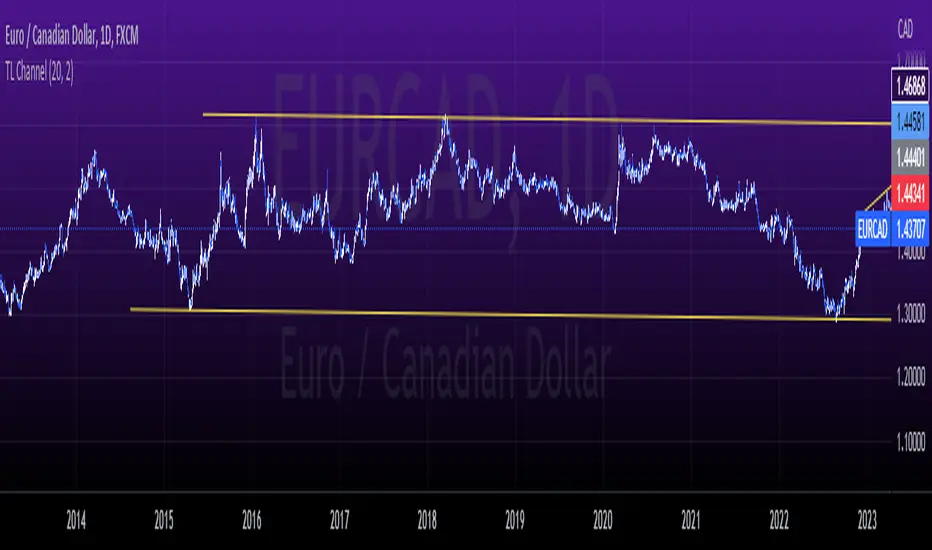
tlc with False BreakoutThe strategy aims to identify a trend line channel with the potential for a false breakout. Here's an explanation of the strategy:
The script starts by defining the input parameters. The lookback parameter determines the number of previous bars to consider for detecting the trend lines, and the threshold parameter controls the sensitivity of the trend line detection.
The script then initializes variables to store the trend lines, tap count, and the false breakout signal.
Inside the loop, the script iterates over the specified number of bars (lookback) to identify the trend lines. It checks if the current high is greater than the previous and next highs to identify an upper trend line and sets it using the line.new function. Similarly, it checks if the current low is smaller than the previous and next lows to identify a lower trend line and sets it.
The script also keeps track of the price levels of the upper and lower trend lines using the variables upperTrendLinePrice and lowerTrendLinePrice. These price levels are obtained using the line.get_y1 function.
After the fourth tap (when tapCount is equal to 4), the script checks if the current close price is above the upper trend line or below the lower trend line. If this condition is met, it sets the falseBreakout variable to true, indicating a potential false breakout.
Finally, the script plots a shape marker (plotshape) when a false breakout occurs. This is represented by an orange label displayed below the bar.
At the end of the script, the line.delete function is used to remove the old trend lines when the script reaches the last bar (barstate.islast).
By using this strategy, you can visually identify trend line channels where the upper and lower lines touch higher highs or lower highs and higher lows or lower lows. Additionally, it provides a false breakout signal when the price breaks above the upper trend line or below the lower trend line on the fifth tap.
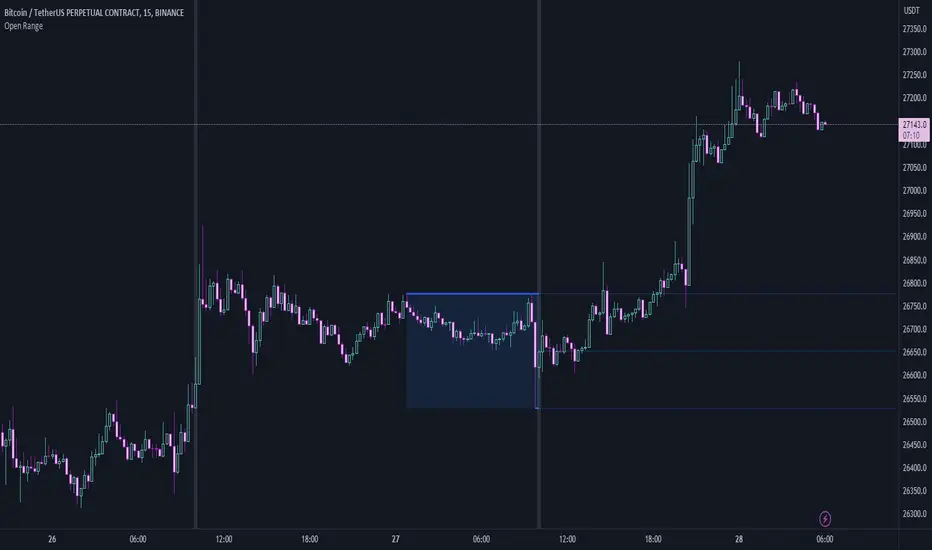
Open RangeThis is a simple script that will look back a set number of candles at a specified time (example: Ny Open) and find the "High and Low " of the range/ market in the given look back period. It will then draw two lines and the range zone as a box. Breakout traders can use these levels to help find interesting areas for a breakout. Reversal traders can use these levels to help locate false breakouts.
Simple type in your time zone Example: GMT-4
Set the time you want the indicator to draw the start line Example: 8:30am
then set the candle look back Example: 60
Hope this script helps spark some ideas
Happy trading
Failed Breakdown Detection'Failed Breakdowns' are a popular set up for long entries.
In short, the set up requires:
1) A significant low is made ('initial low')
2) Initial low is undercut with a new low
3) Price action then 'reclaims' the initial low by moving +8-10 points from the initial low
This script aims at detecting such set ups. It was coded with the ES Futures 15 minute chart in mind but may be useful on other instruments and time frames.
Business Logic:
1) Uses pivot lows to detect 'significant' initial lows
2) Uses amplitude threshold to detect a new low beneath the initial low; used /u/ben_zen script for this
3) Looks for a valid reclaim - a green candle that occurs within 10 bars of the new low
4) Price must reclaim at least 8 points for the set up to be valid
5) If a signal is detected, the initial low value (pivot low) is stored in array that prevents duplicate signals from being generated.
6) FBD Signal is plotted on the chart with "X"
7) Pivot low detection is plotted on the chart with "P" and a label
8) New lows are plotted on the chart with a blue triangle
Notes:
User input
- My preference is to use the defaults as is, but as always feel free to experiment
- Can modify pivot length but in my experience 10/10 work best for pivot lows
- New low detection - 55 bars and 0.05 amplitude work well based on visual checks of signals
- Can modify the number of points needed to reclaim a low, and the # of bars limit under which this must occur.
Alerts:
- Alerts are available for detection of new lows and detection of failed breakdowns
- Alerts are also available for these signals but only during 7:30PM-4PM EST - 'prime time' US trading hours
Limitations:
- Current version of the script only compares new lows to the most recent pivot low, does not look at anything prior to that
- Best used as a discretionary signal
Visit /u/ben_zen's Profile:
www.tradingview.com
Profile Link www.tradingview.com

Moon Phases + Daily, Weekly, Monthly, Quarterly & Yearly Breaks█ Moon Phases
From LuxAlgo description.
Trading moon phases has become quite popular among traders, believing that there exists a relationship between moon phases and market movements.
This strategy is based on an estimate of moon phases with the possibility to use different methods to determine long/short positions based on moon phases.
Note that we assume moon phases are perfectly periodic with a cycle of 29.530588853 days (which is not realistically the case), as such there exists a difference between the detected moon phases by the strategy and the ones you would see. This difference becomes less important when using higher timeframes.
█ Daily, Weekly, Monthly, Quarterly & Yearly Breaks
This indicator marks the start of the selected periods with a vertical line that help with identifying cycles.
It allows to enable or disable independently the daily, weekly, monthly, quarterly and yearly session breaks.
This script is based on LuxAlgo and kaushi / icostan scripts.
Moon Phases Strategy
Year/Quarter/Month/Week/Day breaks
Month/week breaks

Inside Bar SetupScript Details
- This script plots Inside Bar for given day in selected time-frame (applicable only for Timeframes < Day)
- Basis plotted inside bar, relevant targets are marked on the chart
- Targets can be customised from script settings. Example, if range of mother candle is 10 points, then T1 is 10 * x above/below mother candle and T2 is 10 * y above/below mother candle. This x & y are configured via script settings
How to use this script ?
- This script works well on 10-15 mins timeframe for stocks, 15/30 mins timeframe for nifty index and 30/60 mins time frame for bank nifty index
- If mother candle high is broken, take long trade with SL of mother candle low and if low is broken, take short trade with SL of mother candle high
Remember:
1. Above logic is to be combined with support/resistances i.e. price action. This script is an add-on to price action analysis giving you more conviction.
2. If range of mother candle is very high, it is recommended to avoid the trade.
3. Basis inside bar formed on higher time frame, take trade on basis of lower time frame i.e if inside bar is formed on 60 mins, take trade on the basis of 10-15 mins time frame
Example:
1. As seen in the chart, Nifty is near it's resistance and we are seeing Inside Bar being formed, In such scenario, even if High of Mother Candle is broken, we should be more interested to short as we are near resistance and probability of getting our targets in long side is less.
2. So, if I see breakdown of mother candle i.e. price going below low of mother candle, we will short with SL of high of mother candle.
3. As seen in the chart, both the targets are achieved.
Additional Info:
1. Targets on Long/Short Side can be configured via settings. For indices 1 times/1.5 times the range works well.
2. This script plots targets basis the first inside bar formed in the day for selected time frame.
3. Inside bars formed through out the day are coloured separately but lines are plotted only on the basis of 1st formed inside bar as this strategy works well for the first formed inside bar)
4. Don't forget to check volume in case of breakout/breakdown.
Note:
1. Mother Candle - First Candle of Inside Bar
2. Child Candle - Candle formed inside Mother Candle (Second Candle of Inside Bar)
Happy Trading :)

Pre Market \ Opening Range High LowGreen vertical lines are showing pre market open and then the opening range as the first hour of market NYSE market open
Pre market high and low are blue lines | intraday opening range high low are in white
Trades are taken in the current direction above | below range breaks with the direction of price action using the moving averages
Price breaking through moving averages and a range is the optimal trade to enter - exit at next range for target - stop loss below the lower | higher moving average depending on short or long
A break above or below the intraday high or low and pre market high or low can give massive profits trailing your stop loss as price runs
Using MA 5 and 12 to filter out entries and exits above or below the ranges short or long is also another strategy to implement
BEST TIME FRAME TO USE IS 5 MINUTE

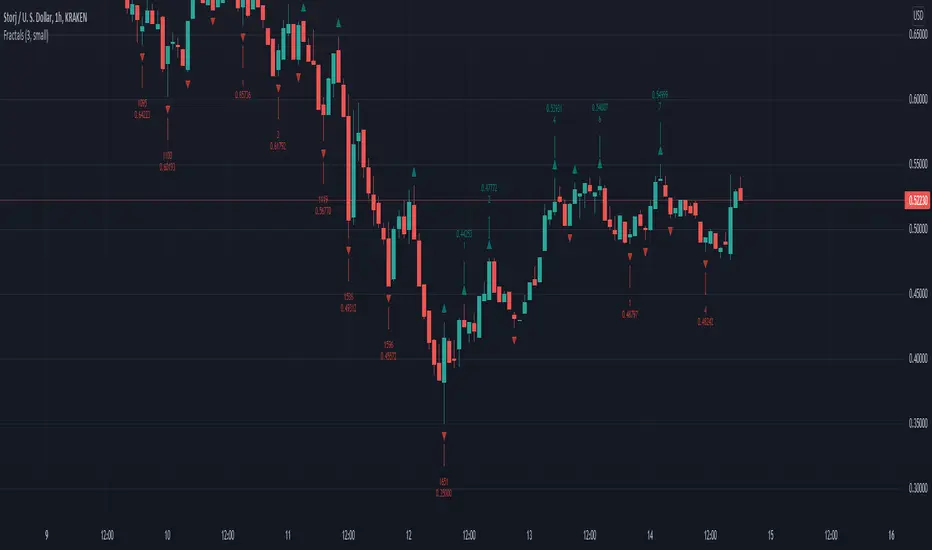
Williams Fractals with BreaksThis is a Bill Williams fractal indicator with breaks.
I was turned onto fractals and the importance of their breaks by ChaosTrader63.
I know several version of this indicator have been done.
I chose this as a first project because of it's simplicity , but also because of the poor code quality of some other versions I looked at.
This is the first draft that successfully met my three criteria:
* Must identify all fractals, including simultaneous up/down fractals.
* Must identify fractal breaks with a clear indicator.
* Must provide information on how many fractals
For the first bullet, I wanted to provide a more concise modern version than the boolean logic composition I was seeing in other examples.
The later two required tracking the past which was not present in the other versions I looked at.
Code here can be improved for more uses and better integration, but it is functional and elegant enough to use.
Thanks for checking it out.
Jolly Wizard
EMA MTF PlusI like trading the 1 minute and 3 minutes time-frames. I'm what is commonly called a "scalper". Long term investments yes, I have some, but for trading, I don't have neither the time,
nor the patience to wait hours or days for my trade to be complete.
This doesn't mean I discount the higher time-frames, no, I actually rely heavily on them. I found that EMAs do a decent job as support/resistance, sometimes to a tick level of precision. And this is important for a 1 minute trader.
As such, I made this script that tracks the higher time-frames EMAs and displays the last value as a line.
I do not need the whole EMA, I'm not interested in crossovers or crossunders, these are anyway late signals for me.
What's with the triangles? These are local tops/bottoms , candles that have a have decent size of the wick. These tops and bottoms are by no means "final", they are merely a rejection at certain levels of price. Due to markets complexities (and human erratic behaviors hehe) these levels could be breached at the very next candle. For a more "final" version (nothing is really final but..) I added Schaff Trend Cycle as filter, so a triangle will pop only when a trend is mature enough ( STC with a value near 0 or near 100).
Colored bars. When the body of the candle is big, it shows strength. Strong bars tend to have follow through, especially when breaking key levels. The script looks at the body of the candle and compares it with ATR (Average True Range), if it's at least 0.8 of ATR it changes the bar color to yellow (bull candles) or fuchsia(bear candles).
Range identifier. This code is copied from Lazy Bear (if there are any issues please let me know), it's very useful in conjunction with colored bars.
I look for breakout candles that go outside of the range as a signal for a trade.
There are many ways in which this script can be useful, like trading mean reversions or momentum trades (breakouts) or simply trend following trades.
I hope you guys find it useful, you can play with default values and change them as you like, these are what I found to be working best for me and my trading universe (mostly crypto).
Special thanks for the original work of:
LazyBear
everget
Jim8080

Volume Positive Negative (VPN) [LevelUp]The idea and calculations for the Volume Positive Negative (VPN) indicator were created by Markos Katsanos. Markos wrote about the indicator in the article Detecting High-Volume Breakouts, published in Technical Analysis of Stocks & Commodities April, 2021 (Vol. 39, Issue 5).
The goal of the VPN indicator is to detect breakouts using only volume. The basic idea is to compare volume on up days versus volume on down days. The indicator can oscillate between the range of -100 and 100. Values between 0 and 20 are generally considered bullish, negative are bearish.
When the plotted VPN crosses over what Markos refers to as the critical value, that may indicate a high volume breakout. The critical value can be adjusted between 0 to 20, 10 is the default,
Volume Positive Negative Calculation (VPN)
VPN = (VP - VN) / MAV / Period * 100
VP - sum of positive volume
VN - sum of negative volume
MAV - moving average of volume
Volume is considered positive when the average price is higher than the previous day's price by more than .1 of the ATR (average true range).

Please help to make Larry Williams' volatility breakthrough.Hello Traders!
I'm going to backtest Larry Williams' volatility breakthrough strategy.
However, contrary to my expectation, orders at certain bars are made the next day.
Is there anything I missed at my pine script code?
Please give me any tiny tips.
Thank you!!

False BreakoutA false breakout is when the price temporarily moves above or below a key support or resistance level, but then later retreats back to the same side as it started.
The “False Breakout” indicator reveals false breakouts in comparison to the previous candle.
In case we're looking to trade the stock for long this would mean that the price of the stock broke the previous low (support) and then got back above that low.
In case we're looking to trade the stock for short then a false breakout would mean the stock broke the previous high (resistance) and then got back below that high.
How to use the indicator?
First choose the direction you're looking to trade, meaning either long or short.
Then choose how strict you want to be about the Falls brakes.
There are three options:
The first option named “All“ means that it's enough that the stock broke the previous level and then get back to the original side.
The second option is “Supporting Change” meaning not only that the stock broke the previous key level (support or resistance), but also the change at the end of the candle is supporting the main direction - meaning the change is positive for long or negative for short.
The third option is “Engulfing”. This is a well-known candle, but to make it clear, in our case “Engulfing” means that not only the stock broke the previous level but it also ended the day on the other side of the candle - higher than the previous high, in case of long, and lower than the previous low, in case of short.
When you choose the level of strictness you determine how many indications you're going to get on the chart.
If you choose the highest level of strictness, meaning “Engulfing”, you would only see the red flags indicating engulfing candles.
If you choose the lowest level of strictness, meaning “All”, you will get more indications on your chart, including every false breakout.
When the direction you're looking for is long, all indications would appear below the candles.
When the direction you're looking for is short, then all indications would appear above the candles.
The Engulfing candles are represented by Red flags, and the Simple breakouts candles are represented by yellow. All colors may be adjusted to your preference.
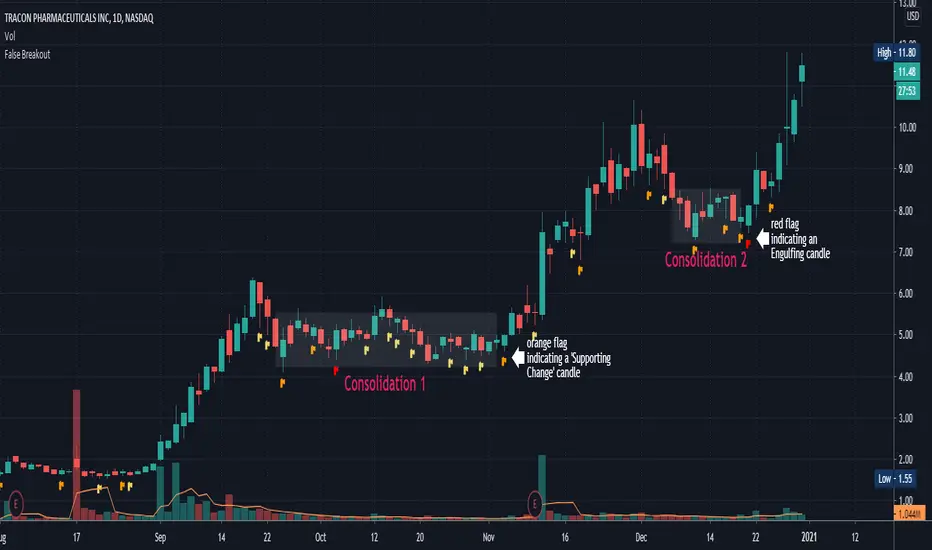
Explaining the example above:
In the chart above we can see two consolidations. At the end of each consolidation, we can see a candle with an indication from the indicator that points out that this could be the end of the consolidation and the stock might continue its move.
In “consolidation 1” we can see that there is an orange flag below the candle right before the stock began to move up again.
In “consolidation 2” we can see that there is a red flag below the candle, right before the stock began another move.
Wishing you all the best :)
SMT - Smart Money Thursday Boxes
The Smart Money Trading Thursday - is a very specific trading system. You only trade it on a Thursday.
The script/indicator will color Thursdays as two boxes. If you just want one color, use same color for
both boxes. The boxes is there to indicate London/New York sessions.
SETTINGS
In the setting you find a numeric value as 1700-0400:5
The "5" indicate Thursday. You can change that if you prefer to color another specific day.
For example "4" would indicate Wednesday. And you can change the hours to fit your
sessions and trading style.
You can also use the 2 boxes on different days. If you for example would like to color up
London for Wednesday and Thursday. Then set hours to fit London session and adjust the
:5 to 4 on the 1st box and 5 on the 2nd.
HOW TO USE IT?
The Smart Money works in a way retail trading does not. Smart Money has an objective
to locate retail patterns, where there will be a lot of stop loss volume to be grabbed.
So when a retail trader see a setup like a "Double Top / Bottom". The Institutional
will see $$$ of dumb money, ready to be taken. The best moves happen on a Thursday
but if you are a skilled trader, you can see the move also occur on Wednesday or Friday.
The first thing that will happen, is that the Smart Money Breaks out of session. Meaning
they will leave the current weeks high/low range. To start collect negative contracts
of the retail volume.
When you see that happen. And you see a breakout that consist of 4 in a row 1 hour
chart candles. Then you have your first rule meet.
#1 Thursday breakout of current weeks high/low. And the move is a clean 4 hour move
as 4x H1 candles. The move can start within range. But must end clearly outside.
Visual Example:
#2 Next, we await an engulf at peak or near peak. That is where Institutional
may have problem to match any more contracts, and since they used their own
money to make this move. They must now mitigate orders, and return back to
the original retail pattern as most retail traders are now stopped out.
(Normally this is a long/clear candle out of range. they rarely go lower
then retail traders entry in the 1st push. This to not save any souls :)
#3 Price returns back to where the breakout from the retail happens.
You can now take your profit as a Smart Money Trader. Trading with less risk,
you can take profit of the return of that latest 4x H1 candle move. (Order
Block)
CONCLUSION
The best trade is when you can combine a retail pattern, followed by a
breakout which holds 4x 1 hour candles in the outbreak direction.
2nd best is when you have the 4x H1 breakout and really no clear retail
pattern. Still is the same game. Just not as clear as the one above.
Study the steps in this image and you see what to look after:
Good Luck with your trading!
Regards,
The Hunter Trading Group

Soldiers Pattern ModifiedThis can be perceived as modified 3 soldiers, relaxed NR4 or even extended harami candlestick pattern.
Works for any instrument and any timeframe.
The idea is to find out any number of candles having their individual highs and lows, all within high and low range of base candle.
The count of soldiers and if they must be of same color, both can be configured.
Additional configurable settings is to add further check of having body of soldiers as well within body of base candle.
Trading strategy: Trade high or low breakout of base candle, having other as stop loss, for a risk reward ratio of 1:2.

Big Breakout IndexBig Breakout Index is a great indicator for detecting breakouts. When the current close breaks out of consolidation, the indicator will tell you.
Green - Buy
Red - Sell

Force IndexWhat is the force index ?
The force index is an oscillator used to confirm price breakout strengths and identify potential trends.
It was popularized by A. Elder.
How the force index is computed ?
Knowing that volume is the fuel of a price movement, reliable breakouts and trend continuation are more likely to occur on high volume breakouts. This is why the force index is computed with the intensity of the price movement, and it's volume , using the formula ema13((close(n) - close(n-1)) * volume ) .
How to use the force index
An important change in the force index indicate a strong momentum in the price action.
You can read more about the force index interpretation on Investopedia
Customization
You can display the indicator as an histogram, or as a line chart.
You can change EMA length, although it's recommended to keep it at default value.

CPR by Anand with PDL/PDH & Breakouts 15/30 minsThis is an enhanced version of CPR by Anand with Configurable previous day high and low and option to configure breakout lines of 15 and 30 mins.
Will be an useful tool for day traders who follows CPR tricks and breakouts.

4 EMA Perfect Order + Strength + MTF + Breakdown Alerts (v6.1)📘 Description
4 EMA Perfect Order + Strength + MTF + Breakdown Alerts (v6.1)
This indicator provides a complete multi‑EMA trend structure analysis with Perfect Order detection, breakdown alerts, strength measurement, and multi‑timeframe confirmation. It is designed for traders who want a clean, reliable, and highly configurable trend‑following tool.
---
🔍 Key Features
1. Customizable EMA System (1–4 lines)
You can choose how many EMAs to display (1 to 4) and freely set the period for each EMA.
This allows you to adapt the indicator to any trading style—from scalping to swing trading.
2. Perfect Order Detection
The script identifies:
• Bullish Perfect Order (EMA1 > EMA2 > EMA3 > EMA4)
• Bearish Perfect Order (EMA1 < EMA2 < EMA3 < EMA4)
Signals are triggered only when the structure changes, ensuring clean and meaningful alerts.
3. Breakdown Alerts
The indicator detects when a previously established Perfect Order collapses:
• Bullish PO Breakdown
• Bearish PO Breakdown
These moments often signal trend exhaustion or the beginning of a reversal.
4. Multi‑Timeframe (MTF) EMA Confirmation
All EMAs are calculated on a higher timeframe of your choice.
This helps you align entries with the dominant trend and avoid counter‑trend traps.
5. Trend Strength Measurement
The indicator calculates the percentage distance between the fastest and slowest EMA.
Displayed directly on the chart:
• Current timeframe strength
• MTF strength
This gives you a quick visual gauge of trend momentum.
6. Clean Visual Signals
• Arrows for Perfect Order confirmation
• Circles for breakdown events
• Optional EMA visibility based on your selected count
Everything is designed for clarity and minimal chart clutter.
7. Full Alert Support
Alerts are available for:
• Bullish Perfect Order
• Bearish Perfect Order
• Bullish Breakdown
• Bearish Breakdown
Perfect for automated notifications or bot integration.
---
🎯 Ideal For
• Trend‑following traders
• EMA‑based systems
• Multi‑timeframe confluence strategies
• Reversal detection
• Scalping, day trading, swing trading
---
💡 Summary
This indicator combines flexibility, precision, and multi‑timeframe logic to help you identify strong trends, detect structural shifts, and stay aligned with market momentum.
Highly customizable and suitable for any market or timeframe.

1H ETH Volume Breakout [ADX Filtered]Title: 1H ETH Volume Breakout w/ ADX Filter
Description:
🚀 Strategy Overview
This strategy is a high-precision Volatility Breakout system designed specifically for Ethereum (ETH) on the 1H timeframe. It focuses on catching explosive moves while aggressively filtering out market noise and "chop" to protect capital.
Unlike standard breakout strategies that get wrecked in sideways markets, this script uses a multi-layer confirmation system (Volume + Trend + Momentum + ADX) to ensure high-probability entries.
🧠 The Logic (How it works)
Keltner Channel Breakout: We use Keltner Channels (Length 22, Multiplier 2.0) instead of Bollinger Bands because they adapt better to ETH's unique volatility, reducing fake-outs.
Volume Confirmation: A trade is only taken if the current volume spikes above the moving average. "No Volume = No Trade."
Trend Filter (220 EMA): We only trade Long when price is above the 220 EMA, and Short when below. We trade with the dominant trend, never against it.
The "Chop Killer" (ADX Filter): An added ADX filter ensures the trend has real strength before entering. If the market is flat (ADX < 20), the strategy sits on the sideline.
🛡️ Risk Management (The "Fee Crusher")
Dynamic Stop Loss: Uses ATR (4.0) to give trades room to breathe without getting wicked out.
Trailing Stop: Activates after a 3% gain to lock in profits during big pumps.
Money Management: Includes a built-in Compounding feature (Optional).
⚙️ Recommended Settings
Coin: ETH/USD or ETH/USDT
Timeframe: 1 Hour (1H)
Leverage: 2x (Recommended)
Exchange Fees: Tuned for 0.1% fees.
⚠️ Disclaimer
Past performance is not indicative of future results. Please backtest with your own exchange settings before using real capital. This is an open-source tool for educational purposes.

Custom Time-Range Breakout with 4x EMA Filter Time-Range Breakout Monitor with 4x EMA FilterThis indicator is a powerful tool designed to capture volatility during specific market hours (like London or New York opens). It monitors a custom price range (High/Low) and tracks whether these levels are breached, using a 4x EMA ribbon as a trend filter.Key Features:Adjustable Range: Define your own start and end time (hours and minutes) to mark the session range.Breakout Tracking: The indicator visually tracks if the High or Low of the session has been taken (Broken) and displays the status in a real-time dashboard.4x EMA Ribbon: Integrated trend filter with specific color coding for quick visual confirmation.Smart Alerts: Built-in alerts for both Bullish (Up) and Bearish (Down) breakouts.EMA Color Legend (Rafał's Setup):EMA PeriodColorRoleEMA 20GrayShort-term momentumEMA 50GreenMedium-term trend confirmationEMA 100YellowIntermediate support/resistanceEMA 200RedLong-term baseline (The "Trendline")How to Use:Set the Session: Input your target range in the settings (e.g., 09:00 - 10:00).Monitor the Dashboard: The top-right table shows "TAK" (YES) or "NIE" (NO) if the levels have been breached during the current day.Confirm the Trend: * Long: Price breaks above the range AND is supported by the Green (50) and Red (200) EMAs.Short: Price breaks below the range AND is trending under the Green (50) and Red (200) EMAs.Settings:Start/End Hour & Minute: Full control over the tracked time window.Alerts: Enable "Wybicie Górą" or "Wybicie Dołem" in the TradingView Alert menu.
