AutoFib Breakout Strategy for Uptrend AssetsThis trading strategy is designed to help you catch powerful upward moves on assets that are in a long-term uptrend, such as Gold (XAUUSD). It uses a popular technical tool called the Fibonacci Extension, combined with a trend filter and a risk-managed exit system.
✅ When to Use This Strategy
• Works best on higher timeframes: Daily (1D), 3-Day (3D), or Weekly (W).
• Best used on uptrending assets like Gold.
• Designed for swing trading – holding trades from a few days to weeks.
📊 How It Works
1. Find the Trend
We only want to trade in the direction of the trend.
• The strategy uses the 200-period EMA (Exponential Moving Average) to identify if the market is in an uptrend.
• If the price is above the 200 EMA, we consider it an uptrend and allow long trades.
2. Identify Breakout Levels
• The strategy detects recent high and low pivot points to draw Fibonacci extension levels.
• It focuses on the 1.618 Fibonacci level, which is often a target in strong trends.
• When the price breaks above this level in an uptrend, it signals a potential momentum breakout – a good time to buy.
3. Enter a Trade
• The strategy enters a long (buy) position when the price closes above the 1.618 Fibonacci level and the market is in an uptrend (above the 200 EMA).
4. Manage Risk Automatically
• The trade includes a stop-loss set to 1x the ATR (Average True Range) below the entry price – this protects against sudden drops.
• It sets a take-profit at 3x the ATR above the entry – aiming for higher rewards than risks.
⚠️ Important Notes
• 📈 Higher Timeframes Preferred: This strategy works best on Daily (D), 3-Day (3D), and Weekly (W) charts, especially on Gold (XAUUSD).
• 🧪 Not for Deep Backtesting: Due to the nature of how pivot points and Fib levels are calculated, this strategy may not perform well in backtesting simulations (because the historical calculations can shift). It is better used for live analysis and forward testing.
Cerca negli script per "breakout"

HTF Candle Breakout Fibonacci LevelsThis indicator automatically plots Fibonacci retracement levels on a lower timeframe (LTF) after detecting a breakout candle on a selected higher timeframe (HTF).
🔍 How It Works
When a candle on your selected HTF closes beyond the high or low of the previous candle, the indicator automatically draws Fibonacci levels on the LTF.
These levels remain visible until the next HTF candle is formed — allowing you to trade retracements with contextual precision.
⸻
⚙️ Customization Options
From the indicator settings, you can modify:
• The HTF candle timeframe (default is 1D)
• Fibonacci levels and colors
• Enable or disable “Show Only the Latest Levels” — ideal for live trading to keep the chart clean and focused.
⸻
🟪 HTF Candles Preview
After applying the indicator, you’ll see 3 vertical bars on the right edge of your LTF chart. These represent a live preview of the last three HTF candles and update in real-time.
If you prefer a cleaner chart, disable this feature via the “Show HTF Candles” toggle in the settings.
⸻
Feel free to reach out if you have any questions.

Livermore-Seykota Breakout StrategyStrategy Name: Livermore-Seykota Breakout Strategy
Objective: Execute breakout trades inspired by Jesse Livermore, filtered by trend confirmation (Ed Seykota) and risk-managed with ATR (Paul Tudor Jones style).
Entry Conditions:
Long Entry:
Close price breaks above recent pivot high.
Price is above main EMA (EMA50).
EMA20 > EMA200 (uptrend confirmation).
Current volume > 20-period SMA (volume confirmation).
Short Entry:
Close price breaks below recent pivot low.
Price is below main EMA (EMA50).
EMA20 < EMA200 (downtrend confirmation).
Current volume > 20-period SMA.
Exit Conditions:
Stop-loss: ATR × 3 from entry price.
Trailing stop: activated with offset of ATR × 2.
Strengths:
Trend-aligned entries with volume breakout confirmation.
Dynamic ATR-based risk management.
Inspired by principles of three legendary traders.

NYBREAKOUT by FliuxStrategy Concept
This strategy captures high-probability breakout moves by defining a tight 30-minute range during low-volatility hours and trading the first clear break beyond that range with a 2:1 reward-to-risk ratio.
Key Benefits
Simplicity: Clear, time-based range and mechanical entries/exits.
Defined R:R: Automatic 2:1 target ensures consistent risk management.
Time-filtered: Trades only the initial breakout of a calm, pre-session range.
How to Use
Add to Chart: Paste the Pine Script into TradingView’s Pine Editor, then click Add to Chart.
Backtest: Open Strategy Tester to review net profit, drawdown, win rate, and profit factor.
Optimize: Adjust stop-loss offset, R:R ratio, or session window parameters to suit different instruments or volatility regimes.

Moving Volume-Weighted Avg Price, % Channel, BBsThis script includes:
- Moving Volume-Weighted Average Price line.
- User-defined % band above and below, very useful for "breakout" signals, and mentally adjusting to the magnitude of price swings when viewing an automatic scale on the price axis.
- Volume-Weighted Bollinger Bands, which are more sensitive to volume.
More detail:
- This is like TV's basic VWAP in concept, except the major flaw in that is that it has reset periods that you can't override, and the volume is cumulative until the next hard reset. The 'reset' is OK for securities trading, that resets every day anyway. But not for crypto - and not if/when securities trading goes 24/7. Also, the denominator accumulating over the entire period is also *not* OK, because then what is shown means something different as the day progresses - which kind of makes it useless. In other words, it starts out very sensitive to volume, and gets progressively more numb to it as they day progresses, and starts flattening out.
- This fixes both problems, by using a user-definable moving window for the average. Essentially combining SMA with volume-weighting.
- You may also find an invaluable trading aid, in the % bands above and below.
- What can optionally be shown is standard deviation bands, aka Bollinger bands. The advantage over regular BB is that it's volume-weighted. Since it is already calculated on a moving average, the period for the standard deviation has been shortened by default, and the magnitude increased, to better approximate regular Bollinger Bands - but it's still more responsive to volume.

TTM Squeeze Momentum MTF [Cometreon]TTM Squeeze Momentum MTF combines the core logic of both the Squeeze Momentum by LazyBear and the TTM Squeeze by John Carter into a single, unified indicator. It offers a complete system to analyze the phase, direction, and strength of market movements.
Unlike the original versions, this indicator allows you to choose how to calculate the trend, select from 15 different types of moving averages, customize every parameter, and adapt the visual style to your trading preferences.
If you are looking for a powerful, flexible and highly configurable tool, this is the perfect choice for you.
🔷 New Features and Improvements
🟩 Unified System: Trend Detection + Visual Style
You can decide which logic to use for the trend via the "Show TTM Squeeze Trend" input:
✅ Enabled → Trend calculated using TTM Squeeze
❌ Disabled → Trend based on Squeeze Momentum
You can also customize the visual style of the indicator:
✅ Enable "Show Histogram" for a visual mode using Histogram, Area, or Column
❌ Disable it to display the classic LazyBear-style line
Everything updates automatically and dynamically based on your selection.
🟩 Full Customization
Every base parameter of the original indicator is now fully configurable: lengths, sources, moving average types, and more.
You can finally adapt the squeeze logic to your strategy — not the other way around.
🟩 Multi-MA Engine
Choose from 15 different Moving Averages for each part of the calculation:
SMA (Simple Moving Average)
EMA (Exponential Moving Average)
WMA (Weighted Moving Average)
RMA (Smoothed Moving Average)
HMA (Hull Moving Average)
JMA (Jurik Moving Average)
DEMA (Double Exponential Moving Average)
TEMA (Triple Exponential Moving Average)
LSMA (Least Squares Moving Average)
VWMA (Volume-Weighted Moving Average)
SMMA (Smoothed Moving Average)
KAMA (Kaufman’s Adaptive Moving Average)
ALMA (Arnaud Legoux Moving Average)
FRAMA (Fractal Adaptive Moving Average)
VIDYA (Variable Index Dynamic Average)
🟩 Dynamic Signal Line
Apply a moving average to the momentum for real-time cross signals, with full control over its length and type.
🟩 Multi-Timeframe & Multi-Ticker Support
You're no longer limited to the chart's current timeframe or ticker. Apply the squeeze to any symbol or timeframe without repainting.
🔷 Technical Details and Customizable Inputs
This indicator offers a fully modular structure with configurable parameters for every component:
1️⃣ Squeeze Momentum Settings – Choose the source, length, and type of moving average used to calculate the base momentum.
2️⃣ Trend Mode Selector – Toggle "Show TTM Squeeze Trend" to select the trend logic displayed on the chart:
✅ Enabled – Shows the trend based on TTM Squeeze (Bollinger Bands inside/outside Keltner Channel)
❌ Disabled – Displays the trend based on Squeeze Momentum logic
🔁 The moving average type for the Keltner Channel is handled automatically, so you don't need to select it manually, even if the custom input is disabled.
3️⃣ Signal Line – Toggle the Signal Line on the Squeeze Momentum. Select its length and MA type to generate visual cross signals.
4️⃣ Bollinger Bands – Configure the length, multiplier, source, and MA type used in the bands.
5️⃣ Keltner Channel – Adjust the length, multiplier, source, and MA type. You can also enable or disable the True Range option.
6️⃣ Advanced MA Parameters – Customize the parameters for advanced MAs (JMA, ALMA, FRAMA, VIDYA), including Phase, Power, Offset, Sigma, and Shift values.
7️⃣ Ticker & Input Source – Select the ticker and manage inputs for alternative chart types like Renko, Kagi, Line Break, and Point & Figure.
8️⃣ Style Settings – Choose how the squeeze is displayed:
Enable "Show Histogram" for Histogram, Area, or Column style
Disable it to show the classic LazyBear-style line
Use Reverse Color to invert line colors
Toggle Show Label to highlight Signal Line cross signals
Customize trend colors to suit your preferences
9️⃣ Multi-Timeframe Options - Timeframe – Use the squeeze on higher timeframes for stronger confirmation
🔟 Wait for Timeframe Closes -
✅ Enabled – Prevents multiple signals within the same candle
❌ Disabled – Displays the indicator smoothly without delay
🔧 Default Settings Reference
To replicate the default settings of the original indicators as they appear when first applied to the chart, use the following configurations:
🟩 TTM Squeeze (John Carter Style)
Squeeze
Length: 20
MA Type: SMA
Show TTM Squeeze Trend: Enabled
Bollinger Bands
Length: 20
Multiplier: 2.0
MA Type: SMA
Keltner Channel
Length: 20
Multiplier: 1.0
Use True Range: ON
MA Type: EMA
Style
Show Histogram: Enabled
Reverse Color: Enabled
🟩 Squeeze Momentum (LazyBear Style)
Squeeze
Length: 10
MA Type: SMA
Show TTM Squeeze Trend: Disabled
Bollinger Bands
Length: 20
Multiplier: 1.5
MA Type: SMA
Keltner Channel
Length: 10
Multiplier: 1.5
Use True Range: ON
MA Type: SMA
Style
Show Histogram: Disabled
Reverse Color: Disabled
⚠️ These values are intended as a starting point. The Cometreon indicator lets you fully customize every input to fit your trading style.
🔷 How to Use Squeeze Momentum Pro
🔍 Identifying Trends
Squeeze Momentum Pro supports two different methods for identifying the trend visually, each based on a distinct logic:
Squeeze Momentum Trend (LazyBear-style):
Displays 3 states based on the position of the Bollinger Bands relative to the Keltner Channel:
🔵 Blue = No Squeeze (BB outside KC and KC outside BB)
⚪️ White = Squeeze Active (BB fully inside KC)
⚫️ Gray = Neutral state (none of the above)
TTM Squeeze Trend (John Carter-style):
Calculates the difference in width between the Bollinger Bands and the Keltner Channel:
🟩 Green = BB width is greater than KC → potential expansion phase
🟥 Red = BB are tighter than KC → possible compression or pre-breakout
📈 Interpreting Signals
Depending on the active configuration, the indicator can provide various signals, including:
Trend color → Reflects the current compression/expansion state (based on selected mode)
Momentum value (above or below 0) → May indicate directional pressure
Signal Line cross → Can highlight momentum shifts
Color change in the momentum → May suggest a potential trend reversal
🛠 Integration with Other Tools
Squeeze Momentum Pro works well alongside other indicators to strengthen market context:
✅ Volume Profile / OBV – Helps confirm accumulation or distribution during squeezes
✅ RSI – Useful to detect divergence between momentum and price
✅ Moving Averages – Ideal for defining primary trend direction and filtering signals
☄️ If you find this indicator useful, leave a Boost to support its development!
Every piece of feedback helps improve the tool and deliver an even better trading experience.
🔥 Share your ideas or feature requests in the comments!

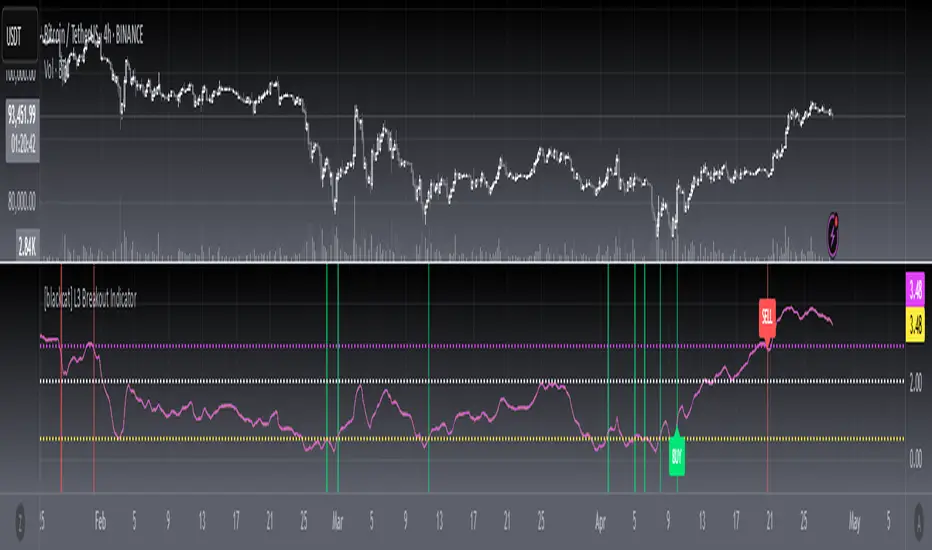
[blackcat] L3 Breakout IndicatorOVERVIEW
This script provides a breakout detection system ( L3 Breakout Indicator) analyzing price momentum across timeframes. It identifies market entry/exit zones through dynamically scaled thresholds and visual feedback layers.
FEATURES
Dual momentum visualization: • Price Momentum Ratio Plot ( yellow ) • Filtered Signal Value Plot ( fuchsia )
Adjustable trade boundaries: ▪ Lower Threshold (default: 0.5) ▪ Upper Threshold (default: 2.9) ▪ Central boundary ( fixed at 2.0 )
Real-time visual feedback: ☀ Buy zone highlights ( lime ) on momentum crossover ⚠ Sell zone highlights ( red ) on momentum cross-under ♦ Dynamic convergence area between plots ( colored gradient )
HOW TO USE
Interpretation Flow
Monitor momentum plots relative to threshold lines
Actionable signals occur when momentum crosses thresholds
Persistent movement above/below central boundary indicates trend continuation
Key Zones
• Below 0.5: Potential buying opportunity zone
• Above 2.0: Cautionary selling region
• Between 0.5-2.0: Neutral consolidation phase
Optimization Tips
Adjust thresholds based on asset volatility
Combine with volume metrics for confirmation
Backtest parameters using historical data
LIMITATIONS
• Lag induced by 4-period EMA smoothing
• Historical dependency in calculating extremes (lowest(100)/highest(250))
• No built-in risk management protocols (stop loss take profit)
• Performance variability during sideways markets
5-Min First Candle Breakout/BreakdownAwesome! Here's a basic Pine Script (v5) for a First 5-minute candle breakout/breakdown strategy with Buy/Sell signals and price labels. This script works by capturing the high and low of the first candle of the session and then showing signals when those levels are broken.
You can customize it further for Entry, Stop Loss, Target, etc., but this gives you the foundation with labels for buys/sells based on breakout/breakdown.

Time Box Breakout IndicatorPlots Boxes with breakout signals on whatever timeframe the user selects.
Allows for users to see higher timeframe ranges on lower timeframes.
Useful for scalpers taking advantage of momentum, combined with support and resistance on higher timeframes.
Aids in visualizing risk, ranges and trends.

Daily & Weekly False-Breakout DetectorDaily & Weekly Lines
We retrieve previous day/week’s High and Low.
lookahead=barmerge.lookahead_on means we see the “final” daily/weekly bar values intraday, so it may repaint in real‐time.
False Breakout Logic
Intraday crosses of close above the previous high (PDH or PWH).
By the end of the daily/weekly bar, close is back below that high.
Similarly for false breakdowns below PDL or PWL.
Shape/Alert
Each time an intraday bar crosses up or down, if the final daily/weekly close reverts back inside the prior range, a label is drawn and an alert is triggered.
Because we are “peeking” at the daily/weekly close, these signals can appear or disappear in real‐time.
If you only want a confirmed signal after the period’s close, switch to lookahead_off, which will finalize them at the next day or next week.

Bitcoin Liquidity Breakout with ICT StrategiesBitcoin Liquidity Breakout with ICT Strategies
a one of many scripts developed by our engineers .
Check the results for yourself

Advanced 1-Minute Open Range Breakout IndicatorThis indicator is designed for the market on a 1-minute chart. It calculates the open range based on the first 5 minutes after the market open (09:30 – 09:35) and plots the high and low of this period as the daily resistance and support levels respectively. Additionally, the indicator displays the previous day’s high and low as blue horizontal lines, providing extra reference levels.
Trade signals are generated only during the active trading session (09:35 – 16:00). The advanced trade logic works as follows:
• For long entries:
- When the price first breaks above the open range high, the indicator enters a “breakout” state.
- If the price then retraces to (or below) the open range high, it moves to a “retest” state.
- Finally, if the price breaks above the open range high again, a long signal is issued.
• For short entries:
- When the price first breaks below the open range low, the indicator enters a “breakdown” state.
- If the price then retraces to (or above) the open range low, it moves to a “retest” state.
- Finally, if the price breaks below the open range low again, a short signal is issued.
All signals and the open range lines are only displayed during the trading session (09:35 to 16:00).
Use this indicator to help identify high-probability breakout setups in the early part of the trading day.

Bitcoin 1H-15M Breakout StrategyKey Features
1H and 15M Timeframes:
The script uses the 1-hour timeframe for the range and 15-minute timeframe for breakout conditions.
request.security is used to fetch the higher timeframe data.
Risk Management:
Variables entry_price, sl_price, and tp_price are declared explicitly as float with na initialization to handle dynamic assignment.
Stop-loss and take-profit levels are calculated based on the specified Risk-Reward Ratio (RRR) and buffer (in pips).
Trade Logic:
Long trade triggered when the 15-minute candle closes above the 1-hour high.
Short trade triggered when the 15-minute candle closes below the 1-hour low.
Visualization:
The range_high and range_low (previous 1-hour high and low) are plotted on the chart using dashed lines.
Debugging:
Enabling the show_debug input displays labels showing stop-loss and take-profit values for easier troubleshooting.

Market StructureThis is an advanced, non-repainting Market Structure indicator that provides a robust framework for understanding market dynamics across any timeframe and instrument.
Key Features:
- Non-repainting market structure detection using swing highs/lows
- Clear identification of internal and general market structure levels
- Breakout threshold system for structure adjustments
- Integrated multi-timeframe compatibility
- Rich selection of 30+ moving average types, from basic to advanced adaptive variants
What Makes It Different:
Unlike most market structure indicators that repaint or modify past signals, this implementation uses a fixed-length lookback period to identify genuine swing points.
This means once a structure level or pivot is identified, it stays permanent - providing reliable signals for analysis and trading decisions.
The indicator combines two layers of market structure:
1. Internal Structure (lighter lines) - More sensitive to local price action
2. General Structure (darker lines) - Shows broader market context
Technical Details:
- Uses advanced pivot detection algorithm with customizable swing size
- Implements consecutive break counting for structure adjustments
- Supports both close and high/low price levels for breakout detection
- Includes offset option for better visual alignment
- Each structure break is validated against multiple conditions to prevent false signals
Offset on:
Offset off:
Moving Averages Library:
Includes comprehensive selection of moving averages, from traditional to advanced adaptive types:
- Basic: SMA, EMA, WMA, VWMA
- Advanced: KAMA, ALMA, VIDYA, FRAMA
- Specialized: Hull MA, Ehlers Filter Series
- Adaptive: JMA, RPMA, and many more
Perfect for:
- Price action analysis
- Trend direction confirmation
- Support/resistance identification
- Market structure trading strategies
- Multiple timeframe analysis
This open-source tool is designed to help traders better understand market dynamics and make more informed trading decisions. Feel free to use, modify, and enhance it for your trading needs.

IU Opening range Breakout StrategyIU Opening Range Breakout Strategy
This Pine Script strategy is designed to capitalize on the breakout of the opening range, which is a popular trading approach. The strategy identifies the high and low prices of the opening session and takes trades based on price crossing these levels, with built-in risk management and trade limits for intraday trading.
Key Features:
1. Risk Management:
- Risk-to-Reward Ratio (RTR):
Set a customizable risk-to-reward ratio to calculate target prices based on stop-loss levels.
Default: 2:1
- Max Trades in a Day:
Specify the maximum number of trades allowed per day to avoid overtrading.
Default: 2 trades in a day.
- End-of-Day Close:
Automatically closes all open positions at a user-defined session end time to ensure no overnight exposure.
Default: 3:15 PM
2. Opening Range Identification
- Opening Range High and Low:
The script detects the high and low of the first trading session using Pine Script's session functions.
These levels are plotted as visual guides on the chart:
- High: Lime-colored circles.
- Low: Red-colored circles.
3. Trade Entry Logic
- Long Entry:
A long trade is triggered when the price closes above the opening range high.
- Entry condition: Crossover of the price above the opening range high.
-Short Entry:
A short trade is triggered when the price closes below the opening range low.
- Entry condition: Crossunder of the price below the opening range low.
Both entries are conditional on the absence of an existing position.
4. Stop Loss and Take Profit
- Long Position:
- Stop Loss: Previous candle's low.
- Take Profit: Calculated based on the RTR.
- **Short Position:**
- **Stop Loss:** Previous candle's high.
- **Take Profit:** Calculated based on the RTR.
The strategy plots these levels for visual reference:
- Stop Loss: Red dashed lines.
- Take Profit: Green dashed lines.
5. Visual Enhancements
-Trade Level Highlighting:
The script dynamically shades the areas between the entry price and SL/TP levels:
- Red shading for the stop-loss region.
- Green shading for the take-profit region.
- Entry Price Line:
A silver-colored line marks the average entry price for active trades.
How to Use:
1.Input Configuration:
Adjust the Risk-to-Reward ratio, max trades per day, and session end time to suit your trading preferences.
2.Visual Cues:
Use the opening range high/low lines and shading to identify potential breakout opportunities.
3.Execution:
The strategy will automatically enter and exit trades based on the conditions. Review the plotted SL and TP levels to monitor the risk-reward setup.
Important Notes:
- This strategy is designed for intraday trading and works best in markets with high volatility during the opening session.
- Backtest the strategy on your preferred market and timeframe to ensure compatibility.
- Proper risk management and position sizing are essential when using this strategy in live markets.

Candlestick DataCandlestick Data Indicator
The Candlestick Data indicator provides a comprehensive overview of key metrics for analyzing price action and volume in real-time. This overlay indicator displays essential candlestick data and calculations directly on your chart, offering an all-in-one toolkit for traders seeking in-depth insights.
Key Features:
Price Metrics: View the daily high, low, close, and percentage change.
Volume Insights: Analyze volume, relative volume, and volume buzz for breakout or consolidation signals.
Range Analysis: Includes closing range, distance from low of day (LoD), and percentage change in daily range expansion.
Advanced Metrics: Calculate ADR% (Average Daily Range %), ATR (Average True Range), and % from 52-week high.
Moving Averages: Supports up to four customizable moving averages (EMA or SMA) with distance from price.
Market Context: Displays the sector and industry group for the asset.
This indicator is fully customizable, allowing you to toggle on or off specific metrics to suit your trading style. Designed for active traders, it brings critical data to your fingertips, streamlining decision-making and enhancing analysis.
Perfect for momentum, swing, and day traders looking to gain a data-driven edge!

Birdies [LuxAlgo]The Birdies indicator uses a unique technique to provide support/resistance curves based on a circle connecting the last swing high/low.
A specific, customizable part of this circle acts as a curve of interest, which can trigger visual breakout signals.
🔶 USAGE
The script projects a bird-like pattern when a valid Swing point is found. Multiple customization options are included.
🔹 Trend & Support/Resistance Tool
The color fill patterns and the wing boundaries can give insights into the current trend direction as well as serve as potential support/resistance areas.
In the example above, "Birdies" coincide with pullback and support/resistance zones.
🔹 Swing Length & Buffer
Besides the "Swing Length", with higher values returning longer-term Swing Levels, the script's behavior can be fine-tuned with filters ("Settings" - "Validation").
🔹 Validation
To minimize clutter, three filters are included:
Minimum X-Distance: The minimum amount of bars between subsequent Swings
Minimum Y-Distance: The minimum amount of bars between subsequent Swings
Buffer (Multiple of ATR)
The "Minimum X/Y-Distance" creates a zone where a new Swing is considered invalid. Only when the Swing is out of the zone, can it be considered valid.
In other words, in the example above, a Swing High can only be valid when enough bars/time have passed, and the difference between the last Swing and the previous is more than the ATR multiplied by the "Minimum Y-Distance" factor.
The "Buffer" creates a line above/below the "Birdy", derived from the measured ATR at the conception of the "Birdy" multiplied with a factor ("Buffer").
When the closing price crosses the "Birdy", it must also surpass this buffer line to produce a valid signal, lowering the risk of clutter as a result.
🔶 DETAILS
Birdies are derived from a circle that connects two Swing points. The left-wing curve originates from the most recent "Swing point" to the last value on the circle before crossing its midline. The mirror image of the left wing creates the right wing.
Enabling "Origine" will draw a line from the last Swing to the first.
🔹 Style
The publication includes a style setting with four options.
The first, "Birdy," shows a bird-like shape derived from a circle connecting the last Swing High and Swing Low.
The second option holds everything from the first option but connects both wingtips, providing potential horizontal levels of interest.
When setting "Birdy" to "None", the visual breakout signals will not defer from previous settings, but the focus is shifted towards the fill color, which can help detect potential trend shift.
A fourth setting, "Left Wing", will only show the left part of the "Birdy" pattern, removing the right part from the equation. This will change the visual breakout signals, providing alternative signals.
🔶 SETTINGS
Swing Length: The period used for swing detection, with higher values returning longer-term Swing Levels.
🔹 Validation
Minimum X-Distance: The minimum amount of bars between subsequent Swings
Minimum Y-Distance: The minimum amount of bars between subsequent Swings
Buffer (Multiple of ATR)
🔹 Style
Bullish Patterns: Enable / color
Bearish Patterns: Enable / color
Buffer Zone: Show / Color
Color Fill: Show color fill between two Birdies (if available)
Origine: Show the line between both Swing Points
🔹 Calculation
Calculated Bars: Allows the usage of fewer bars for performance/speed improvement

High & Low Of Custom Session - Breakout True Open [cognyto]This indicator is based on the High & Low Of Custom Session - OpeningRange Breakout (Expo) created by Zeiierman.
It adds new functionality and enhances existing settings, targeting ES, NQ, and YM:
Manages session defaults to 12:00 to 13:00
New true opening fully customizable (default 13:00)
Manages timeframe visualization (default 15m and below)
Manages session draw length until the end of the current session (default NY)
Manages previous sessions, allowing the to be hidden
Improves timezone selection (default NY)
Following the strategy called Paradox detailed by DayTradingRauf, it works with indices like ES, NQ, and YM.
The rules consider three possible profiles:
First
AM session as consolidation (08:00-12:00)
Lunch hour range as consolidation (less than 100 points)
PM session breaking either side of the session range
Second
AM session trending lower (08:00-12:00)
Lunch hour range as consolidation (less than 100 points)
PM session trending higher
Third
AM session trending higher (08:00-12:00)
Lunch hour range as consolidation (less than 100 points)
PM session trending lower
After the session ends, the opening price at 13:00 is automatically drawn as it is a key point for the entry strategy.
The strategy can be monitored using a 5-minute or 15-minute timeframe as follows:
- Wait for a liquidity hunt (either the high or low of the lunch session range or AM is taken).
- If liquidity is taken, switch to the 1-minute timeframe and wait for a CISD (change in the state of delivery), where the price closes below an OB, or consider a breaker block or iFVG to enter the trade.
- Bullish entries should happen below the opening price at 13:00, and bearish entries should happen above.
- Consider a 1:2 reward ratio. However, runners can target the opposite side of the range that was not yet taken.
This indicator is for informational purposes only and you should not rely on any information it provides as legal, tax, investment, financial or other advice. Nothing provided by this indicator constitutes a solicitation, recommendation, endorsement or offer by cognyto or any third party service provider to buy or sell any securities or other financial instruments in this or any other jurisdiction in which such solicitation or offer would be unlawful under the securities laws of such jurisdiction.

First 12 Candles High/Low BreakoutThis indicator identifies potential breakout opportunities based on the high and low points formed within the first 12 candles after the market opens on a 5-minute timeframe. It provides visual cues and labels to help traders make informed decisions.
Features:
Market Open High/Low: Marks the highest and lowest price of the first 12 candles following the market open with horizontal lines for reference.
Breakout Signals: Identifies potential buy or sell signals based on the first 5-minute candle closing above the open high or below the open low.
Target and Stop-Loss: Plots horizontal lines for target prices (100 points by default, adjustable) and stop-loss levels (100 points by default, adjustable) based on the entry price.
Visual Cues: Uses green triangles (up) for buy signals and red triangles (down) for sell signals.
Informative Labels: Displays labels with "Buy" or "Sell" text, target price, and stop-loss price next to the entry signals (optional).
Customization:
You can adjust the target and stop-loss point values using the provided inputs.
How to Use:
Add the script to your TradingView chart.
The indicator will automatically plot the open high, open low, potential entry signals, target levels, and stop-loss levels based on the first 12 candles after the market opens.
Use the signals and price levels in conjunction with your own trading strategy to make informed decisions.

Zero-lag Volatility-Breakout EMA Trend StrategyThis is a simple volatility-breakout strategy which uses the difference in two different zero-lag* EMAs (explained below on what exactly I mean by this) to track the upwards or downwards strength of an instrument. When the difference breaks above a Bollinger Band of a configurable standard deviation multiple, the strategy enters based off the direction of the base EMA used (i.e. if the difference breaks above and the current EMA is rising, a long entry is produced. If the difference breaks above and the current EMA is falling, a short entry is produced).
The two EMA-type metrics used to calculate the volatility difference are calculated by the following formula:
top_ema = math.max(src, ta.ema(src, length))
bottom_ema = math.min(src, ta.ema(src, length))
ema_difference = (top_ema - bottom_ema) - 1
This produces a difference which responds immediately to large price movements, instead of lagging if it used strictly the EMA itself.
SETTINGS
Source : The source of the strategy - close, hlc3, another indicator plot, etc.
EMA Difference Length : The length of both the EMA difference statistics and the base EMA used to calculate the entry side.
Standard Deviation Multiple : The Bollinger Bands multiple used when the difference is breaking out.
Use Binary Strategy : The strategy has two configurations: Binary and Rapid-Exit. 'Binary' means that it will not close a long position until a short position is generated, and vice-versa. 'Rapid-Exit' will close a long or short position once the difference reaches the middle Bollinger Band MA. This means that turning on 'Binary' will expose you to more market risk, but potentially greater market return. Turning off 'Binary' will exit quickly and reduce drawdown.
The strategy results below use 10% equity and 0.1% fees per trade.

TouchedLibrary "Touched"
Breakout(zone, lookback)
Tells if the zone has been broken on the current bar.
Parameters:
zone (Zone) : The definitiin of the zone.
lookback (int) : How many bars to look back.
Returns: a Touch object that tells if the zone has been broken up or down.
FalseBreakout(zone, lookback)
Tells if the zone has a false breakout on the current bar.
Parameters:
zone (Zone) : The definitiin of the zone.
lookback (int) : How many bars to look back.
Returns: a Touch object that tells if the zone has had a false breakout up or down.
Retest(zone, lookback)
Tells if the zone has been retested on the current bar.
Parameters:
zone (Zone) : The definitiin of the zone.
lookback (int) : How many bars to look back.
Returns: a Touch object that tells if the zone has been retested up or down.
Zone
Fields:
High (series__float)
Low (series__float)
BaseTime (series__integer)
Touch
Fields:
Up (series__bool)
Down (series__bool)

RSI Box Strategy (pseudo- Grid Bot)This is a strategy intended primarily for algorithmic traders. It's a pseudo-grid bot that uses a dynamic, volume-weighted grid that only updates when the RSI meets certain conditions. It's also a breakout strategy, whereas normal grid bots are not (typical grid bots sell when a higher grid is reached, whereas this strategy sells when a lower grid is breached under specific conditions). This strategy also sells 100% of pyramiding orders on close.
In a nutshell, the strategy updates its grid to the volume-weighted highest/lowest values of your given source ("src" in the settings) each time that there is a RSI crossunder/crossover. From this range it produces an evenly-spaced grid of five lines, and uses the current source to determine which grid line is closest to the source. Then, if the source crosses over the line directly above the current line, it enters a buy order. If the source crosses under the line directly below the current line, it enters a sell order.
You can configure shorts, source, RSI length, and overbought/oversold levels in the settings.
For the strategy results below: fees are at 0.1% per trade, with order size 1% of equity and a max pyramiding value of 33. For a greater R/R profile, you can increase the order size, which will increase drawdown but potentially yield better results.

ATR Extension [QuantVue]The Moving Average ATR Extension Indicator offers a powerful blend of two key market elements: the Average True Range (ATR) and Moving Averages (MA), capturing the dynamics of market momentum and trend direction.
This indicator is used to measure market extension from a user-selected moving average based on multiples of the Average True Range (ATR). By doing this, it becomes remarkably straightforward to spot strength at breakout points or exhaustion near the end of a run.
As a market breaks out the extension indicates a surge in buying pressure, while an extension after a sizeable move can often be an indication of market exhaustion. This extended position essentially reflects over-enthusiastic buying and could be an early warning sign of a potential trend reversal.
Breakout Strength:
Exhaustion:
Give this indicator a BOOST and COMMENT your thoughts!
We hope you enjoy.
Cheers.
