HTF Candle Overlay – Multi-Timeframe Visualization ToolThis indicator overlays true Higher Timeframe (HTF) candlesticks directly onto any lower timeframe chart, allowing you to see the larger market structure while trading on precise execution timeframes such as 1-minute, 3-minute, or 5-minute.
Instead of constantly switching chart timeframes, you can now see both higher and lower timeframe price action at the same time. Each HTF candle is drawn as a large transparent candlestick with full upper and lower wicks, perfectly aligned in both time and price.
This makes it easy to identify:
- Trend direction from the higher timeframe
- Key support and resistance zones inside each HTF candle
- Liquidity sweeps and rejections across timeframes
- Optimal entries on lower timeframes with higher-timeframe confirmation
Key Features
- Displays true Higher Timeframe candles on any lower timeframe
- Clear transparent candle bodies for unobstructed price visibility
- Full upper and lower wicks
- Non-repainting confirmed candles
- Optional live display of the currently forming HTF candle
- Accurate time-based alignment
- Lightweight and optimized for performance
Who This Indicator Is For
- Scalpers who want higher-timeframe bias
- Day traders using multi-timeframe confirmation
- Smart Money / ICT traders monitoring HTF structure
- Anyone who wants clean multi-timeframe clarity without chart switching
How To Use
- Apply the indicator to any chart.
- Select your preferred Higher Timeframe (HTF) in the settings.
- Use your lower timeframe for entries while respecting HTF structure and direction.
- This tool helps you trade with the bigger picture in view while executing with precision on lower timeframes.
Cerca negli script per "candle"

Strong Body Close Candle (90%)This indicator highlights Strong Body Close Candles, which are single bars where the real body makes up the vast majority of the total range and the close is positioned very close to the candle’s extreme. By default, the script looks for candles where the body is at least 90% of the full high-low range, and the close falls within the top 10% (for bullish) or bottom 10% (for bearish). These settings ensure that only very strong, conviction-driven candles are marked. The script plots labels above or below qualifying bars, colors the candle accordingly, and provides alert conditions so you can be notified in real time when such a candle forms.
Both percentages are fully adjustable so you can fine-tune the strictness of the definition. For example, if you change the body threshold to 85% and the close-to-extreme threshold to 15%, the script will highlight candles where the body makes up at least 85% of the total range and the close is within 15% of the high or low. This adjustment allows for a slightly looser definition, catching more frequent signals while still maintaining strength criteria. Built-in alerts let you choose between bullish and bearish signals separately (or both), ensuring you won’t miss setups even when you’re away from the chart.
This tool is flexible across timeframes and instruments. On lower timeframes, signals may appear more frequently, highlighting intraday momentum bursts, while on higher timeframes such as daily or weekly charts, these signals often represent periods of strong directional conviction. Traders can combine this indicator with additional filters such as trend direction, volume confirmation, VWAP, or moving averages to improve reliability and fit it into their broader strategy. Because the body and close thresholds are user-defined, you have control over whether the indicator is tuned to rare but powerful candles (stricter settings) or more frequent signals (looser settings).
The indicator is designed to be non-repainting since it only evaluates candles after they close. It can be used purely visually with chart labels and bar coloring or as part of an automated workflow with TradingView alerts. Alerts are triggered on bar close whenever a bullish or bearish strong body close candle is detected, allowing you to integrate them into your trading process via pop-ups, emails, mobile notifications, or webhooks. Whether you’re looking for sharp reversals, momentum continuation signals, or simply want to filter out weaker candles, this tool provides a clear and adjustable framework for identifying high-conviction bars.

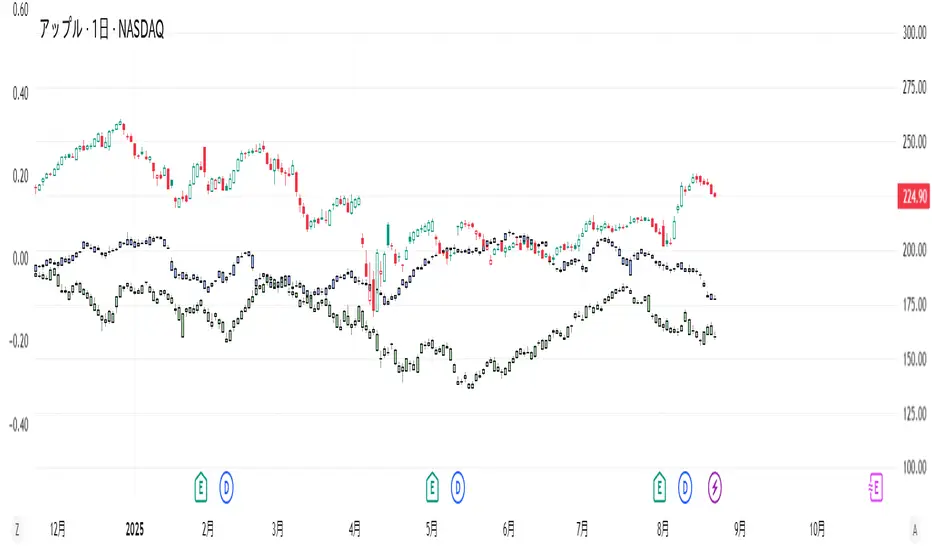
Same Day Past CandlesSame-Day Past Candles
This indicator is a tool that plots the shapes of the candles from the same date one and two years ago directly on the current chart. By visually comparing past price movements, it can help you analyze seasonality and cyclical patterns.
Key Features
Plots Past Candles: Displays candles from the same date one and two years ago on your current chart.
Toggle Visibility: You can individually turn the display of the "1 year ago candle" and "2 years ago candle" on or off in the indicator's settings.
Candle Shape: The open, high, low, and close prices of the past candles are plotted, scaled to the current price range.
How to Use
Add this indicator to a daily chart for best results. The plotted candles are slightly offset upwards so they don't overlap with the current price, making it easier to compare the shape of the past candles with the current chart movement.
Visually checking how specific past price changes are reflected on the same day this year can provide insights for your trading strategy.
I do not speak English at all. Please understand that if you send me a message, I may not be able to reply, or my reply may have a different meaning. Thank you for your understanding.
HTF Candle Extremes Zigzag (Drawn on LTF)HTF Candle Extremes Zigzag (Drawn on LTF)
This indicator plots zigzag lines connecting the extremes (highs and lows) of Higher Timeframe (HTF) candles directly on your lower timeframe (LTF) chart. It visually highlights trend changes and HTF candle structure by drawing colored lines representing uptrends and downtrends based on HTF candle extremes.
"Key Features"
Higher Timeframe Tracking: Select any HTF to track candle extremes using the built-in security function.
Zigzag Lines: Connects HTF candle lows to highs in an intuitive zigzag pattern.
Trend Indication: Uptrend lines are green, downtrend lines are red (customizable colors).
Customizable Line Width: Adjust the thickness of the zigzag lines for better visibility.
Drawn on Lower Timeframe: All lines appear on your active lower timeframe chart, allowing easy visual correlation.
"How It Works"
The script fetches the open, high, low, close, and time data of the specified HTF candle. It detects new HTF bars and identifies trend direction changes by comparing the highs and lows of consecutive HTF candles.
- When an uptrend is detected, vertical lines are drawn from low to high of the HTF candle, connected to the previous extreme low.
- When a downtrend is detected, vertical lines are drawn from high to low, connected to the previous extreme high.
- Transitions between trends are highlighted by connecting the last extreme of the previous trend to the current extreme, creating a clean zigzag pattern.
Usage Notes:
Ideal for traders who want to visualize HTF market structure and trend changes while analyzing price action on lower timeframes.
---
© The_Forex_Steward
(mozilla.org)

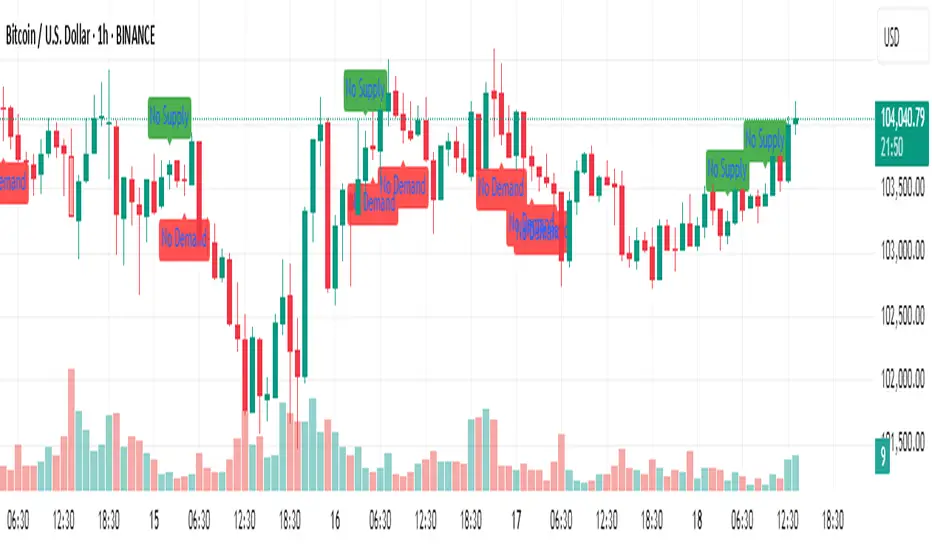
No Supply / No Demand Candle AlertsNo Supply Candle: A No Supply candle generally has a large body (close near high) with low volume. So, you would likely want the body percentage to be high, meaning the price action is concentrated near the high of the candle.
No Demand Candle: A No Demand candle generally has a large body (close near low) with low volume. You would want a high body percentage but with the close near low.
Vacuum Candles [XrayAlgo]The Vacuum Candles indicator helps traders identify inefficient price movements—where the price moves significantly but lacks sufficient volume to support it. These inefficiencies may signal weak trends, potential reversals, or false breakouts/breakdowns.
Inefficient candles are visually marked with a darker / black body to indicate when the price movement is disproportionate to the volume.
1. Spotting Potential Reversals
When the indicator marks an inefficient candle, it signals that the price movement may be unsustainable.
In an uptrend: A inefficient bullish candle suggests that the uptrend is losing momentum, potentially leading to a downward reversal.
In a downtrend: A inefficient bearish candle signals that the downtrend may be weakening, with a potential bullish reversal.
2. Identifying Breakout and Breakdown Failures
This indicator is useful for recognizing false breakouts or false breakdowns.
If price breaks resistance but the candle is inefficient, the breakout may be weak and could fail quickly.
If price breaks support with an inefficient bearish candle, the breakdown could be a false signal, with price reverting back above support.
3. Recognizing Weak Trends
Inefficient candles help you spot when a trend is losing strength and could soon reverse or consolidate.
In an uptrend: A series of dark body bullish candles suggests that the uptrend may be weakening, signaling a potential correction or trend reversal.
In a downtrend: A series of dark body bearish candles suggests that the selling pressure is weakening, indicating a potential bullish reversal.
4. Fine-Tuning Entries and Exits
Inefficient candles offer an opportunity to fine-tune your entries and exits based on weak price moves.
Entering a trade: An inefficient candle near key support or resistance can indicate a reversal, making it a good entry point for a counter-trend position.
Exiting a trade: If you're already in a trend, and an inefficient candle appears, it suggests the trend is losing strength, indicating it may be a good time to exit before a potential reversal.
5. Fine-Tuning with Inputs
The Vacuum Candles indicator includes two key inputs:
Length: The number of candles used to calculate the average price movement and volume. A longer length (e.g., 20-30) smooths out the inefficiencies, while a shorter length (e.g., 10-15) makes the indicator more sensitive to recent price moves.
Multiplier: Controls the threshold for what is considered an inefficient candle:
A higher Multiplier (e.g., 1.5–3) filters out smaller inefficiencies and focuses on large discrepancies.
A lower Multiplier (e.g., 0.1–0.9) captures even smaller inefficiencies in highly efficient markets.

Umesh BC IST 3:30 AM Session Tracker + 4H Candles📌 IST 3:30 AM Session Tracker + 4H Candle Marker
This indicator is designed for traders who follow Indian Standard Time (IST) and want precise session tracking and 4H candle insights.
🔧 Features:
🕒 Daily Session Start at 3:30 AM IST
Automatically detects and marks the beginning of each new trading day based on 3:30 AM IST, not midnight.
Displays session Open, High, and Low lines.
Background shading for each session.
Customizable alert when a new day starts.
🟧 4H Candle Start Markers (IST Time)
Identifies every new 4-hour candle that starts at:
3:30, 7:30, 11:30, 3:30 PM, 7:30 PM, 11:30 PM IST
Adds a vertical line and label ("🟧 4H") above the candle.
Plots a dynamic line for the 4H candle's opening price.
Includes optional alert for new 4H candles.
🔔 Alerts Included:
"🕒 New IST Day Start": Triggers at 3:30 AM IST.
"🟧 New 4H Candle": Triggers at each 4H candle start (IST).
✅ Best for:
Intraday, swing, and institutional traders using IST-based analysis.
Those wanting more accurate daily sessions and clear candle structuring.

fractal candle The fractal candle technical indicator to identify potential trend reversals in financial markets. It works by counting a series of price bars and looking for specific patterns that indicate when a trend is likely to reverse.
How the Indicator Works:
Counting Candles:
The indicator compares the closing price of the current candle with the closing price from 4 candles ago.
If the current close is higher, the bullish (buy) count increases.
If the current close is lower, the bearish (sell) count increases.
When a count reaches 9 or 13, it may signal a trend reversal.
Buy and Sell Setup:
A buy setup occurs when there have been 9 consecutive candles where each close is lower than the close 4 candles before. This suggests a possible bullish reversal.
A sell setup occurs when there have been 9 consecutive candles where each close is higher than the close 4 candles before. This suggests a possible bearish reversal.
Support and Resistance Levels:
The indicator tracks previous highs and lows during buy/sell setups to identify potential support and resistance levels.
These levels can help traders decide where price might reverse or consolidate.
Candle Coloring for Visual Aid:
The script changes candle colors:
Red for sell signals 📉
Green for buy signals 📈
Different shades for overshoot conditions (extended trends)

No wick candlesОпис коду:
Цей скрипт для Pine Script v6 аналізує свічки на графіку і визначає свічки, що не мають фітіля знизу або згори. Він позначає їх відповідними маркерами та змінює колір свічок на помаранчевий для покращення видимості. Цей індикатор допомагає трейдерам ідентифікувати важливі зони на графіку, де свічки мають специфічні риси (без фітіля), і використовується для виявлення потенційних точок для подальших торгівельних рішень.
Що робить цей індикатор:
Зелені свічки без фітіля знизу: Це свічки, у яких ціна відкриття дорівнює мінімуму свічки. Вони позначаються зеленими стрілками під свічкою.
Червоні свічки без фітіля згори: Це свічки, у яких ціна відкриття дорівнює максимуму свічки. Вони позначаються червоними стрілками над свічкою.
Зміна кольору свічок: Свічки, що відповідають умовам (без фітіля знизу або згори), змінюють свій колір на помаранчевий для підвищення видимості та чіткого виділення важливих зон.
Як використовувати:
Цей індикатор допомагає вам ідентифікувати зони, де ціна не має фітіля знизу (для зелених свічок) або згори (для червоних свічок). Ці свічки можуть бути важливими для трейдерів, оскільки вони часто сигналізують про сильні рівні підтримки або опору, де ймовірно відбудеться ретест.
Важливо:
Чекати ретест зони: Після появи таких свічок (особливо у зонах підтримки або опору) можна очікувати, що ці рівні будуть перевірені ще раз. Якщо ціни повертаються до цих зон, це може бути сигналом для входу в ринок.
Торгівля на ретестах: Якщо ціна після першого відскоку знову наближається до цієї зони (де була свічка без фітіля), можна очікувати відскок або продовження тренду, що створює можливість для вхідної позиції.
_______________________________
Description:
This Pine Script v6 indicator analyzes the candles on the chart and identifies those that have no lower or upper wicks. It marks these candles with appropriate markers and changes the candle colors to orange for better visibility. This indicator helps traders identify important zones on the chart where candles exhibit specific characteristics (no wicks), which can be used to spot potential trading opportunities.
What this indicator does:
Green candles with no lower wick: These are candles where the opening price equals the low of the candle. They are marked with a green arrow below the candle.
Red candles with no upper wick: These are candles where the opening price equals the high of the candle. They are marked with a red arrow above the candle.
Candle color change: Candles that meet the conditions (no lower or upper wick) change their color to orange for better visibility and to clearly highlight important zones.
How to use:
This indicator helps you identify zones where prices have no lower wick (for green candles) or no upper wick (for red candles). These candles may be important for traders, as they often indicate strong support or resistance levels where a retest is likely to occur.
Important:
Wait for a zone retest: After these candles appear (especially at support or resistance zones), you can expect these levels to be tested again. If the price returns to these zones, it could signal an opportunity to enter the market.
Trading on retests: If the price approaches the zone (where a wickless candle occurred) again, it may indicate a bounce or trend continuation, which provides a potential entry point.

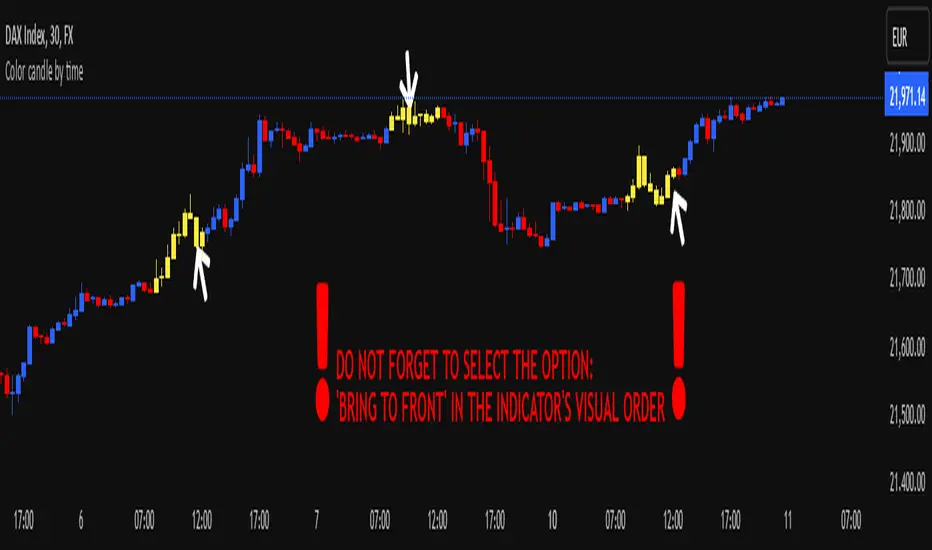
Color candle by time
This indicator, written in Pine Script v5, allows you to highlight candles (using a user-selected color) that fall within a user-defined time range. Candles outside this range maintain their original appearance.
How it Works and Key Benefits:
- Time Interval Customization: By specifying start and end hours/minutes, you can emphasize only the desired market session.
- Choice of Preferred Color: The body, wicks, and borders of the candles within the selected range are uniformly colored, based on the user’s chosen tone.
- Enhanced Focus on Price Action: By focusing on the most relevant trading hours, your analysis becomes more streamlined and intuitive, without altering the rest of the session’s candle appearance.
!! DO NOT FORGET TO SELECT THE OPTION: 'BRING TO FRONT' IN THE INDICATOR'S VISUAL ORDER !!
Buy&Sell Hollow CandlesThe Hollow Candles Script is a type of candlestick analysis script designed to highlight the following:
Purpose of the Script: This script provides the user with buy and sell signals based on candlesticks that show an upward or downward reversal.
Mechanism of the Script: When a hollow (unfilled) red candle appears, it signals a potential entry, provided that this candle is at a low point, following a series of red candles with higher volume than previous days. Similarly, it gives a sell signal when a green candle appears at a peak with high sell volume surpassing that of prior days. However, the appearance of these candles alone should not prompt an immediate buy or sell; you should wait for a confirming candle to validate the signal.
Sideways Movement Caution: If these signals appear during a sideways or flat trend, it is not advisable to proceed with buying or selling.
Chart Insights: The chart demonstrates certain buy and sell operations along with some non-ideal signals where decision-making should be based on fundamental analytical experience.

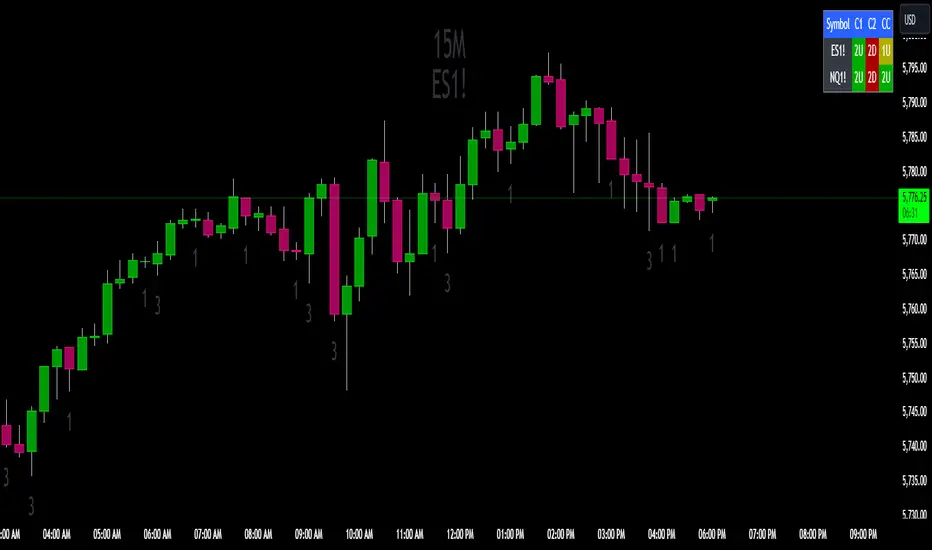
The Strat Candle State Table (Two Symbols)The Strat Candle State Table (Two Symbols) – Multi-Timeframe Analysis
This advanced indicator is designed for traders who follow The Strat methodology, providing a quick, clear, and actionable view of candle states across two selected symbols and a chosen timeframe. It allows you to seamlessly integrate multi-symbol analysis into your trading, offering real-time insights into price action and market momentum based on **The Strat’s** powerful principles.
What It Does:
For each selected symbol, the indicator retrieves and analyzes the price data for three candles:
- Candle 1 (C1): The third candle from the current one.
- Candle 2 (C2): The candle directly before the current one (previous candle).
- Current Candle (CC): The live candle, which is still forming.
Using this information, it plots the Scenario 1 (Inside Bar), Scenario 2 (Directional), and **Scenario 3 (Outside Bar)** states for each candle, color-coding them to help you quickly assess market conditions and price action.
Strat Candle States:
- Scenario 1 (Inside Bar): The candle stays within the high and low of the previous candle (indicating consolidation or indecision).
- Scenario 2 (Directional)* The candle breaks either the high (2-up) or low (2-down) of the previous candle, indicating potential continuation in that direction.
- Scenario 3 (Outside Bar): The candle breaks both the high and low of the previous candle, signaling increased volatility and a potential reversal.
Customizable Color Scheme:
The default colors follow these settings (but can be changed to your preference):
- 1U (Inside and Up): Yellow (indicating an inside bar that closed higher).
- 1D (Inside and Down): Orange (indicating an inside bar that closed lower).
- 2U (Two Up): Green if the candle closes higher, Red if the candle closes lower (conflict).
- 2D (Two Down): Red if the candle closes lower, Green if the candle closes higher (conflict).
- 3U (Three Up): Lighter Purple.
- 3D (Three Down): Darker Purple/Magenta.
Each state is dynamically updated based on the actual price action and whether the candle closes above or below the open. Conflict candles (like a 2-up closing red or 2-down closing green) are highlighted, making it easier to spot potential reversals or weakness in the trend.
Timeframe Flexibility:
You can overlay this indicator on any chart regardless of the timeframe. The key is to select the timeframe you want the indicator to plot for when setting up. Whether you're working on a 5-minute chart, daily, or even weekly, the indicator will analyze the candles according to the selected timeframe, giving you the versatility to adapt it to various trading strategies.
Powerful Use Cases:
1. Multi-Symbol Analysis in Real-Time: The Strat Candle State Table displays the candle states for two symbols at once, helping you track multiple instruments without switching charts. This is extremely useful when monitoring correlated assets like SPY and QQQ, or sector-related pairs such as DIA and IWM
2. Seamless Top-Down View: By analyzing the three most recent candles (C1, C2, and the current candle), the indicator allows you to maintain a top-down perspective on price action, spotting setups early and tracking candle state changes across different symbols and timeframes.
3. Enhanced Conflict Detection: The background shading automatically adjusts for conflict candles, such as a 2-up that closes red or a 2-down that closes green. This provides a quick visual cue to warn you when the current trend may be weakening or reversing.
4. Trade Execution Precision: With this table providing constant feedback on price action and candle state, traders can more easily time their entries and exits, whether they are looking for reversals or continuations
5. Focus on Timeframe Continuity: Use this indicator to stay in alignment with The Strat's Timeframe Continuity, ensuring you are trading in the direction of the most aligned candles, across both symbols. This allows for more precise trade management and higher-probability setups.
6. Customizable to Your Strategy: Change the color coding and candle states to match your personal preferences or trading strategy, making this indicator adaptable to your specific needs.
Most Powerful Use Case – Simultaneous Break Detection:
The Strat Candle State Table shines in setups where simultaneous breaks are being monitored across multiple symbols. For example, if both symbols trigger a 2-up or 3-up at the same time, this confirms that momentum is flowing in the same direction for multiple instruments, giving you stronger trade conviction.
By seeing real-time data for two key symbols, you can ensure that you're catching simultaneous breaks, where multiple instruments are signaling the same move. This can be especially effective in index-based trading, where the strength or weakness of multiple sectors or assets must align for a higher probability of success
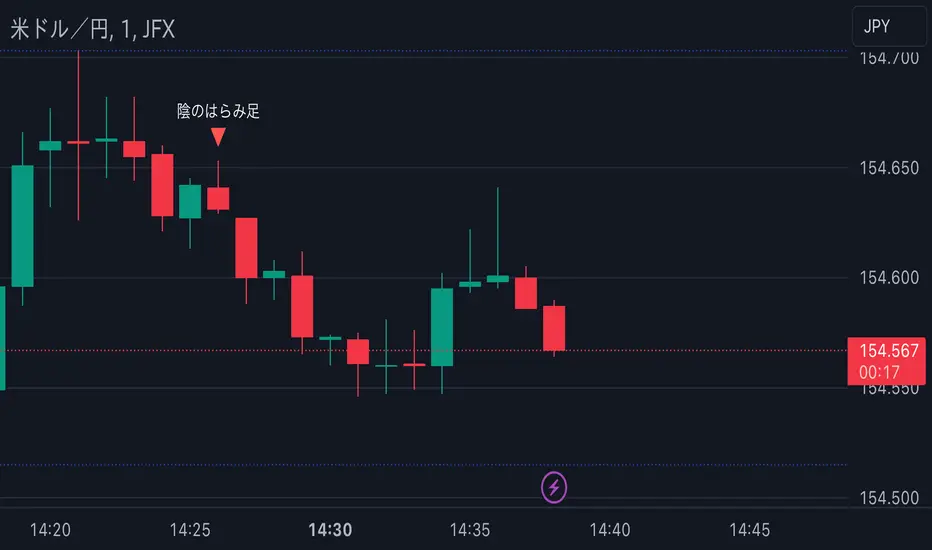
Candlestick Reversal SignalsTitle: Candlestick Reversal Signals
This Pine Script indicator is designed to identify and plot signals for two key candlestick reversal patterns: Bullish and Bearish Engulfing patterns, as well as Bullish and Bearish Harami patterns. These patterns are widely recognized for their ability to indicate potential trend reversals in the market, providing traders with valuable insights for making informed trading decisions.
Features:
• Bullish Engulfing Pattern:
• Conditions: This pattern is identified when the current candle’s close is higher than the previous candle’s open, and the current candle’s open is lower than the previous candle’s close. Additionally, the current candle’s close must be higher than the previous candle’s close, and the current candle’s open must be lower than the previous candle’s open.
• Signal: When a Bullish Engulfing pattern is detected, a green label is plotted below the relevant bar, indicating a potential upward reversal.
• Bearish Engulfing Pattern:
• Conditions: This pattern is identified when the current candle’s close is lower than the previous candle’s open, and the current candle’s open is higher than the previous candle’s close. Additionally, the current candle’s close must be lower than the previous candle’s close, and the current candle’s open must be higher than the previous candle’s open.
• Signal: When a Bearish Engulfing pattern is detected, a red label is plotted above the relevant bar, indicating a potential downward reversal.
• Bullish Harami Pattern:
• Conditions: This pattern is identified when the previous candle is a bearish candle (open higher than close), and the current candle is a bullish candle (close higher than open) that is contained within the body of the previous bearish candle.
• Signal: When a Bullish Harami pattern is detected, a green label is plotted below the relevant bar, indicating a potential upward reversal.
• Bearish Harami Pattern:
• Conditions: This pattern is identified when the previous candle is a bullish candle (open lower than close), and the current candle is a bearish candle (close lower than open) that is contained within the body of the previous bullish candle.
• Signal: When a Bearish Harami pattern is detected, a red label is plotted above the relevant bar, indicating a potential downward reversal.
Usage:
To use this script, simply add it to your TradingView chart. The script will automatically highlight the Bullish and Bearish Engulfing patterns, as well as Bullish and Bearish Harami patterns, by plotting green and red labels on the chart. These visual signals make it easy to spot potential reversal points, helping traders to identify and capitalize on trading opportunities.
Example:
• When you see a green “Bullish Engulfing” label below a candlestick, it suggests that the market might reverse upwards, signaling a potential buy opportunity.
• Conversely, a red “Bearish Engulfing” label above a candlestick suggests a potential downward reversal, signaling a potential sell opportunity.
• A green “Bullish Harami” label below a candlestick also indicates a potential upward reversal.
• A red “Bearish Harami” label above a candlestick indicates a potential downward reversal.
This indicator is a valuable addition to any trader’s technical analysis toolkit, providing clear and actionable signals based on well-established candlestick patterns. By incorporating these reversal patterns into your analysis, you can enhance your trading strategy and improve your decision-making process.
Red Candles with Green Precedent
**Title**: Red Candles with Green Precedent Indicator
**Description**:
This TradingView indicator is designed to help traders identify potential reversal or continuation patterns based on the appearance of consecutive red candles following a green candle. The script marks a region starting from a green candle that precedes at least four consecutive red candles, extending a box forward for a predefined number of bars to analyze the continuation of the trend.
**Key Features**:
- **Consecutive Red Candles Detection**: The indicator counts consecutive red candles that close lower than they open.
- **Initial Green Candle Identification**: Identifies the last green candle before a series of red candles begins. This green candle must close higher than it opens.
- **Visual Box Extension**: Creates a visual box from the open to the high of the green candle and extends it forward to highlight the period of interest.
- **Dynamic Box Termination**: Optionally terminates the box early if a significant green candle appears within the extension period, suggesting a potential reversal.
**Usage**:
1. **Setup**: Apply the indicator to any chart in TradingView. Adjust the number of consecutive red candles to track based on your trading strategy.
2. **Interpretation**: A visual green box will appear when the criteria are met. This box helps focus on the price action following a potentially significant green candle. Traders should watch for price actions within and around the box to make informed decisions.
3. **Alerts**: Consider setting alerts for when a new box is created or when a significant green candle forms that might terminate the box early, indicating potential market movements.
**Suitable for**: This indicator is suitable for traders looking for visual cues about potential bearish exhaustion or the setup for a bullish reversal, particularly in volatile markets.
---
Feel free to customize the description and features according to any additional details or personal insights you might want to include based on your trading experience or the specific behaviors of the markets you track.
**Disclaimer**:
This script is provided as a tool for trading analysis and is not intended to be used as the sole basis for any trading decisions. While this indicator aims to identify potential trading opportunities, its effectiveness can depend on market conditions and individual trading strategies. Users should conduct their own research and consult with professional advisors before making any investment decisions. The creator of this script assumes no responsibility for any potential financial losses incurred from using this indicator. Trading in financial markets involves risk, and it is possible to lose more than your initial investment.
---

Pump and Dump CandlesDescription:
The Pump and Dump Candles indicator is a robust tool designed to assist traders in identifying potential pump and dump scenarios within the financial markets. This innovative indicator combines key elements of price action and volatility to provide valuable insights into market manipulations and potential risks. This indicator uses ATR to standardize candle sizes as they vary across different assets and timeframes; by using a percentage of the ATR, you can adjust the threshold dynamically based on the volatility of each asset.
Features:
- Pump/dump candles: Candle bars are colored green when it is pumping and red when it is dumping.
- Pump/dump rallies: The background turns green during sequences of consecutive pumping candles and red in the presence of sustained dumping.
- Candle Size Percentage: Users have the flexibility to define a personalized percentage for calculating candle size.
- Wick Exclusion: This option factors in pump and dump candles with substantial body sizes, mitigating the impact of bars with large wicks and smaller candle bodies.
( These inputs can all be modified within the indicator settings )
Utility:
Understanding pump and dump candles and rallies can be a valuable asset for traders seeking to navigate volatile markets effectively. By closely monitoring the color-coded indicators that highlight pumping and dumping phases, traders gain insights into abrupt and often exaggerated price movements. This information aids in identifying potential short-term trends and anticipating market reversals. Pump and dump rallies, signaled by consecutive pumping or dumping candles, provide a visual representation of sustained buying or selling pressure, allowing traders to assess the strength and duration of market sentiment. Armed with this knowledge, traders can make informed decisions, implement risk management strategies, and capitalize on short-term opportunities, thereby enhancing their overall trading proficiency in dynamic market conditions.

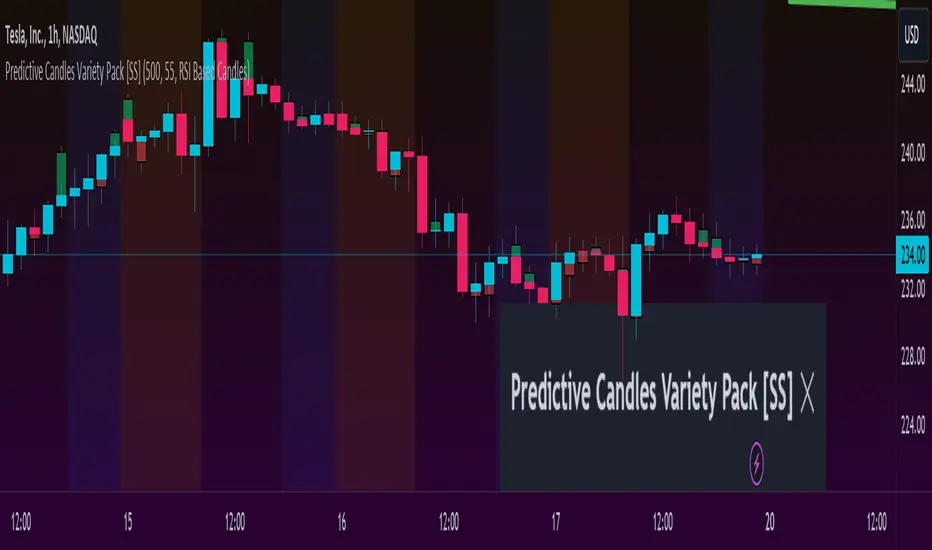
Predictive Candles Variety Pack [SS]This indicator provides you with the ability to select from a variety of candle prediction methods.
It permits for:
👉 Traditional Linear Regression Candle Predictions
👉 Candle Predictions based on the underlying Stochastics
👉 Candle Predictions based on the underlying RSI
👉 Candle Predictions based on the underlying MFI
👉 Candle Predictions based on the EMA 9
👉 Candle Predictions based on ARIMA modelling
Which is best?
Each method serves its unique purpose.
Here are some general tips of which candles are better suited for what:
🎯Trend Following🎯
For Trend following, the EMA 9 would be an appropriate choice of candle as it helps you to identify the current trend and potential early pullbacks/reversals.
🎯Momentum Following🎯
Momentum following is best carried out with the Stochastics Candles.
🎯Pullback Determination🎯
Pullback Determination is best accomplished through the RSI candles, as the ranges compress or expand based on the current state of oversold/overboughtness.
🎯Detrended Range🎯
To see the detrended range of where the ticker should be falling, absent the trendy noise, it's best to use the ARIMA candles.
Other Features
👉 Other features include a Backtest option that can be toggled on or off and will backtest over the length of the assessment. I don't recommend leaving it on as it can be resource-heavy on Pinescript though.
👉 The ability to adjust the transparency of the candles if you want them to be more or less visible.
Troubleshooting Note
The ARIMA modeling version is extremely resource-heavy, as it has to fully develop an ARIMA model. I have tried to optimize it by reducing the lagged assessment to just 2 lags. If you are using a free or non-premium membership, you may need to reduce the length of the assessment.
And that's it! Pretty straightforward indicator.
Hope you enjoy it!
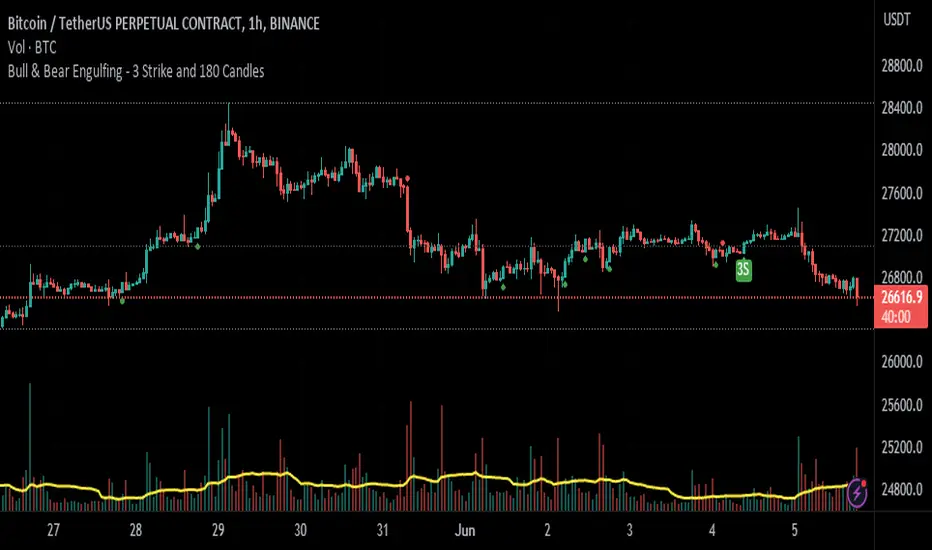
Bull & Bear Engulfing - 3 Strike and 180 CandlesHello, SenatorVonShaft here.
This indicator shows 3 differend candlestick formations:
1- Bullish & Bearish Engulfing Candle
2- Bullish & Bearish 3 Strike Candle
3- Bullish & Bearish 180 Degree Candle
It has 3 variables
1- Bar Fullness - Differs from %50 - %100 showing 1 candle's fullness
2- Avg. Backwds Candls - Gets the average weight of the backward candles
3- Avg. Bar Height Multiplier - This variable is multiplied by above value to determine engulfing candles.
Plots:
- Green & Red Arrows Only : Shows Bullish & Bearish engulfing candles
- Green & Red 180 : Shows a bullish or bearish engulfing candle taken over by a bigger opposite candle
- Green & Red 3S : Shows bullish & bearish 3 strike candle formation
Please feel free to comment your thoughts below.
See you.
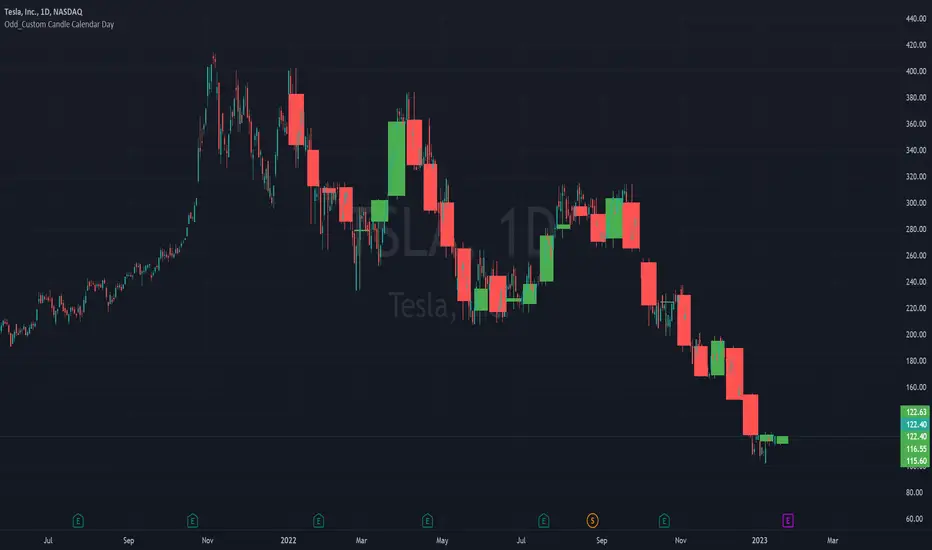
Odd_Custom Candle Calendar DayEver wonder how candles would look on a chart if they were tracked by calendar day instead of market days?
Option(s)-
📅Custom start date for candle formation
✖️Candle multiplier
🌈Up / Down Colors
Features-
📋Displays candle data with invisible plots
Use Move to Existing Pane to Overlay on chart.
Can only display a max of 500 candles!
Session candles & reversals / Flowly Indicators— Overview
Like traditional candles, session based candles are a visualization of open, high, low and close values, but based on session time periods instead of typical timeframes such as daily or weekly. Session candles are formed by fetching price at session start (open), highest price during session (high), lowest price during session (low) and price at session end (close). On top of candles, session based moving average is formed and session reversals detected. Session reversals are also backtested, using win rate and magnitude metrics to better understand what to expect from session reversals and which ones have historically performed the best.
By default, following session time periods are used:
Session #1: London (08:00 - 17:00, UTC)
Session #2: New York (13:00 - 22:00, UTC)
Session #3: Sydney (21:00 - 06:00, UTC)
Session #4: Tokyo (00:00 - 09:00, UTC)
Session time periods can be changed via input menu.
— Reversals
Session reversals are patterns that show a rapid change in direction during session. These formations are more familiarly known as wicks or engulfing candles. Following criteria must be met to qualify as a session reversal:
Wick up:
Lower high, lower low, close >= 65% of session range (0% being the very low, 100% being the very high) and open >= 40% of session range.
Wick down:
Higher high, higher low, close <= 35% of session range and open <= 60% of session range.
Engulfing up:
Higher high, lower low, close >= 65% of session range.
Engulfing down:
Higher high, lower low, close <= 35% of session range.
Session reversals are always based on prior corresponding session , e.g. to qualify as a NY session engulfing up, NY session must have a higher high and lower low relative to prior NY session , not just any session that has taken place in between. Session reversals should be viewed the same way wicks/engulfing formations are viewed on traditional timeframe based candles. Essentially, wick reversals (light green/red labels) tell you most of the motion during session was reversed. Engulfing reversals (dark green/red labels) on the other hand tell you all of the motion was reversed and new direction set.
— Backtesting
Session reversals are backtested using win rate and magnitude metrics. A session reversal is considered successful when next corresponding session closes higher/lower than session reversal close . Win rate is formed by dividing successful session reversal count with total reversal count, e.g. 5 successful reversals up / 10 reversals up total = 50% win rate. Win rate tells us what are the odds (historically) of session reversal producing a clean supporting move that was persistent enough to close that way too.
When a session reversal is successful, its magnitude is measured using percentage increase/decrease from session reversal close to next corresponding session high/low . If NY session closes higher than prior NY session that was a reversal up, the percentage increase from prior session close (reversal close) to current session high is measured. If NY session closes lower than prior NY session that was a reversal down, the percentage decrease from prior session close to current session low is measured.
Average magnitude is formed by dividing all percentage increases/decreases with total reversal count, e.g. 10 total reversals up with 1% increase each -> 10% net increase from all reversals -> 10% total increase / 10 total reversals up = 1% average magnitude. Magnitude metric supports win rate by indicating the depth of successful session reversal moves.
To better understand the backtesting calculations and more importantly to verify their validity, backtesting visuals for each session can be plotted on the chart:
All backtesting results are shown in the backtesting panel on top right corner, with highest win rates and magnitude metrics for both reversals up and down marked separately. Note that past performance is not a guarantee of future performance and session reversals as they are should not be viewed as a complete strategy for long/short plays. Always make sure reversal count is sufficient to draw reliable conclusions of performance.
— Session moving average
Users can form a session based moving average with their preferred smoothing method (SMA , EMA , HMA , WMA , RMA) and length, as well as choose which sessions to include in the moving average. For example, a moving average based on New York and Tokyo sessions can be formed, leaving London and Sydney completely out of the calculation.
— Visuals
By default, script hides your candles/bars, although in the case of candles borders will still be visible. Switching to bars/line will make your regular chart visuals 100% hidden. This setting can be turned off via input menu. As some sessions overlap, each session candle can be separately offsetted forward, clearing the overlaps. Users can also choose which session candles to show/hide.
Session periods can be highlighted on the chart as a background color, applicable to only session candles that are activated. By default, session reversals are referred to as L (London), N (New York), S (Sydney) and T (Tokyo) in both reversal labels and backtesting table. By toggling on "Numerize sessions", these will be replaced with 1, 2, 3 and 4. This will be helpful when using a custom session that isn't any of the above.
Visual settings example:
Session candles are plotted in two formats, using boxes and lines as well as plotcandle() function. Session candles constructed using boxes and lines will be clear and much easier on the eyes, but will apply only to first 500 bars due to Tradingview related limitations. Rest of the session candles go back indefinitely, but won't be as clean:
All colors can be customized via input menu.
— Timeframe & session time period considerations
As a rule of thumb, session candles should be used on timeframes at or below 1H, as higher timeframes might not match with session period start/end, leading to incorrect plots. Using 1 hour timeframe will bring optimal results as greatest amount historical data is available without sacrificing accuracy of OHLC values. If you are using a custom session that is not based on hourly period (e.g. 08:00 - 15:00 vs. 08.00 - 15.15) make sure you are using a timeframe that allows correct plots.
Session time periods applied by default are rough estimates and might be out of bounds on some charts, like NYSE listed equities. This is rarely a problem on assets that have extensive trading hours, like futures or cryptocurrency. If a session is out of bounds (asset isn't traded during the set session time period) the script won't plot given session candle and its backtesting metrics will be NA. This can be fixed by changing the session time periods to match with given asset trading hours, although you will have to consider whether or not this defeats the purpose of having candles based on sessions.
— Practical guide
Whether based on traditional timeframes or sessions, reversals should always be considered as only one piece of evidence of price turning. Never react to them without considering other factors that might support the thesis, such as levels and multi-timeframe analysis. In short, same basic charting principles apply with session candles that apply with normal candles. Use discretion.
Example #1 : Focusing efforts on session reversals at distinct support/resistance levels
A reversal against a level holds more value than a reversal by itself, as you know it's a placement where liquidity can be expected. A reversal serves as a confirming reaction for this expectation.
Example #2 : Focusing efforts on highest performing reversals and avoiding poorly performing ones
As you have data backed evidence of session reversal performance, it makes sense to focus your efforts on the ones that perform best. If some session reversal is clearly performing poorly, you would want to avoid it, since there's nothing backing up its validity.
Example #3 : Reversal clusters
Two is better than one, three is better than two and so on. If there are rapid changes in direction within multiple sessions consecutively, there's heavier evidence of a dynamic shift in price. In such case, it makes sense to hold more confidence in price halting/turning.

Pro Trading Art - Candlestick Patterns with alertAll candlestick pattern based on "Japanese candlestick charting techniques".
Currently Supported List of Candlestick Patterns :
Hammer
Hanging Man
Inverted Hammer
Shooting Star
Morning Star
Evening Star
Bullish Engulfing
Bearish Engulfing
Important Points:
1. You can create alert for all patterns.
2. You can modify multiplier(Length Of Shadow) for Hammer, Hanging Man, Inverted Hammer and Shooting Star
3. You can modify EMA length for upward and downward validation of any pattern.

((Bullish)) Candle below EMA Hello People of the Trading World...
Todays script is a basic concept of using Moving Averages and Candle Closes - this works best on Higher Timeframes and only in Bullish Conditions
"When the market is trending to the upside - we tend to see price overextend from the moving average and price revert back to the mean (Mean Reversion)"
You may ask why would you want this candle - this presents good opportunities in a trending market (NOT AN ENTRY CANDLE). This can be useful to get into existing trends which you may have missed
This candle will display when the candle close is below one of the below EMAS
9EMA
50EMA
100EMA
You can choose which one to show ie if the 21ema wasnt important but the 100ema was... turn off the 21ema and 50ema and this will display candle below the 100ema
This candle can be alerted in the settings so if price does close you wont miss it.
EXMAPLES:
If you find this script useful please leave a comment and a thumbs up :)

Better Heiken-Ashi Candles w/ Expanded Source Types [Loxx]Better Heiken-Ashi Candles w/ Expanded Source Types is an indicator to compare regular candles to traditional Heiken-Ashi candles to "better" Heiken Ashi candles. This indicator and comparison study appears an oscillator. The purpose of this indicator is to demonstrate a better way to calculate HA candles and also to demonstrate expanded source types. This indicator is meant to be used by advanced Pine Coders who wish to add fine-tuning to their indicators and strategies.
What are Heiken Ashi "better" candles?
The "better formula" was proposed in an article/memo by BNP-Paribas (In Warrants & Zertifikate, No. 8, August 2004 (a monthly German magazine published by BNP Paribas, Frankfurt), there is an article by Sebastian Schmidt about further development (smoothing) of Heikin-Ashi chart.)
They proposed to use the following :
(Open+Close)/2+(((Close-Open)/(High-Low))*ABS((Close-Open)/2))
instead of using :
haClose = (O+H+L+C)/4
According to that document the HA representation using their proposed formula is better than the traditional formula.
What are traditional Heiken-Ashi candles?
The Heikin-Ashi technique averages price data to create a Japanese candlestick chart that filters out market noise.
Heikin-Ashi charts, developed by Munehisa Homma in the 1700s, share some characteristics with standard candlestick charts but differ based on the values used to create each candle. Instead of using the open, high, low, and close like standard candlestick charts, the Heikin-Ashi technique uses a modified formula based on two-period averages. This gives the chart a smoother appearance, making it easier to spots trends and reversals, but also obscures gaps and some price data.
What's going on with this indicator?
- First, we have the options to select the candlestick type: Regular, HA, HA Better
- Next, and to demonstrate the expanded source types, I've added a simple moving average. In the drop down for the SMA source you'll notice something very different from the typical TradingView source selector. Here's how to decode the new names for the sources:
Close = close
Open = open
High = high
Low = low
Median = hl2
Typical = hlc3
Weighted = hlcc4
Average = ohlc4
Average Median Body = (open+close)/2
Trend Biased = (see code, too complex to explain here)
Trend Biased (extreme) = (see code, too complex to explain here)
... for HA and HA better, see the same set up as above but with different open and close values to calcualate the other source types
- For the HA better calculations, we run the close value through either an Adaptive, Kaufman, or T3 smoothing filter. The length for these smoothing filters, either 2 or 3, can be found in the code and is a constant value that shouldn't be changed. This smoothing is in inline with what is described in the article mentioned above
- Lastly, I've placed an SMA over the oscillator so that the user can test out the various sources explained above
Included:
- Toggle on/off bar coloring

Supply and Demand - Order Block - Energy CandlesSupply and Demand - Order Block - Energy Candles
Description
An experimental script, designed as a visual aid, to highlight the last up or down candle before a fractal break. We can assume these candles where the point of origin that generated enough strength to break recent structure. By using them as reference points, traders are expected to follow their own set of rules and mark higher probability supply and demand zones in the area.
How to use:
Expect a potential retest in these areas, and if they fail, a potential retest in the opposite direction. The greater the number of times a zone is tested, the more likely it is to break. A fresh zone that has not yet been tested will have a higher probability of a bounce.
Fractal period and candle break type can be personalised in settings. Can be used on all timeframes (higher the better).
Indicator in use:
Extras:
An option to flip candle colours if current price is above or below them has been added.
