First Candle Range (FCR) Gold Strategy - EtubersThe 18:00 (6:00 PM) candle is widely used by traders in the Forex and Futures markets because it marks the New York market rollover and the start of the Asian session.
How the Strategy Works:
- The Range: The High and Low prices of the 1-hour candle (18:00–19:00) create a "Supply and Demand" zone.
- The Breakout: A candle closing above the high signals a bullish breakout; a candle closing below the low signals a bearish breakout.
- Institutional Memory: By extending this zone forward for 4 days, traders can identify where "old" 18:00 levels act as support or resistance in the future.
- Execution: Traders often wait for a breakout followed by a "retest" of the box boundary to enter a high-probability trade.
Cerca negli script per "candle"

EMA 5/9 Angle + Candle Strength (SL=Open, TP=RR)EMA 5 / EMA 9 cross
Cross must have ~30° angle (approximated using slope → atan)
Entry candle must be bullish/bearish and also be Normal / 2nd Most / Most based on body-size percentile
Entry = close of signal candle
SL = open of signal candle
TP = 1:2 RR (editable input)


SYXX - HTF Candle Overlay
This script, titled "HTF Candle Overlay by SYXX," is designed to visualize the full range and structure of a higher-timeframe (HTF) candle directly onto a lower-timeframe chart. It helps traders maintain context by showing where the current price action sits relative to a much larger candle's boundaries. Combined with LuxAlgo Volume Node Profile.
1. 🔍 Primary Feature: Higher Timeframe Candle Projection
Configurable Timeframe: The user sets the desired HTF using the Interval input, which defaults to 'D' (Daily). The indicator then tracks the High, Low, Open, and Close of that HTF bar.
Live and Historical Drawing: The script uses box.new to draw boxes representing the candle's full range (High to Low).
Historical Boxes (if changeHTF): When a new HTF candle closes, the completed box for the previous period is drawn.
Live Box (if barstate.islast): The indicator draws a live, dynamic box for the current, incomplete HTF candle, which expands with every new High or Low on the lower chart.
2. 🎨 Visualization & Customization
Color-Coded Bias: The boxes are colored based on the HTF candle's direction:
Bullish/Long (BgLong): Green color is used if the HTF candle closed higher than it opened (close > htfOpen).
Bearish/Short (BgShort): Red color is used if the HTF candle closed lower than it opened.
Box Styling: Users can customize the box's appearance, including border color and style, border thickness, and background opacity (BoxOpacity).
Midline: An optional MidLine is calculated as the average of the HTF High and Low, acting as a potential support/resistance reference point.
Range Display: The indicator can display the range of the box in pips (BoxRangePips) or the percentage of movement relative to the full range (BoxRangePercentage).
Time Labels: It plots time labels that show the start and end time of the completed HTF period (e.g., "07:00 - 11:00").
3. 🚨 Alert System (Placeholders)
The script includes placeholder inputs for standard trading alerts, though the internal logic for checking these conditions is currently commented out or set to false:
Alert: Break Above/Below Box: To signal a breakout of the HTF High or Low.
Alert: Price Re-Enters Box: To signal a pullback back into the range.

AI Candlestick Pattern Identifier — Arrows & AlertsAI shows you high confidence candlestick patterns so that you can identify them quickly. Buy/Sell arrows will be placed alongside the pattern to alert you of which direction the indicator believes the market will go, as well as showing you the confidence in that indicator.

ATR-BHEEM-NOCHANGE-CANDLESCandles remain normal — removed barcolor(barCol)
ATR trailing stop line still shows trend direction (green/red)
Optional buy/sell labels added only when trend flips
Clean and ready for intraday 1-min charts

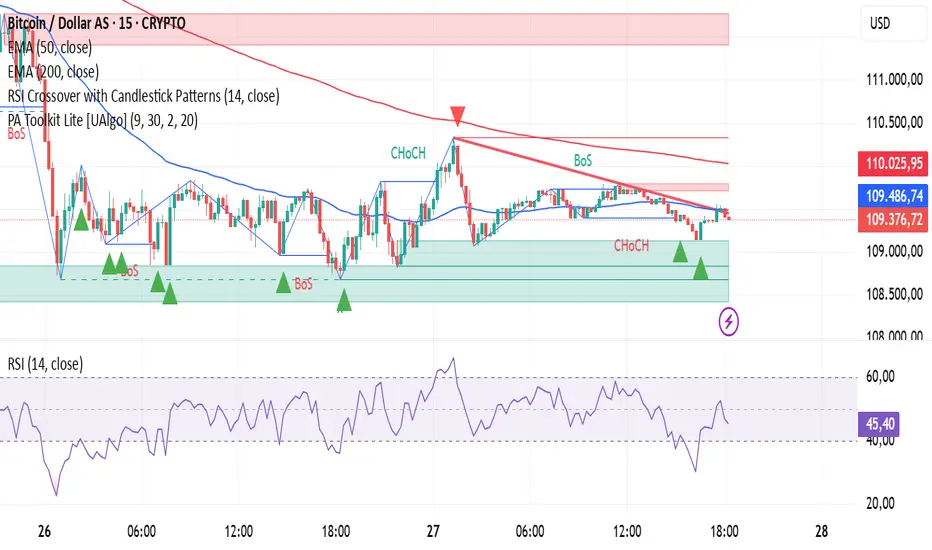
RSI Crossover with Candlestick Patternsusing the RSI indicator levels 40 and 60, where the signal cuts above level 40 with a candlestick hammer or bull engulfing and cuts below level 60 with a candlestick inverter hammer or bearish engulfing.
Alert N seconds before candle closeThe indicator alerts about the closing of the candle in N seconds.
Instruction:
1. Add an indicator
2. Specify the time in the indicator settings
3. Alt+A, Condition - choose indicator

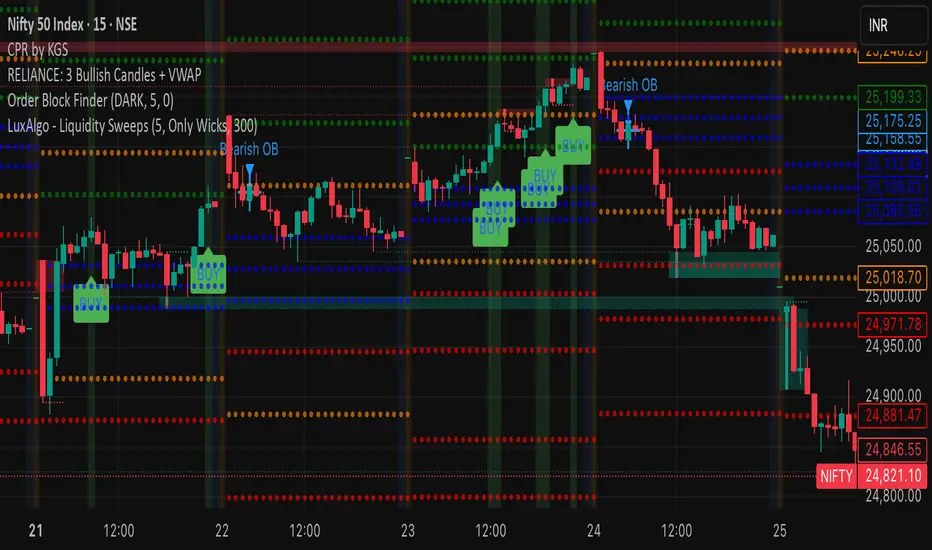
RELIANCE: 3 Bullish Candles + VWAPIts a script to track 3 consecutive candles of any stock. This helps understand the trends and makes up for buy signals. Please test before buying.
Previous Candle High/Low (Clean)✅ Creates one horizontal line for the previous candle’s high (green).
✅ Creates one horizontal line for the previous candle’s low (red).
✅ The lines update on each new candle, always following the most recent previous high/low.
✅ The lines are extended to the right — they don’t stack or clutter the chart.
✅ Works on all timeframes.

Internal Candle Strength [LuxAlgo]The Internal Candle Strength tool allows traders to divide each chart bar into multiple rows of custom size and inspect the strength of the lower timeframes trends located within each row.
This tool effectively helps traders in identifying the power dynamic between bulls and bears within multiple areas within each bar, providing the ability to conduct LTF analysis.
🔶 USAGE
The strength displayed within each row ranges from 0% to 100%, with 0% being the most bearish and 100% being the most bullish.
Traders should be aware of the extreme probabilities located at the higher/lower end of the bars, as this can signal a change in strength and price direction.
Traders can select the lower timeframe to pull the data from or the row size in the scale of the chart. Selecting a lower timeframe will provide more data to evaluate an area's strength.
Do note that only a timeframe lower than the chart timeframe should be selected.
🔹 Row Size
Selecting a smaller row size will increase the number of rows per bar, allowing for a more detailed analysis. A lower value will also generally mean that less data will be considered when calculating the strength of a specific area.
As we can see on the chart above (all BTCUSD 30m), by selecting a different row size, traders can control how many rows are displayed per bar.
🔶 SETTINGS
Timeframe: Lower timeframe used to calculate the candle strength.
Row Size: Size of each row on the chart scale, expressed as a fraction of the candle range.

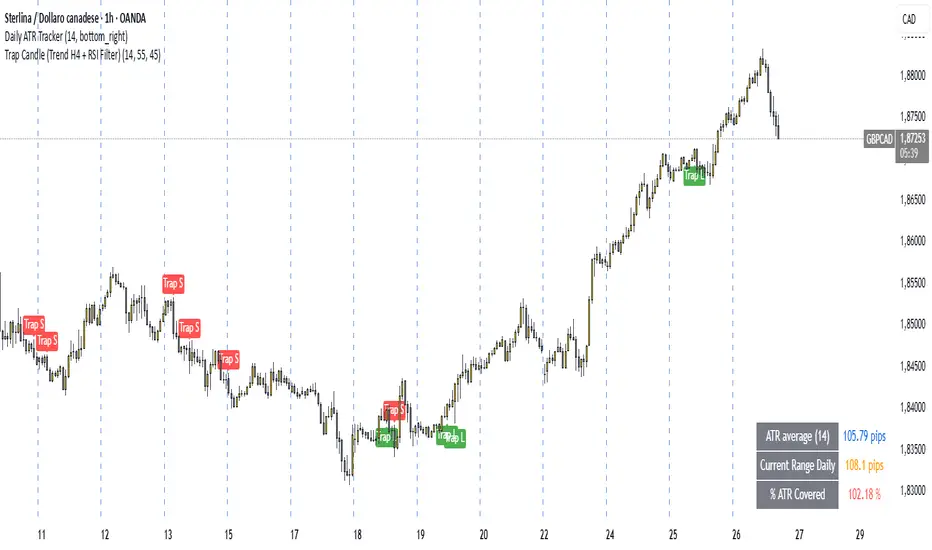
Trap Candle (Trend H4 + RSI Filter)🔍 Trap Candle (Trend H4 + RSI Filter)
Description:
The Trap Candle indicator is designed to identify a specific and powerful two-candle price action pattern that often signals a false breakout followed by a strong reversal. It combines pure price action with two objective filters to increase signal quality and trend alignment.
📊 Pattern Logic:
Bullish Trap: The current candle breaks the previous candle’s low, but closes above its high (and is bullish).
Bearish Trap: The current candle breaks the previous candle’s high, but closes below its low (and is bearish).
This pattern often reveals institutional traps or stop hunts before directional movement.
🧠 Trend Filter (H4):
Ensures long signals occur only when the H4 close is higher than the previous H4 close (uptrend).
Ensures short signals occur only in a H4 downtrend.
Designed to align intraday entries (M15, H1) with higher timeframe momentum.
💪 RSI Confirmation:
Includes a configurable RSI filter on the current timeframe.
Only long signals are shown when RSI is above a user-defined threshold (e.g. 55).
Only short signals are shown when RSI is below a user-defined threshold (e.g. 45).
⚙️ Key Features:
Full customization of RSI period and thresholds.
Clean, visual signal plotting on the chart (with “Trap L” or “Trap S” labels).
Built-in alerts for both long and short trap candle setups.
Perfect for traders who want to trade smart reversals with trend and momentum confirmation.
✅ Recommended Timeframes:
M15 and H1 (entry)
Uses H4 for trend bias
If you’re looking to filter out noise and spot only the highest quality reversal setups, the Trap Candle (Trend H4 + RSI Filter) is a solid tool for any price action-based strategy.
First Candle🕯️ First Candle Indicator (First 5-Minute Candle High/Low)
The First Candle indicator automatically marks the high and low of the first 5-minute candle of the U.S. trading session . These levels can act as key intraday support and resistance zones, often used in breakout, scalping, or opening-range trading strategies.
📌 Key Features:
Automatic detection of the first candle of the U.S. session based on the selected timeframe (default is 5 minutes).
Horizontal lines are plotted at the high and low of that candle, with fully customizable colors and thickness.
Labels show the exact level and timeframe used for the high and low.
Resets daily, removing previous session data at the start of a new session.
Displays a visual marker (blue triangle) when the first candle is detected.
Allows users to select different timeframes for defining the "first candle" (e.g., 1, 5, 15 minutes).
⚙️ Customizable Inputs:
Show First Candle Lines: toggle the display of high/low lines.
Timeframe for Marking: choose the timeframe to detect the first candle (e.g., 5 minutes).
High Line Color / Low Line Color: set the color of each level line.
Line Thickness: adjust the width of the lines (1 to 5 pixels).
🧠 Strategic Applications:
Identify breakout zones right after the market opens.
Define opening range for pullback or continuation setups.
Set clear reference levels for intraday trading decisions.

Daily Candle BoxDaily candle overlay, high, low, and candle color based on open and close
Charts included in script: '3m', '5m', '15m', '1H'
1. Visualizes Key Daily Levels on Lower Timeframes:
The indicator overlays the previous day’s high and low as a box on a lower timeframe chart (e.g., 5-minute). This highlights critical support and resistance levels from the daily timeframe, making it easier to see where price might react without switching to a daily chart.
Use Case: Traders can identify potential reversal or breakout zones on intraday charts, aligning lower timeframe trades with higher timeframe structure.
2. Simplifies Intraday Trading Decisions:
By showing the previous day’s range (high to low) as a box, it provides a clear context for intraday price action. For example, if the price approaches the box’s top (previous day’s high), traders might anticipate resistance or a breakout.
Use Case: Useful for scalpers or day traders who need to quickly assess whether the price is near significant daily levels for entries, exits, or stop-loss placement.
3. Highlights Daily Candle Direction:
The box’s color (green for bullish, red for bearish) indicates whether the previous day’s close was above or below its open. This provides a quick visual cue about the prior day’s market sentiment.

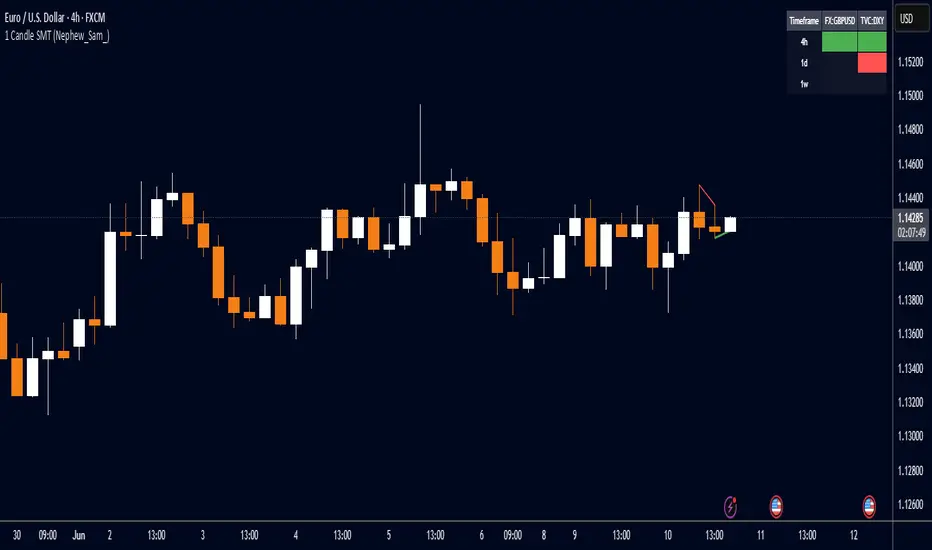
1 Candle SMT Divergence (Nephew_Sam_)📊 1 Candle SMT Divergence Detector
3-Way Smart Money Theory (SMT) Divergence Scanner for Multi-Symbol Analysis
This indicator identifies 1-candle SMT divergences by comparing one primary symbol against up to 2 correlation symbols across multiple timeframes simultaneously. Perfect for detecting institutional smart money moves and market inefficiencies.
🎯 Key Features:
3-Way Comparison: Compare 1 "From" symbol vs 2 "To" symbols (configurable)
5 Symbol Pairs: Pre-configure up to 5 different symbol combinations
Multi-Timeframe: Scan 5 timeframes simultaneously (Chart, 1H, 4H, Daily, Weekly)
Smart Filtering: Only displays timeframes equal to or higher than your chart
Real-Time Detection: Compares current vs previous candle highs/lows
Visual Alerts: Clean table display with color-coded divergence status
Line Drawing: Optional trend lines connecting divergence points
Replay Compatible: Works with TradingView's replay mode
📈 How It Works:
Detects when one symbol makes a higher high while correlated symbols make lower highs (and vice versa for lows). This creates SMT divergence signals that often precede significant market moves.
Candle Ribbon [UkutaLabs]The Candle Ribbon is a powerful trading tool that creates a strong ribbon that indicates market strength. This ribbon is created using three moving averages that use the candle values (high, low, open and close) as its input values.
The center most MA will also be colored green, red or grey depending on whether or not its direction aligns with current market strength.
The outer band lines act as range indicators, plotted above and below the center ribbon, which represent volatility boundaries for price action.
█ USAGE
The Candle Ribbon is created using a series of three moving averages that uses values from the candle as its inputs. The user has the ability to select whether the moving averages are EMAs or SMAs, as well as the ability to control the period of the moving averages.
If the moving average calculated using the Candle Open is below the moving average calculated using the Candle Close, the ribbon will be colored green, indicating a bullish trend. If the moving average calculated using the Candle Open is above the moving average calculated using the Candle Open, the ribbon will be colored red, indicating a bearish trend.
This indicator also uses a series of hidden EMAs to determine market strength. If these EMAs do not align with the direction of the Candle Ribbon, the middle MA will instead be colored grey, indicating uncertainty in the market, as well as a possible reversal.
█ SETTINGS
Configuration
• Moving Average Type: Determines whether or not the Candle Moving Averages will be drawn as EMAs or SMAs.
• Moving Average Period: Determines the period of the Candle Moving Averages.
Moving Average
• Moving Average Input: Determines the input values for the hidden EMAs.

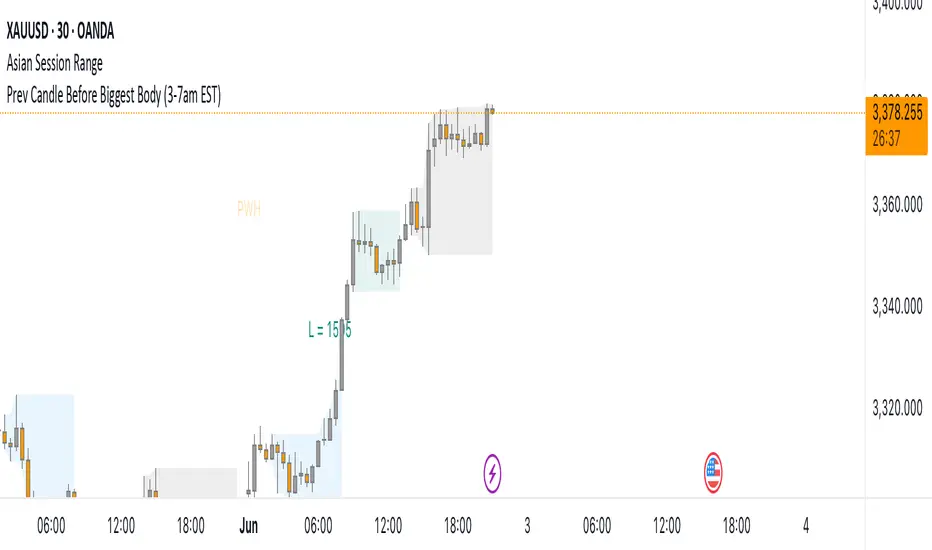
Prev Candle Before Biggest Body (3-7am EST)This indicator automatically identifies and marks, for each trading day, the candle immediately preceding the largest open-to-close movement (in pips) during the key London session window from 3:00am to 7:00am EST (New York time). The largest candle is determined by the absolute difference between its open and close prices, measured in pips. The candle just before this “biggest” move is highlighted with a distinctive pink flag above the bar. This tool is especially useful for traders seeking to analyze pre-breakout price action or to identify key levels and setups that occur right before significant volatility during the early London session.
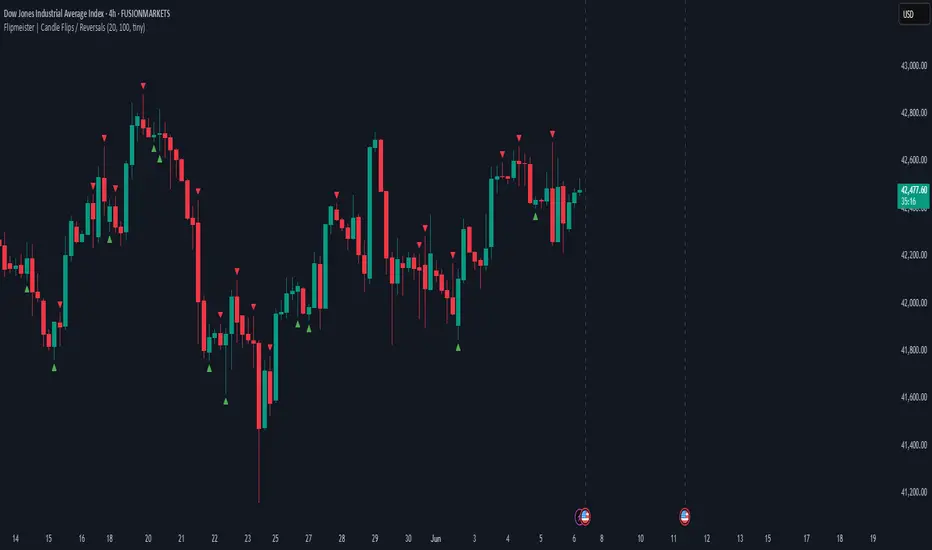
Flipmeister | Candle Flips / ReversalsOpinionated way to highlight important candle flips and can lead to trading opportunities.
- Green to Red flip needs to break previous candle's high and flip to qualify
- Red to Green flip needs to break previous candle's low and flip to qualify
You can configure:
- Min Wick Size for marker to be shown
- Max lookback in bars to limit the amount of markers on the chart
Alerts! You can setup alert conditions for any flip and it's going to notify you when it happens.
Create alert -> Condition: Flipmeister -> Function: Any Flip (or any other available condition).
Simple Candle Countdown TimerDescription:
This lightweight and customizable TradingView indicator displays a real-time countdown timer for the current candle directly on your chart. The timer updates every second and shows the time remaining until the current candle closes, in the format MM:SS.
🔧 Features:
Adjustable X/Y offset to position the timer anywhere on the chart
Customizable text color, background color, and text size
Clear and minimal design for easy visibility
Ideal for scalpers, intraday traders, or anyone who wants precise awareness of candle close timing.

FVG Candle HighlighterThis indicator highlights only the true Fair Value Gap (FVG) creator candle — the middle candle in a 3-bar FVG formation — with zero clutter.
🔹 Bullish FVG: Candle is colored if price gaps above the high two bars back
🔹 Bearish FVG: Candle is colored if price gaps below the low two bars back
✨ No boxes. No zones. Just pure, visual price-action accuracy.
🔧 Powered by Pine Script v6
🧠 Based on institutional-style FVG logic
🎯 Ideal for Smart Money / ICT / Order Block strategies

Candle PercentageThis script calculates the percentage movement of the candle body from open to close and displays it as a label on the chart. The label color changes based on the candle's direction:
Green for bullish (price closes higher than it opened),
Red for bearish (price closes lower than it opened).
The script also allows you to select the label size, with the following options:
Tiny (very small text)
Small (small text)
Normal (default text size)
Large (large text)
Huge (giant text)
By default, the label size is set to Normal.
The percentage is calculated using the formula:
(Body Size / Open Price) * 100
This is helpful for traders who want to quickly assess the magnitude of price movement within each candle and analyze market sentiment based on the size of the body.

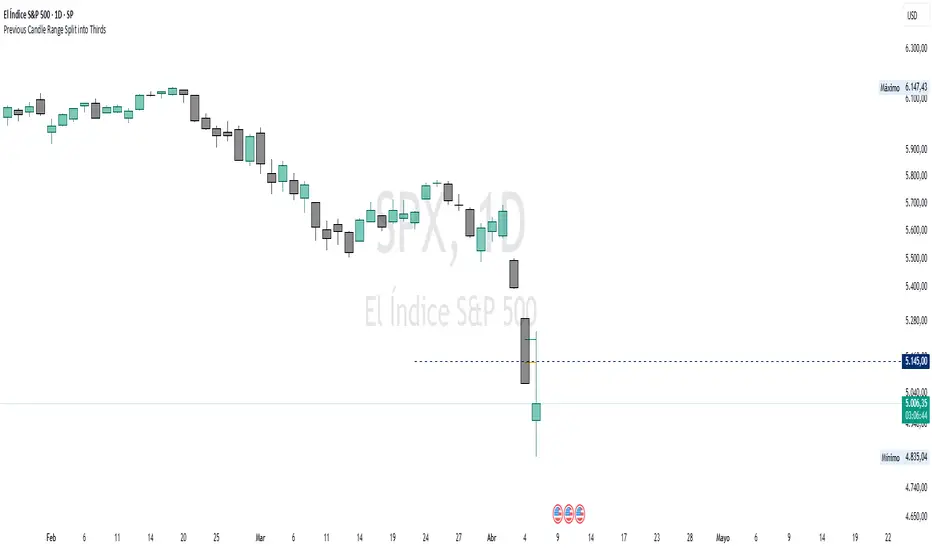
Previous Candle Range Split into ThirdsThis script plots two horizontal lines over the previous candle to divide its total range (high to low) into three equal parts. The first line marks 33% of the range from the low, and the second marks 66%. This helps users visually identify whether the previous candle closed in the lower, middle, or upper third of its range, providing context on potential buyer or seller dominance during that session.
Users can customize the color, width, and style (solid, dotted, dashed) of each line, as well as toggle their visibility from the script's input settings.
This indicator is designed as a discretionary analysis tool and does not generate buy or sell signals.
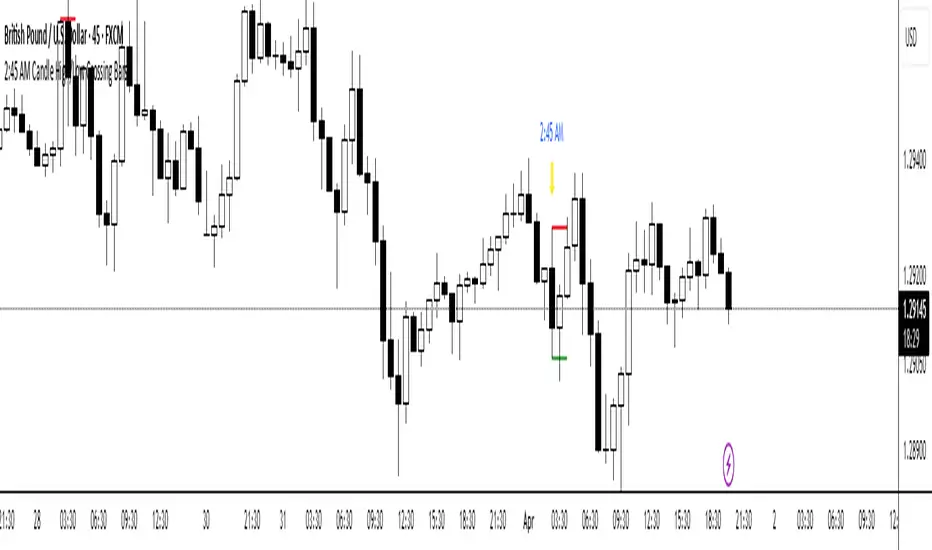
2:45 AM Candle High/Low Crossing Bars2:45 AM Candle High/Low Crossing Bars is an indicator that focuses on the trading view 2:45am NY TIME high and low indicating green for buy and red bars for sell, with the 2:45am new york time highlight/ If the next candle sweeps the low we buy while if it sweeps the high we sell, all time zoon must be the new York UTC time.