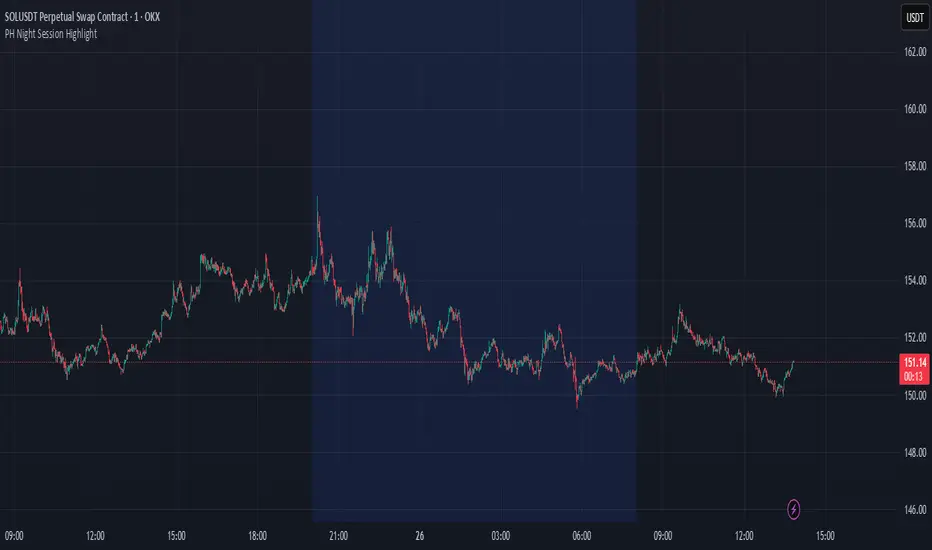
PH Night Session HighlightTraders who want to visually separate the night session on their charts. It highlights the period from 8:01 PM to 7:59 AM (Philippine Time), making it easy to distinguish off-hours or pre-market activity, especially when analyzing crypto or 24/7 markets.
The script automatically adjusts server time (UTC) to Philippine Time (UTC+8) and overlays a soft blue background during the specified time window.
Cerca negli script per "chart"
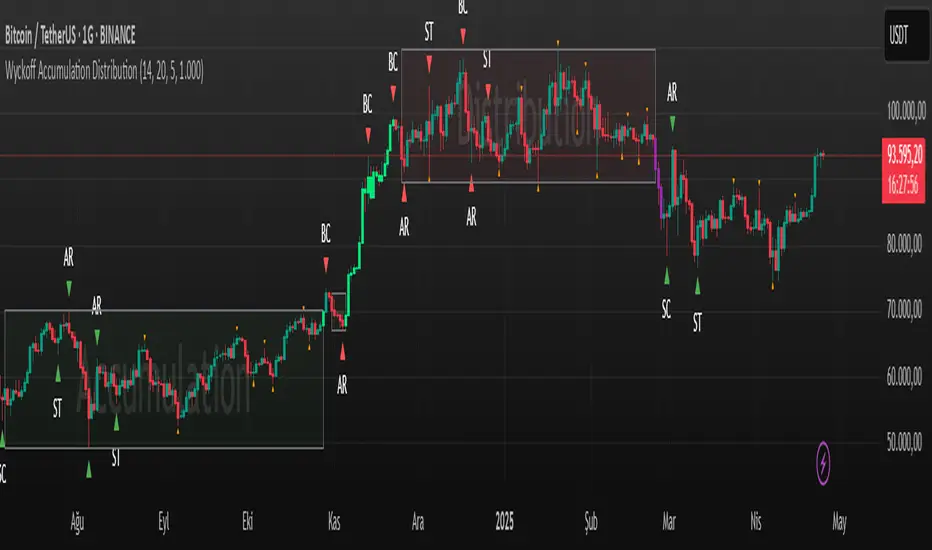
Wyckoff Accumulation Distribution Wyckoff Accumulation & Distribution Indicator (RSI-Based)
This Pine Script is a technical analysis indicator built around the Wyckoff Method, designed to detect accumulation and distribution phases using RSI (Relative Strength Index) and pivot points. It automatically marks key structural turning points on the chart and highlights relevant zones with colored boxes.
What Does It Do?
Draws accumulation and distribution boxes based on RSI behavior.
Automatically detects Wyckoff structural signals:
SC (Selling Climax)
AR (Automatic Rally)
ST (Secondary Test)
BC (Buying Climax)
DAR (Automatic Reaction)
DST (Secondary Test - Distribution)
Identifies trend transitions by detecting sideways RSI movement.
Attempts to detect spring and UTAD-like deviations based on RSI reversals.
Uses RSI extremes in conjunction with pivot points to generate Wyckoff signals.
How Does It Work?
RSI Zone: It identifies sideways markets when RSI stays within ±20 of the 50 level (this range is configurable).
Pivot Points: It detects pivot highs/lows that sync with RSI values (pivotLen is adjustable).
Trend Box Drawing:
When RSI exits the sideways zone, the script draws a gray box between the highest high and lowest low within that range.
If RSI breaks upward, the box becomes green (Accumulation); if downward, it becomes red (Distribution).
Wyckoff Structural Points:
SC/BC: Detected when a pivot occurs with RSI below/above a threshold.
AR/DAR: The next opposite pivot after SC or BC.
ST/DST: The next same-direction pivot after AR or DAR.
How to Use It
Works best on 4H or daily charts for more reliable signals. Shorter timeframes may generate noise.
Primarily used for interpreting RSI structures through the lens of Wyckoff methodology.
Box colors help quickly identify market phase:
Green box: Likely Accumulation
Red box: Likely Distribution
Triangular markers show key signals:
SC, AR, ST: Accumulation points
BC, DAR, DST: Distribution points
Use these signals alongside price action to manually interpret Wyckoff phases.
image.binance.vision
image.binance.vision
What Is the Wyckoff Method?
The Wyckoff Method, developed in the 1930s by Richard Wyckoff, is a market analysis approach that focuses on supply and demand dynamics behind price movements.
Wyckoff’s 5 Phases:
Accumulation: Smart money gradually buying at low prices.
Markup: Price begins trending upwards.
Distribution: Smart money selling to retail traders.
Markdown: Downtrend begins as supply outweighs demand.
Re-accumulation / Re-distribution: Trend-continuation phases with consolidations.
This indicator is specifically designed to detect phase 1 (Accumulation) and phase 3 (Distribution).
Extra Notes
Repainting is minimal, as pivots are confirmed using historical candles.
Labels use plotshape for a clean, minimalist visual style.
Other Wyckoff events (like SOS, LPS, UT, UTAD) could be added in future updates.
This script does not generate buy/sell signals; it is meant for structural interpretation.
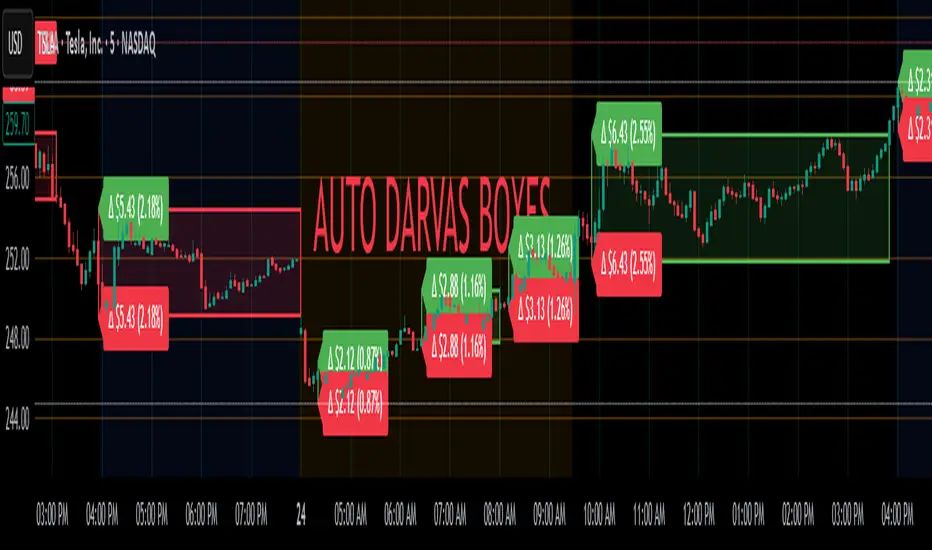
Auto Darvas Boxes## AUTO DARVAS BOXES
---
### OVERVIEW
**Auto Darvas Boxes** is a fully-automated, event-driven implementation of Nicolas Darvas’s 1950s box methodology.
The script tracks consolidation zones in real time, verifies that price truly “respects” those zones for a fixed validation window, then waits for the first decisive range violation to mark a directional breakout.
Every box is plotted end-to-end—from the first candle of the sideways range to the exact candle that ruptures it—giving you an on-chart, visually precise record of accumulation or distribution and the expansion that follows.
---
### HISTORICAL BACKGROUND
* Nicolas Darvas was a professional ballroom dancer who traded U.S. equities by telegram while touring the world.
* Without live news or Level II, he relied exclusively on **price** to infer institutional intent.
* His core insight: true market-moving entities leave footprints in the form of tight ranges; once their buying (or selling) is complete, price erupts out of the “box.”
* Darvas’s original procedure was manual—he kept notebooks, drew rectangles around highs and lows, and entered only when price punched out of the roof of a valid box.
* This indicator distills that logic into a rolling, self-resetting state machine so you never miss a box or breakout on any timeframe.
---
### ALGORITHM DETAIL (FOUR-STATE MACHINE)
**STATE 0 – RANGE DEFINITION**
• Examine the last *N* candles (default 7).
• Record `rangeHigh = highest(high, N) + tolerance`.
• Record `rangeLow = lowest(low, N) – tolerance`.
• Remember the index of the earliest bar in this window (`startBar`).
• Immediately transition to STATE 1.
**STATE 1 – RANGE VALIDATION**
• Observe the next *N* candles (again default 7).
• If **any** candle prints `high > rangeHigh` or `low < rangeLow`, the validation fails and the engine resets to STATE 0 **beginning at the violating candle**—no halfway boxes, no overlap.
• If all *N* candles remain inside the range, the box becomes **armed** and we transition to STATE 2.
**STATE 2 – ARMED (LIVE VISUAL FEEDBACK)**
• Draw a **green horizontal line** at `rangeHigh`.
• Draw a **red horizontal line** at `rangeLow`.
• Lines are extended in real time so the user can see the “live” Darvas ceiling and floor.
• Engine waits indefinitely for a breakout candle:
– **Up-Breakout** if `high > rangeHigh`.
– **Down-Breakout** if `low < rangeLow`.
**STATE 3 – BREAKOUT & COOLDOWN**
• Upon breakout the script:
1. Deletes the live range lines.
2. Draws a **filled rectangle (box)** from `startBar` to the breakout bar.
◦ **Green fill** when price exits above the ceiling.
◦ **Red fill** when price exits below the floor.
3. Optionally prints two labels at the left edge of the box:
◦ Dollar distance = `rangeHigh − rangeLow`.
◦ Percentage distance = `(rangeHigh − rangeLow) / rangeLow × 100 %`.
• After painting, the script waits a **user-defined cooldown** (default = 7 bars) before reverting to STATE 0. The cooldown guarantees separation between consecutive tests and prevents overlapping rectangles.
---
### INPUT PARAMETERS (ALL ADJUSTABLE FROM THE SETTINGS PANEL)
* **BARS TO DEFINE RANGE** – Number of candles used for both the definition and validation windows. Classic Darvas logic uses 7 but feel free to raise it on higher timeframes or volatile instruments.
* **OPTIONAL TOLERANCE** – Absolute price buffer added above the ceiling and below the floor. Use a small tolerance to ignore single-tick spikes or data-feed noise.
* **COOLDOWN BARS AFTER BREAKOUT** – How long the engine pauses before hunting for the next consolidation. Setting this equal to the range length produces non-overlapping, evenly spaced boxes.
* **SHOW BOX DISTANCE LABELS** – Toggle on/off. When on, each completed box displays its vertical size in both dollars and percentage, anchored at the box’s left edge.
---
### REAL-TIME VISUALISATION
* During the **armed** phase you see two extended, colour-coded guide-lines showing the exact high/low that must hold.
* When the breakout finally occurs, those lines vanish and the rectangle instantly appears, coloured to match the breakout direction.
* This immediate visual feedback turns any chart into a live Darvas tape—no manual drawing, no lag.
---
### PRACTICAL USE-CASES & BEST-PRACTICE WORKFLOWS
* **INTRADAY MOMENTUM** – Drop the script on 1- to 15-minute charts to catch tight coils before they explode. The coloured box marks the precise origin of the expansion; stops can sit just inside the opposite side of the box.
* **SWING & POSITION TRADING** – On 4-hour or daily charts, boxes often correspond to accumulation bases or volatility squeezes. Waiting for the box-validated breakout filters many false signals.
* **MEAN-REVERSION OR “FADE” STRATEGIES** – If a breakout immediately fails and price re-enters the box, you may have trapped momentum traders; fading that failure can be lucrative.
* **RISK MANAGEMENT** – Box extremes provide objective, structure-based stop levels rather than arbitrary ATR multiples.
* **BACK-TEST RESEARCH** – Because each box is plotted from first range candle to breakout candle, you can programmatically measure hold time, range height, and post-breakout expectancy for any asset.
---
### CUSTOMISATION IDEAS FOR POWER USERS
* **VOLATILITY-ADAPTIVE WINDOW** – Replace the fixed 7-bar length with a dynamic value tied to ATR percentile so the consolidation window stretches or compresses with volatility.
* **MULTI-TIMEFRAME LOGIC** – Only arm a 5-minute box if the 1-hour trend is aligned.
* **STRATEGY WRAPPER** – Convert the indicator to a full `strategy{}` script, automate entries on breakouts, and benchmark performance across assets.
* **ALERTS** – Create TradingView alerts on both up-breakout and down-breakout conditions; route them to webhook for broker automation.
---
### FINAL THOUGHTS
**Auto Darvas Boxes** packages one of the market’s oldest yet still potent price-action frameworks into a modern, self-resetting indicator. Whether you trade equities, futures, crypto, or forex, the script highlights genuine contraction-expansion sequences—Darvas’s original “boxes”—with zero manual effort, letting you focus solely on execution and risk.
ICT Judas + Silver Bullet🔰 ICT Judas + Silver Bullet Indicator (SMC-based)
Built for Prop Firm and High Win Rate Intraday Traders
This indicator identifies key institutional setups from Inner Circle Trader (ICT) and Smart Money Concepts (SMC) strategies, optimized for XAUUSD, EURUSD, and other high-volume pairs on the 5-minute chart.
📌 Core Features:
✅ Asian Range Box (02:00–08:00 SGT) – used as manipulation anchor
✅ London Killzone (14:00–16:00 SGT) – Judas Swing detection
✅ New York Killzone (22:30–23:30 SGT) – Silver Bullet setups
✅ Automatic Fair Value Gap (FVG) detection
✅ Liquidity sweep detection based on 20-bar EQH/EQL
✅ Entry + Stop Loss + Take Profit visualization with adjustable RR
✅ Alerts for Judas and Silver setups
✅ Perfect for prop firm scalping and intraday swing logic
🛠️ How It Works:
- Judas Swing: triggers when liquidity above the Asian high is swept during London Killzone
- Silver Bullet: triggers when liquidity below recent lows is swept during NY Killzone
- Entry shown via circle, SL and TP lines based on user-defined RR and stop-loss pip distance
- Designed to be paired with SMC/ICT OB/FVG confirmation entries
⚙️ Settings:
- Adjustable session times
- Toggle FVG display
- Set RR and SL pips to match prop firm rules
- Compatible with alert webhooks for Telegram
🕰️ Note:
All times are fixed to **SGT (GMT+8)**. If you're in another timezone, adjust your TradingView timezone accordingly or update the session inputs manually during Daylight Saving Time changes.
🔔 Alert-Ready:
Use alerts for live signals and pair with webhooks for automation.
🔍 Recommended Pairings:
XAUUSD, EURUSD, GBPUSD, NAS100 on M5 chart
📈 Win Rate Potential:
Backtested with high-probability setups aligned with prop firm daily goals. Best used with strict discipline and 1-2 setups per day.
—
Built with ❤️ by a trader, for traders looking for precision-based executions using ICT logic.

Heiken Ashi Supertrend ADXHeiken Ashi Supertrend ADX Indicator
Overview
This indicator combines the power of Heiken Ashi candles, Supertrend indicator, and ADX filter to identify strong trend movements across multiple timeframes. Designed primarily for the cryptocurrency market but adaptable to any tradable asset, this system focuses on capturing momentum in established trends while employing a sophisticated triple-layer stop loss mechanism to protect capital and secure profits.
Strategy Mechanics
Entry Signals
The strategy uses a unique blend of technical signals to identify high-probability trade entries:
Heiken Ashi Candles: Looks specifically for Heiken Ashi candles with minimal or no wicks, which signal strong momentum and trend continuation. These "full-bodied" candles represent periods where price moved decisively in one direction with minimal retracement. These are overlayed onto normal candes for more accuarte signalling and plotting
Supertrend Filter: Confirms the underlying trend direction using the Supertrend indicator (default factor: 3.0, ATR period: 10). Entries are aligned with the prevailing Supertrend direction.
ADX Filter (Optional) : Can be enabled to focus only on stronger trending conditions, filtering out choppy or ranging markets. When enabled, trades only trigger when ADX is above the specified threshold (default: 25).
Exit Signals
Positions are closed when either:
An opposing signal appears (Heiken Ashi candle with no wick in the opposite direction)
Any of the three stop loss mechanisms are triggered
Triple-Layer Stop Loss System
The strategy employs a sophisticated three-tier stop loss approach:
ATR Trailing Stop: Adapts to market volatility and locks in profits as the trend extends. This stop moves in the direction of the trade, capturing profit without exiting too early during normal price fluctuations.
Swing Point Stop: Uses natural market structure (recent highs/lows over a lookback period) to place stops at logical support/resistance levels, honoring the market's own rhythm.
Insurance Stop: A percentage-based safety net that protects against sudden adverse moves immediately after entry. This is particularly valuable when the swing point stop might be positioned too far from entry, providing immediate capital protection.
Optimization Features
Customizable Filters : All components (Supertrend, ADX) can be enabled/disabled to adapt to different market conditions
Adjustable Parameters : Fine-tune ATR periods, Supertrend factors, and ADX thresholds
Flexible Stop Loss Settings : Each of the three stop loss mechanisms can be individually enabled/disabled with customizable parameters
Best Practices for Implementation
[Recommended Timeframes : Works best on 4-hour charts and above, where trends develop more reliably
Market Conditions: Performs well across various market conditions due to the ADX filter's ability to identify meaningful trends
Performance Characteristics
When properly optimized, this has demonstrated profit factors exceeding 3 in backtesting. The approach typically produces generous winners while limiting losses through its multi-layered stop loss system. The ATR trailing stop is particularly effective at capturing extended trends, while the insurance stop provides immediate protection against adverse moves.
The visual components on the chart make it easy to follow the strategy's logic, with position status, entry prices, and current stop levels clearly displayed.
This indicator represents a complete trading system with clearly defined entry and exit rules, adaptive stop loss mechanisms, and built-in risk management through position sizing.

Aggressive Predictor+ (Last Bar, Vol, Wick)# Aggressive Predictor+ Pine Script Indicator
**Version:** Based on the script incorporating Last Bar analysis, Volume Confirmation, and Wick Rejection.
## Overview
This TradingView Pine Script indicator aims to predict the likely directional bias of the **next** candle based on an aggressive analysis of the **last closed candle's** price action, volume, and wick characteristics relative to recent market volatility (ATR).
It is designed to be **highly reactive** to the most recent bar's information. The prediction is visualized directly on the chart through shapes, a projected line, a text label, and an information table.
**Please Note:** Predicting the next candle is inherently speculative. This indicator provides a probability assessment based on its specific logic and should be used as a supplementary tool within a broader trading strategy, not as a standalone signal. Its performance heavily depends on market conditions and the chosen settings.
## Core Logic Explained
The indicator follows these steps for each new bar, looking back at the **last closed bar** (` `):
1. **Calculate Recent Volatility:** Determines the Average True Range (ATR) over the specified `ATR Lookback Period` (`atr_len`). This provides context for how volatile the market has been recently.
2. **Analyze Last Bar's Body:** Calculates the price change from open to close (`close - open `) of the last completed bar.
3. **Compare Body to Volatility:** Compares the absolute size of the last bar's body to the calculated ATR (`prev_atr`) multiplied by a sensitivity threshold (`threshold_atr_mult`).
* If the body size (positive) exceeds the threshold, the initial prediction is "Upward".
* If the body size (negative) exceeds the negative threshold, the initial prediction is "Downward".
* Otherwise, the initial prediction is "Neutral".
4. **Check Volume Confirmation:** Compares the volume of the last bar (`volume `) to its recent average volume (`ta.sma(volume, vol_avg_len) `). If the volume is significantly higher (based on `vol_confirm_mult`), it adds context ("High Vol") to directional predictions.
5. **Check for Wick Rejection:** Analyzes the wicks of the last bar.
* If the initial prediction was "Upward" but there was a large upper wick (relative to the body size, defined by `wick_rejection_mult`), it indicates potential selling pressure rejecting higher prices. The prediction is **overridden to "Neutral"**.
* If the initial prediction was "Downward" but there was a large lower wick, it indicates potential buying pressure supporting lower prices. The prediction is **overridden to "Neutral"**.
6. **Determine Final Prediction:** The final state ("Upward", "Downward", or "Neutral") is determined after considering potential wick rejection overrides. Context about volume or wick rejection is added to the display text.
## Visual Elements
* **Prediction Shapes:**
* Green Up Triangle: Below the bar for an "Upward" prediction (without wick rejection).
* Red Down Triangle: Above the bar for a "Downward" prediction (without wick rejection).
* Gray Diamond: Above/Below the bar if a directional move was predicted but then neutralized due to Wick Rejection.
* **Prediction Line:**
* Extends forward from the current bar's close for `line_length` bars (Default: 20).
* Color indicates the final predicted state (Green: Upward, Red: Downward, Gray: Neutral).
* Style is solid for directional predictions, dotted for Neutral.
* The *slope/magnitude* of the line is based on recent volatility (ATR) and the `projection_mult` setting, representing a *potential* magnitude if the predicted direction holds, scaled by recent volatility. **This is purely a visual projection, not a precise price forecast.**
* **Prediction Label:**
* Appears at the end of the Prediction Line.
* Displays the final prediction state (e.g., "Upward (High Vol)", "Neutral (Wick Rej)").
* Shows the raw price change of the last bar's body and its size relative to ATR (e.g., "Last Body: 1.50 (120.5% ATR)").
* Tooltip provides more detailed calculation info.
* **Info Table:**
* Displays the prediction state, color-coded.
* Shows details about the last bar's body size relative to ATR.
* Dynamically positioned near the latest bar (offsets configurable).
## Configuration Settings (Inputs)
These settings allow you to customize the indicator's behavior and appearance. Access them by clicking the "Settings" gear icon on the indicator name on your chart.
### Price Action & ATR
* **`ATR Lookback Period` (`atr_len`):**
* *Default:* 14
* *Purpose:* Number of bars used to calculate the Average True Range (ATR), which measures recent volatility.
* **`Body Threshold (ATR Multiplier)` (`threshold_atr_mult`):**
* *Default:* 0.5
* *Purpose:* Key setting for **aggression**. The last bar's body size (`close - open`) must be greater than `ATR * this_multiplier` to be initially classified as "Upward" or "Downward".
* *Effect:* **Lower values** make the indicator **more aggressive** (easier to predict direction). Higher values require a stronger price move relative to volatility and result in more "Neutral" predictions.
### Volume Confirmation
* **`Volume Avg Lookback` (`vol_avg_len`):**
* *Default:* 20
* *Purpose:* Number of bars used to calculate the simple moving average of volume.
* **`Volume Confirmation Multiplier` (`vol_confirm_mult`):**
* *Default:* 1.5
* *Purpose:* Volume on the last bar is considered "High" if it's greater than `Average Volume * this_multiplier`.
* *Effect:* Primarily adds context "(High Vol)" or "(Low Vol)" to the display text for directional predictions. Doesn't change the core prediction state itself.
### Wick Rejection
* **`Wick Rejection Multiplier` (`wick_rejection_mult`):**
* *Default:* 1.0
* *Purpose:* If an opposing wick (upper wick on an up-candle, lower wick on a down-candle) is larger than `body size * this_multiplier`, the directional prediction is overridden to "Neutral".
* *Effect:* Higher values require a much larger opposing wick to cause a rejection override. Lower values make wick rejection more likely.
### Projection Settings
* **`Projection Multiplier (ATR based)` (`projection_mult`):**
* *Default:* 1.0
* *Purpose:* Scales the projected *magnitude* of the prediction line. The projected price change shown by the line is `+/- ATR * this_multiplier`.
* *Effect:* Adjusts how far up or down the prediction line visually slopes. Does not affect the predicted direction.
* **`Prediction Line Length (Bars)` (`line_length`):**
* *Default:* 20
* *Purpose:* Controls how many bars forward the **visual** prediction line extends.
* *Effect:* Purely visual length adjustment.
### Visuals
* **`Upward Color` (`bullish_color`):** Color for Upward predictions.
* **`Downward Color` (`bearish_color`):** Color for Downward predictions.
* **`Neutral Color` (`neutral_color`):** Color for Neutral predictions (including Wick Rejections).
* **`Show Prediction Shapes` (`show_shapes`):** Toggle visibility of the triangles/diamonds on the chart.
* **`Show Prediction Line` (`show_line`):** Toggle visibility of the projected line.
* **`Show Prediction Label` (`show_label`):** Toggle visibility of the text label at the end of the line.
* **`Show Info Table` (`show_table`):** Toggle visibility of the information table.
### Table Positioning
* **`Table X Offset (Bars)` (`table_x_offset`):**
* *Default:* 3
* *Purpose:* How many bars to the right of the current bar the info table should appear.
* **`Table Y Offset (ATR Multiplier)` (`table_y_offset_atr`):**
* *Default:* 0.5
* *Purpose:* How far above the high of the last bar the info table should appear, measured in multiples of ATR.
## How to Use
1. Open the Pine Editor in TradingView.
2. Paste the complete script code.
3. Click "Add to Chart".
4. Adjust the input settings (especially `threshold_atr_mult`) to tune the indicator's aggressiveness and visual preferences.
5. Observe the prediction elements alongside your other analysis methods.
## Disclaimer
**This indicator is for informational and educational purposes only. It does not constitute financial advice or a recommendation to buy or sell any asset.** Trading financial markets involves significant risk, and you could lose money. Predictions about future price movements are inherently uncertain. The performance of this indicator depends heavily on market conditions and the settings used. Always perform your own due diligence and consider multiple factors before making any trading decisions. Use this indicator at your own risk.

Multi-Timeframe Price LevelsThis indicator displays key price levels from multiple timeframes on your chart, helping you identify important support and resistance zones.
## Features
- **Multiple Timeframes**: View price levels from 4H, Daily, 3-Day, Weekly, and Monthly charts simultaneously
- **Customizable Price Types**: Choose to display Open, Close, High, and Low prices
- **Color-Coded**: Each timeframe has its own color for easy identification
- **Fully Customizable**: Enable/disable specific timeframes and price types as needed
## How to Use
1. Add the indicator to your chart
2. Use the input options to select which timeframes and price types you want to display
3. Look for areas where multiple price levels converge - these often act as strong support/resistance zones
## Color Guide
- **Red**: 4-Hour timeframe
- **Blue**: Daily timeframe
- **Green**: 3-Day timeframe
- **Purple**: Weekly timeframe
- **Orange**: Monthly timeframe
For each timeframe, the transparency varies by price type:
- Open: 70% transparency
- Close: 50% transparency
- High: 30% transparency
- Low: 10% transparency (most visible)
## Trading Applications
- Identify key support and resistance levels
- Spot multi-timeframe confluences for stronger trade setups
- Plan entries and exits based on historical price reactions
- Set stop losses and take profit targets at significant levels
This indicator works best when combined with your existing trading strategy to confirm important price zones.

Falcon SignalsThis script is a TradingView Pine Script for a trading strategy called "Falcon Signals." It combines multiple technical indicators and strategies to generate buy and sell signals. Here’s a breakdown of what the script does:
1. Supertrend Indicator:
The script calculates the Supertrend indicator using the Average True Range (ATR) and a specified multiplier (factor). The Supertrend is used to define the trend direction, with a green line for an uptrend and a red line for a downtrend.
2. EMA (Exponential Moving Average):
Two EMAs are used: a fast EMA (9-period) and a slow EMA (21-period). The script checks for crossovers of the fast EMA above or below the slow EMA as a basis for buying and selling signals.
3. RSI (Relative Strength Index):
The RSI (14-period) is used to measure the momentum of the price. A buy signal is generated when the RSI is less than 70, while a sell signal is generated when it’s greater than 30.
4. Take Profit (TP) and Stop Loss (SL):
The script allows users to set custom percentages for take profit and stop loss. The take profit is set at a certain percentage above the entry price for buy signals, and the stop loss is set at a percentage below the entry price, and vice versa for sell signals.
5. Trailing Stop:
A trailing stop can be enabled, which dynamically adjusts the stop loss level as the price moves in the favorable direction. If the price moves against the position by a certain trailing percentage, the position will be closed.
6. Engulfing Patterns:
The script checks for bullish and bearish engulfing candlestick patterns, indicating potential reversals. A bullish engulfing pattern is marked with a teal label ("🔄 Reversal Up"), and a bearish engulfing pattern is marked with a fuchsia label ("🔄 Reversal Down").
7. Plotting:
The script plots various indicators and signals:
Entry line: Shows where the buy or sell signal is triggered.
Take profit and stop loss levels are plotted as lines.
EMA and Supertrend lines are plotted on the chart.
Trailing stop line, if enabled, is also plotted.
8. Buy and Sell Labels:
The script places labels on the chart when buy or sell signals are triggered, indicating the price at which the order should be placed.
9. Exit Line:
The script plots an exit line when the trailing stop is hit, signaling when a position should be closed.
10. Alerts:
Alerts are set for both buy and sell signals, notifying the trader when to act based on the strategy's conditions.
This strategy combines trend-following (Supertrend), momentum (RSI), and price action patterns (EMA crossovers and engulfing candlestick patterns) to generate trade signals. It also offers the flexibility of take profit, stop loss, and trailing stop features.

BTC Dominance Excluding StablecoinsBTC Dominance Excluding Stablecoins
Description:
The "BTC Dominance Excluding Stablecoins" indicator calculates Bitcoin's dominance as a percentage of the total cryptocurrency market capitalization, excluding the market caps of major stablecoins (USDT and USDC). Unlike the standard BTC.D ticker, which includes stablecoins in the total market cap, this indicator provides a clearer view of Bitcoin’s dominance relative to the "non-stable" crypto market. This can be useful for traders and analysts who want to assess Bitcoin’s strength without the influence of stablecoin market caps, which often skew dominance metrics during periods of high stablecoin usage.
How It Works:
Bitcoin Market Cap: Fetches Bitcoin’s market capitalization using CRYPTOCAP:BTC.
Total Market Cap: Retrieves the total cryptocurrency market cap via CRYPTOCAP:TOTAL.
Stablecoin Adjustment: Subtracts the market caps of USDT (CRYPTOCAP:USDT) and USDC (CRYPTOCAP:USDC) from the total market cap.
Dominance Calculation: Computes Bitcoin’s dominance as (BTC Market Cap / Adjusted Total Market Cap) * 100, where the adjusted total excludes stablecoins.
Output: Plots the resulting dominance percentage as a line chart.
Features:
Displays Bitcoin dominance excluding stablecoins on any timeframe.
Customizable line color and thickness for better visualization.
Provides a more accurate representation of Bitcoin’s market share in the volatile, non-stablecoin crypto ecosystem.
Usage:
Add this indicator to your TradingView chart to compare Bitcoin’s dominance against the broader altcoin market, free from stablecoin distortions. Use it alongside other indicators like BTC.D or price charts to analyze market trends, especially during periods of high stablecoin inflows or outflows.
Notes:
The indicator currently excludes USDT and USDC, the two largest stablecoins by market cap. Additional stablecoins (e.g., DAI, BUSD) can be added by modifying the script if desired.
Data is sourced from TradingView’s CRYPTOCAP symbols, which may have slight delays or variations depending on exchange data feeds.
Best used on daily or higher timeframes for smoother, more reliable results.
Author:
Created by K Du₿
Version:
Pine Script v5

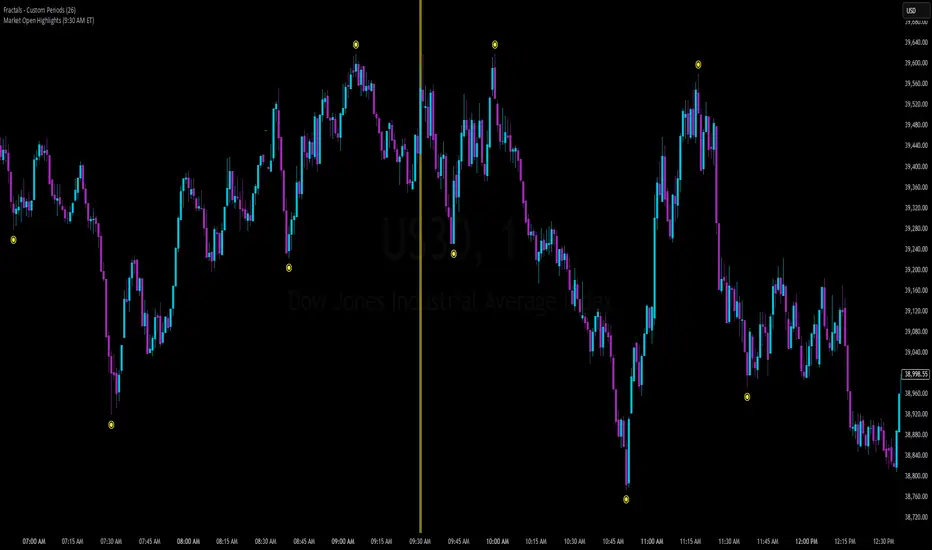
Market Open Highlights (9:30 AM ET)This indicator zeroes in on the 9:30 AM Eastern Time market opens for NAS100 and US30, highlighting all market opens with a bold yet subtle yellow background. Tailored for precision backtesting, it uses TradingView’s timezone capabilities to pinpoint the exact 9:30 AM candle, skipping weekends to focus solely on U.S. equity market opens.
What It Does:
The script tracks the bar indices of all market opens at 9:30 AM ET, applying a semi-transparent yellow highlight to those candles. It’s a clean, efficient way to mark key session starts for analyzing price action or testing strategies.
How to Use It:
1. Apply the script to a chart of NAS100 (e.g., FX:NAS100) or US30 (e.g., FX:US30) in TradingView on any timeframe.
2. Set your chart timezone to "America/New_York" (Settings > Timezone/Sessions).
3. Scroll back through trading days to see the yellow highlights on the 9:30 AM candles.
4. While it functions across all timeframes, it’s optimized for 5-minute and 1-minute charts, where the 9:30 AM candle aligns precisely with the U.S. market open for detailed analysis.
5. Use it to study price behavior or refine strategies around this critical daily event.
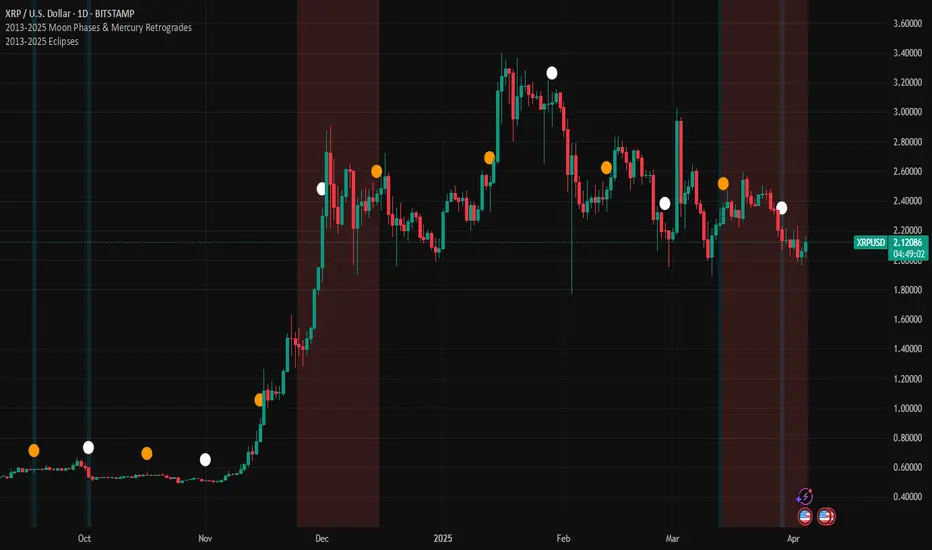
2013-2025 EclipsesIndicator Description: 2013-2025 Eclipses
This Pine Script (version 5) indicator overlays solar and lunar eclipse events on a TradingView chart, covering the period from 2013 to 2025. It is designed for traders and astrology enthusiasts who wish to visualize these significant astronomical events alongside price action, potentially identifying correlations with market movements or key turning points.
Features:
Eclipses:
Visualization: Displayed as a semi-transparent aqua background highlight across the chart.
Data: Includes 48 specific eclipse dates (both solar and lunar) from April 25, 2013, to September 21, 2025.
Purpose: Highlights dates of eclipses, which are often considered powerful astrological events associated with sudden changes, revelations, or significant shifts in energy and market sentiment.
Technical Details:
Overlay: The indicator is set to overlay=true, ensuring it displays directly on the price chart rather than in a separate pane.
Date Matching: Utilizes a helper function is_date(y, m, d) to determine if the current chart date matches any of the predefined eclipse dates, using TradingView's year, month, and dayofmonth variables.
Visualization Method:
bgcolor: Applies a light aqua background (using color.new(color.aqua, 85)) on the specific dates of eclipses. The transparency level of 85 allows price action to remain visible through the highlight.
Time Range: Spans from April 2013 to September 2025, covering a 12+ year period of eclipse events.
Usage:
Add the script to your TradingView chart to see eclipse dates highlighted with an aqua background on your chosen symbol and timeframe.
The background highlight appears only on the exact dates of eclipses, making it easy to spot these events amidst price data.
Ideal for those incorporating astrological analysis into trading or studying the potential impact of eclipses on financial markets.
Notes:
The script uses a single-line definition for eclipse_dates to ensure compatibility with Pine Script v5 syntax and avoid line continuation errors.
The aqua color matches the original circle-based visualization, with transparency adjustable via the color.new(color.aqua, 85) parameter (0 = fully opaque, 100 = fully transparent).
Works best on daily or higher timeframes for clear visibility of individual eclipse dates, though it functions on any TradingView-supported timeframe.
Eclipse dates should be cross-checked with astronomical sources for critical applications, as the script relies on the provided data accuracy.
Purpose:
This indicator provides a straightforward way to track eclipses over a 12-year period, offering a visual representation of these potent celestial events. By using a background highlight instead of markers, it maintains chart clarity while emphasizing the specific days when eclipses occur, potentially aiding in the analysis of their influence on market behavior or personal trading strategies.
CISD with Alerts [neo|]█ OVERVIEW
CISD (or Change in State of Delivery) is an ICT concept and reversal pattern which may allow traders to identify reversals or changes in market structure early, compared to using traditional market structure. This script aims to correctly identify, and update these levels and provide alerts, so that traders can take advantage of this concept with ease.
█ CONCEPTS
Simply put, CISD may be identified when price closes above the open of the candle which started the most recent downtrend or liquidity sweep. Generally, it is most powerful when applied to key points in the market as a confirmation from where you may want price to reverse.
For example, when price is in a downtrend, we take the open of the last consecutive downwards candle and observe the CISD once price closes above it, beginning an uptrend.
Examples:
COMEX:GC1!
CME_MINI:NQ1!
█ How to use
To use the indicator, simply apply it to your chart and modify any of your desired inputs.
• Bullish CISD color allows you to change the color of +CISD levels.
• Bearish CISD color allows you to change the color of -CISD levels.
• Line width allows you to modify the width of +-CISD lines.
• Line extension bars allows you to change how far ahead CISD levels are drawn (by default it is 5).
• Keep old CISD levels will allow you to preserve all past CISD levels if you would like to observe the logic.
• Enable stat table will let you add a table on your chart which will tell you the current CISD trend, as well as your ticker and timeframe.
• Table position allows you to customize where the table will appear on your chart.

yatofxDescription: "Ramon Coto's 3 Session Bar Color" Indicator
This TradingView Pine Script indicator colors candlestick bars based on three custom trading sessions. It allows traders to visually distinguish different market timeframes on their charts.
Features:
Three configurable trading sessions with user-defined time ranges.
Customizable session colors:
Session A → Blue
Session B → Red
Session C → Lime
Enable/disable sessions independently using input toggles.
Automatic session detection: Bars are colored based on the active session.
Optimized for TradingView Mobile & Desktop with clear and efficient logic.
How It Works:
1. User Inputs: The script takes session time ranges and enables/disables each session.
2. Session Detection: The script checks whether the current time falls within any of the defined sessions.
3. Bar Coloring: If a session is active, the corresponding color is applied to the bars.
This indicator helps traders quickly recognize which market session they are in, improving decision-making for session-based strategies.

[TehThomas] - ICT Inversion Fair value Gap (IFVG) The Inversion Fair Value Gap (IFVG) indicator is a powerful tool designed for traders who utilize ICT (Inner Circle Trader) strategies. It focuses on identifying and displaying Inversion Fair Value Gaps, which are critical zones that emerge when traditional Fair Value Gaps (FVGs) are invalidated by price action. These gaps represent key areas where price often reacts, making them essential for identifying potential reversals, trend continuations, and liquidity zones.
What Are Inversion Fair Value Gaps?
Inversion Fair Value Gaps occur when price revisits a traditional FVG and breaks through it, effectively flipping its role in the market. For example:
A bullish FVG that is invalidated becomes a bearish zone, often acting as resistance.
A bearish FVG that is invalidated transforms into a bullish zone, serving as support.
These gaps are significant because they often align with institutional trading activity. They highlight areas where large orders have been executed or where liquidity has been targeted. Understanding these gaps provides traders with a deeper insight into market structure and helps them anticipate future price movements with greater accuracy.
Why This Strategy Works
The IFVG concept is rooted in ICT principles, which emphasize liquidity dynamics, market inefficiencies, and institutional order flow. Traditional FVGs represent imbalances in price action caused by gaps between candles. When these gaps are invalidated, they become inversion zones that can act as magnets for price. These zones frequently serve as high-probability areas for price reversals or trend continuations.
This strategy works because it aligns with how institutional traders operate. Inversion gaps often mark areas of interest for "smart money," making them reliable indicators of potential market turning points. By focusing on these zones, traders can align their strategies with institutional behavior and improve their overall trading edge.
How the Indicator Works
This indicator simplifies the process of identifying and tracking IFVGs by automating their detection and visualization on the chart. It scans the chart in real-time to identify bullish and bearish FVGs that meet user-defined thresholds for inversion. Once identified, these gaps are dynamically displayed on the chart with distinct colors for bullish and bearish zones.
The indicator also tracks whether these gaps are mitigated or broken by price action. When an IFVG is broken, it extends the zone for a user-defined number of bars to visualize its potential role as a new support or resistance level. Additionally, alerts can be enabled to notify traders when new IFVGs form or when existing ones are broken, ensuring timely decision-making in fast-moving markets.
Key Features
Automatic Detection: The indicator automatically identifies bullish and bearish IFVGs based on user-defined thresholds.
Dynamic Visualization: It displays IFVGs directly on the chart with customizable colors for easy differentiation.
Real-Time Updates: The status of each IFVG is updated dynamically based on price action.
Zone Extensions: Broken IFVGs are extended to visualize their potential as support or resistance levels.
Alerts: Notifications can be set up to alert traders when key events occur, such as the formation or breaking of an IFVG.
These features make the tool highly efficient and reduce the need for manual analysis, allowing traders to focus on execution rather than tedious chart work.
Benefits of Using This Indicator
The IFVG indicator offers several advantages that make it an indispensable tool for ICT traders. By automating the detection of inversion gaps, it saves time and reduces errors in analysis. The clearly defined zones improve risk management by providing precise entry points, stop-loss levels, and profit targets based on market structure.
This tool is also highly versatile and adapts seamlessly across different timeframes. Whether you’re scalping lower timeframes or swing trading higher ones, it provides actionable insights tailored to your trading style. Furthermore, by aligning your strategy with institutional logic, you gain a significant edge in anticipating market movements.
Practical Applications
This indicator can be used across various trading styles:
Scalping: Identify quick reversal points on lower timeframes using real-time alerts.
Day Trading: Use inversion gaps as key levels for intraday support/resistance or trend continuation setups.
Swing Trading: Analyse higher timeframes to identify major inversion zones that could act as critical turning points in larger trends.
By integrating this tool into your trading routine, you can streamline your analysis process and focus on executing high-probability setups.
Conclusion
The Inversion Fair Value Gap (IFVG) indicator is more than just a technical analysis tool—it’s a strategic ally for traders looking to refine their edge in the markets. By automating the detection and tracking of inversion gaps based on ICT principles, it simplifies complex market analysis while maintaining accuracy and depth. Whether you’re new to ICT strategies or an experienced trader seeking greater precision, this indicator will elevate your trading game by aligning your approach with institutional behavior.
If you’re serious about improving your trading results while saving time and effort, this tool is an essential addition to your toolkit. It provides clarity in chaotic markets, enhances precision in trade execution, and ensures you never miss critical opportunities in your trading journey.
__________________________________________
Thanks for your support!
If you found this idea helpful or learned something new, drop a like 👍 and leave a comment, I’d love to hear your thoughts! 🚀
Make sure to follow me for more price action insights, free indicators, and trading strategies. Let’s grow and trade smarter together! 📈

Imbalance(FVG) DetectorImbalance (FVG) Detector
Overview
The Imbalance (FVG) Detector is a technical analysis tool designed to highlight price inefficiencies by identifying Fair Value Gaps (FVGs). These gaps occur when rapid price movement leaves an area with little to no traded volume, which may later act as a zone of interest. The indicator automatically detects and marks these imbalances on the chart, allowing users to observe historical price behavior more effectively.
Key Features
- Automatic Imbalance Detection: Identifies bullish and bearish imbalances based on a structured three-bar price action model.
- Customizable Sensitivity: Users can adjust the minimum imbalance percentage threshold to tailor detection settings to different assets and market conditions.
- Real-time Visualization: Marked imbalances are displayed as colored boxes directly on the chart.
- Dynamic Box Updates: Imbalance zones extend forward in time until price interacts with them.
- Alert System: Users can set alerts for when new imbalances appear or when price tests an existing imbalance.
How It Works
The indicator identifies market imbalances using a three-bar price structure:
- Bullish Imbalance: Occurs when the high of three bars ago is lower than the low of the previous bar, forming a price gap.
- Bearish Imbalance: Occurs when the low of three bars ago is higher than the high of the previous bar, creating a downward gap.
When an imbalance is detected:
- Green Boxes indicate bullish imbalances.
- Red Boxes indicate bearish imbalances.
- Once price interacts with an imbalance, the box fades to gray, marking it as tested.
! Designed for Crypto Markets
This indicator is particularly useful in crypto markets, where frequent volatility can create price inefficiencies. It provides a structured way to visualize gaps in price movement, helping users analyze historical liquidity areas.
Customization Options
- Min Imbalance Percentage Size: Adjusts the sensitivity of the imbalance detection.
- Alerts: Users can enable alerts to stay notified of new or tested imbalances.
Important Notes
- This indicator is a technical analysis tool and does not provide trading signals or financial advice.
- It does not predict future price movement but highlights historical price inefficiencies.
- Always use this tool alongside other market analysis methods and risk management strategies.

PowerZone Trading StrategyExplanation of the PowerZone Trading Strategy for Your Users
The PowerZone Trading Strategy is an automated trading strategy that detects strong price movements (called "PowerZones") and generates signals to enter a long (buy) or short (sell) position, complete with predefined take profit and stop loss levels. Here’s how it works, step by step:
1. What is a PowerZone?
A "PowerZone" (PZ) is a zone on the chart where the price has shown a significant and consistent movement over a specific number of candles (bars). There are two types:
Bullish PowerZone (Bullish PZ): Occurs when the price rises consistently over several candles after an initial bearish candle.
Bearish PowerZone (Bearish PZ): Occurs when the price falls consistently over several candles after an initial bullish candle.
The code analyzes:
A set number of candles (e.g., 5, adjustable via "Periods").
A minimum percentage move (adjustable via "Min % Move for PowerZone") to qualify as a strong zone.
Whether to use the full candle range (highs and lows) or just open/close prices (toggle with "Use Full Range ").
2. How Does It Detect PowerZones?
Bullish PowerZone:
Looks for an initial bearish candle (close below open).
Checks that the next candles (e.g., 5) are all bullish (close above open).
Ensures the total price movement exceeds the minimum percentage set.
Defines a range: from the high (or open) to the low of the initial candle.
Bearish PowerZone:
Looks for an initial bullish candle (close above open).
Checks that the next candles are all bearish (close below open).
Ensures the total price movement exceeds the minimum percentage.
Defines a range: from the high to the low (or close) of the initial candle.
These zones are drawn on the chart with lines: green or white for bullish, red or blue for bearish, depending on the color scheme ("DARK" or "BRIGHT").
3. When Does It Enter a Trade?
The strategy waits for a breakout from the PowerZone range to enter a trade:
Buy (Long): When the price breaks above the high of a Bullish PowerZone.
Sell (Short): When the price breaks below the low of a Bearish PowerZone.
The position size is set to 100% of available equity (adjustable in the code).
4. Take Profit and Stop Loss
Take Profit (TP): Calculated as a multiple (adjustable via "Take Profit Factor," default 1.5) of the PowerZone height. For example:
For a buy, TP = Entry price + (PZ height × 1.5).
For a sell, TP = Entry price - (PZ height × 1.5).
Stop Loss (SL): Calculated as a multiple (adjustable via "Stop Loss Factor," default 1.0) of the PZ height, placed below the range for buys or above for sells.
5. Visualization on the Chart
PowerZones are displayed with lines on the chart (you can hide them with "Show Bullish Channel" or "Show Bearish Channel").
An optional info panel ("Show Info Panel") displays key levels: PZ high and low, TP, and SL.
You can also enable brief documentation on the chart ("Show Documentation") explaining the basic rules.
6. Alerts
The code generates automatic alerts in TradingView:
For a bullish breakout: "Bullish PowerZone Breakout - LONG!"
For a bearish breakdown: "Bearish PowerZone Breakdown - SHORT!"
7. Customization
You can tweak:
The number of candles to detect a PZ ("Periods").
The minimum percentage move ("Min % Move").
Whether to use highs/lows or just open/close ("Use Full Range").
The TP and SL factors.
The color scheme and what elements to display on the chart.
Practical Example
Imagine you set "Periods = 5" and "Min % Move = 2%":
An initial bearish candle appears, followed by 5 consecutive bullish candles.
The total move exceeds 2%.
A Bullish PowerZone is drawn with a high and low.
If the price breaks above the high, you enter a long position with a TP 1.5 times the PZ height and an SL equal to the height below.
The system executes the trade and exits automatically at TP or SL.
Conclusion
This strategy is great for capturing strong price movements after consolidation or momentum zones. It’s automated, visual, and customizable, making it useful for both beginner and advanced traders. Try it out and adjust it to fit your trading style!

ZRK 30m This TradingView indicator draws alternating 30-minute boxes aligned precisely to real clock times (e.g., 10:00, 10:30, 11:00), helping traders visually segment intraday price action. It highlights every other 30-minute block with customizable colors, line styles, and opacity, allowing users to clearly differentiate between trading intervals. The boxes automatically adjust based on the chart’s timeframe, maintaining accuracy on 1-minute to 60-minute charts. Optional time labels can also be displayed for additional context. This tool is useful for identifying patterns, measuring volatility, or applying breakout strategies based on defined, consistent time windows across global trading sessions.

Sentiment OscillatorIn the complex world of trading, understanding market sentiment can be like reading the emotional pulse of financial markets. Our Sentiment Oscillator is designed to be your personal market mood translator, helping you navigate through the noise of price movements and market fluctuations.
Imagine having a sophisticated tool that goes beyond traditional price charts, diving deep into the underlying dynamics of market behavior. This indicator doesn't just show you numbers – it tells you a story about market sentiment, combining multiple financial signals to give you a comprehensive view of potential market directions.
The Sentiment Oscillator acts like a sophisticated emotional barometer for stocks, cryptocurrencies, or any tradable asset. It analyzes price changes, market volatility, trading volume, and long-term trends to generate a unique sentiment score. This score ranges from highly bullish to deeply bearish, providing traders with an intuitive visual representation of market mood.
Green zones indicate positive market sentiment, suggesting potential buying opportunities. Red zones signal caution, hinting at possible downward trends. The oscillator's gray neutral zone helps you identify periods of market uncertainty, allowing for more calculated trading decisions.
What sets this indicator apart is its ability to blend multiple market factors into a single, easy-to-understand indicator. It's not just about current price – it's about understanding the deeper currents moving beneath the surface of market prices.
Traders can use this oscillator to:
- Identify potential trend reversals
- Understand market sentiment beyond price movement
- Spot periods of market strength or weakness
- Complement other technical analysis tools
Whether you're a day trader, swing trader, or long-term investor, the Sentiment Oscillator provides an additional layer of insight to support your trading strategy. Remember, no indicator is a crystal ball, but this tool can help you make more informed decisions in the dynamic world of trading.

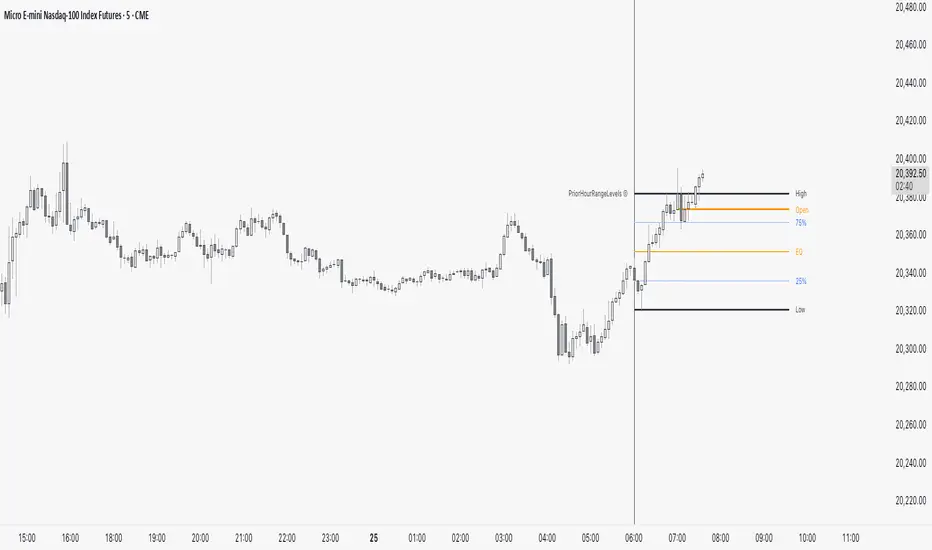
PriorHourRangeLevels_v0.1PriorHourRangeLevels_v0.1
Created by dc_77 | © 2025 | Mozilla Public License 2.0
Overview
"PriorHourRangeLevels_v0.1" is a versatile Pine Script™ indicator designed to help traders visualize and analyze price levels based on the prior hour’s range. It overlays key levels—High, Low, 75%, 50% (EQ), and 25%—from the previous hour onto the current price chart, alongside the current hour’s opening price. With customizable display options and time zone support, it’s ideal for intraday traders looking to identify support, resistance, and breakout zones.
How It Works
Hourly Reset: The indicator detects the start of each hour based on your chosen time zone (e.g., "America/New_York" by default).
Prior Hour Range: It calculates the High and Low of the previous hour, then derives three additional levels:
75%: 75% of the range above the Low.
EQ (50%): The midpoint of the range.
25%: 25% of the range above the Low.
Current Hour Open: Displays the opening price of the current hour.
Projection: Lines extend forward (default: 24 bars) to project these levels into the future, aiding in real-time analysis.
Alerts: Triggers alerts when the price crosses any of the prior hour’s levels (High, 75%, EQ, 25%, Low).
Key Features
Time Zone Flexibility: Choose from options like UTC, New York, Tokyo, or London to align with your trading session.
Visual Customization:
Toggle visibility for each level (High, Low, 75%, EQ, 25%, Open, and Anchor).
Adjust line styles (Solid, Dashed, Dotted), colors, and widths.
Show or hide labels with adjustable sizes (Tiny, Small, Normal, Large).
Anchor Line: A vertical line marks the start of the prior hour, with optional labeling.
Alert Conditions: Set up notifications for price crossings to catch key moments without watching the chart.
Usage Tips
Use the High and Low as potential breakout levels, while 75%, EQ, and 25% act as intermediate support/resistance zones.
Trend Confirmation: Watch how price interacts with the EQ (50%) level to gauge momentum.
Session Planning: Adjust the time zone to match your market (e.g., "Europe/London" for FTSE trading).
Projection Offset: Extend or shorten the lines (via "Projection Offset") based on your chart timeframe.
Inputs
Time Zone: Select your preferred market time zone.
Anchor Settings: Show/hide the prior hour start line, style, color, width, and label.
Level Settings: Customize visibility, style, color, width, and labels for Open, High, 75%, EQ, 25%, and Low.
Display: Set projection length and label size.
SessionRangeLevels_v0.1SessionRangeLevels_v0.1
Overview:
SessionRangeLevels_v0.1 is a customizable Pine Script (v6) indicator designed to plot key price levels based on a user-defined trading session. It identifies the high and low of the session and calculates intermediate levels (75%, 50% "EQ", and 25%) within that range. These levels are projected forward as horizontal lines with accompanying labels, providing traders with dynamic support and resistance zones. The indicator supports extensive customization for session timing, time zones, line styles, colors, and more.
Key Features:
Session-Based Range Detection: Tracks the high and low prices during a specified session (e.g., 0600-0900) and updates them dynamically as the session progresses.
Customizable Levels: Displays High, 75%, EQ (50%), 25%, and Low levels, each with independent toggle options, styles (Solid, Dashed, Dotted), colors, and widths.
Session Anchor: Optional vertical line marking the session start, with customizable style, color, and width.
Projection Offset: Extends level lines forward by a user-defined number of bars (default: 24) for future price reference.
Labels: Toggleable labels for each level (e.g., "High," "75%," "EQ") with adjustable size (Tiny, Small, Normal, Large).
Time Zone Support: Aligns session timing to a selected time zone (e.g., America/New_York, UTC, Asia/Tokyo, etc.).
Alert Conditions: Triggers alerts when the price crosses any of the plotted levels (High, 75%, EQ, 25%, Low).
Inputs:
Session Time (HHMM-HHMM): Define the session range (e.g., "0600-0900" for 6:00 AM to 9:00 AM).
Time Zone: Choose from options like UTC, America/New_York, Europe/London, etc.
Anchor Settings: Toggle the session start line, adjust its style (default: Dotted), color (default: Black), and width (default: 1).
Level Settings:
High (Solid, Black, Width 2)
75% (Dotted, Blue, Width 1)
EQ/50% (Dotted, Orange, Width 1)
25% (Dotted, Blue, Width 1)
Low (Solid, Black, Width 2)
Each level includes options to show/hide, set style, color, width, and label visibility.
Projection Offset: Number of bars to extend lines (default: 24).
Label Size: Set label size (default: Small).
How It Works:
The indicator detects the start and end of the user-defined session based on the specified time and time zone.
During the session, it tracks the highest high and lowest low, updating the levels in real-time.
At the session start, it plots the High, Low, and intermediate levels (75%, 50%, 25%), projecting them forward.
Lines and labels dynamically adjust as new highs or lows occur within the session.
Alerts notify users when the price crosses any active level.
Usage:
Ideal for traders who focus on session-based strategies (e.g., London or New York open). Use it to identify key price zones, monitor breakouts, or set targets. Customize the appearance to suit your chart preferences and enable alerts for real-time trading signals.
Notes:
Ensure your chart’s timeframe aligns with your session duration for optimal results (e.g., 1-minute or 5-minute charts for short sessions).
The indicator overlays directly on the price chart for easy integration with other tools.

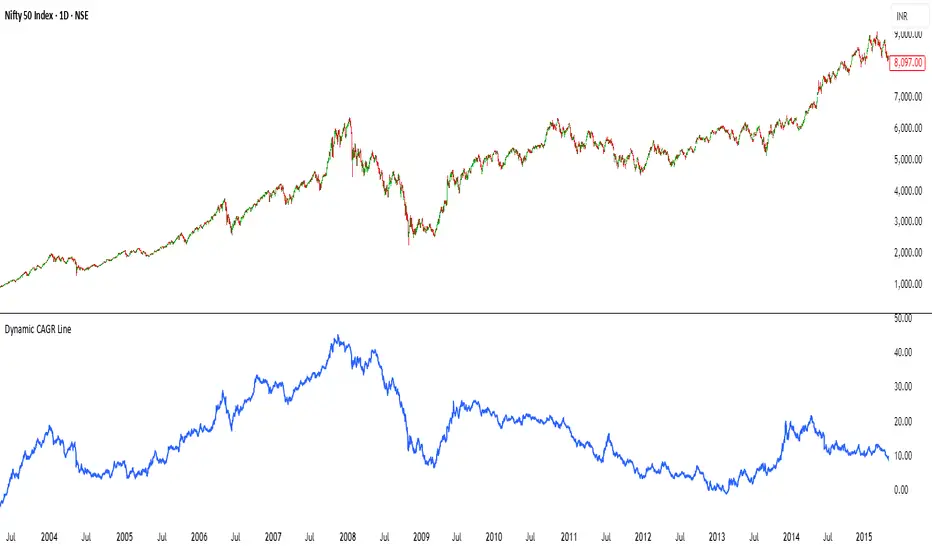
Dynamic CAGR LineIndicator: Dynamic CAGR Line
Overview
This Pine Script (version 6) creates a custom indicator called "Dynamic CAGR Moving Line," designed to calculate and display the Compound Annual Growth Rate (CAGR) in percentage terms for a financial instrument, such as a stock or cryptocurrency, based on a user-defined lookback period (default: 5 years). Unlike traditional overlays that plot directly on the price chart, this indicator appears in a separate pane below the chart, providing a clear visual of how the CAGR evolves over time with each new candle.
Purpose
The indicator helps traders and investors analyze the annualized growth rate of an asset’s price over a specified historical period. By plotting the CAGR as a percentage in a separate pane, users can easily track how the growth rate changes as new price data is added, offering insights into long-term performance trends without cluttering the price chart.
How It Works
User Input:
The script begins with an input parameter, lookback_years, allowing users to define the number of years (e.g., 5) to look back for the CAGR calculation. This is a floating-point value with a minimum of 1 and a step of 0.5, adjustable via the indicator’s settings in TradingView.
Timeframe Conversion:
Assuming a daily chart, the script converts the lookback years into a number of bars using bars_per_year = 252 (the average number of trading days in a year). The total lookback period in bars is calculated as lookback_bars = math.round(lookback_years * bars_per_year). For example, 5 years equals approximately 1260 bars.
Price Data:
For each candle, the start_price is fetched from the closing price lookback_bars ago (e.g., the close price from 5 years prior), using close .
The end_price is the current candle’s closing price, accessed via close.
CAGR Calculation:
The total return is computed as (end_price - start_price) / start_price, measuring the percentage change from the start price to the current price.
To avoid division-by-zero errors, a conditional check ensures start_price != 0; if it is, the return defaults to 0.
The CAGR is then calculated using the formula: math.pow(1 + total_return, 1 / lookback_years) - 1, which annualizes the total return over the lookback period.
The result is converted to a percentage by multiplying by 100 (cagr_percent = cagr * 100).
Plotting:
The CAGR percentage is plotted as a blue line in a separate pane using plot(). The line only appears after enough data exists (bar_index >= lookback_bars), otherwise it plots na (not available).
A label is added for each candle, displaying the current CAGR percentage (e.g., "CAGR: 5.23%") near the plotted value, styled with a blue background and white text.
Usage
Chart Setup: Apply the indicator to a daily chart with sufficient historical data (e.g., more than 5 years for the default setting). It’s designed for daily timeframes but can be adapted for others by adjusting bars_per_year (e.g., 52 for weekly).
Interpretation: A positive CAGR (e.g., 5%) indicates annualized growth, while a negative value (e.g., -2%) shows an annualized decline. A flat line at 0% suggests no net change over the lookback period.
Customization: Adjust lookback_years in the settings to analyze different periods (e.g., 3 or 10 years).
Notes
Ensure your chart has enough data to cover the lookback period, or the line won’t appear until sufficient bars are available.
For debugging, you can temporarily plot start_price and end_price on the main chart to verify the calculation inputs.
Premarket High/Low Breakout AlertsPremarket High/Low Breakout Alerts
Description: This custom TradingView indicator helps you track premarket breakouts and breakdowns for a list of selected stocks. The indicator monitors the premarket session and sends an alert every time the stock's price breaks above the premarket high or below the premarket low.
Key Features:
Track Multiple Stocks: Easily monitor multiple stocks (e.g., AAPL, TSLA, NVDA, etc.) and get alerts when they break premarket levels.
Premarket Session Monitoring: The indicator checks for price movements during the premarket session (4:00 AM to 9:30 AM EST).
Customizable Ticker List: Modify the list of tickers directly from the TradingView settings to suit your daily trading needs.
Breakout and Breakdown Alerts: Receive instant alerts for both breakout (above premarket high) and breakdown (below premarket low) conditions.
Plot Premarket Levels: The premarket high and low levels are plotted on the chart for easy reference.
How to Use:
Add this indicator to your chart.
Go to the indicator settings and input your desired stock tickers (e.g., AAPL, TSLA, MSFT).
The indicator will automatically track the premarket levels and send alerts when those levels are broken.
Customize the tickers daily if needed.
Ideal For:
Day Traders who want to track premarket movements.
Swing Traders looking for strong breakouts from premarket levels.
Scalpers who need quick alerts to catch price action early.

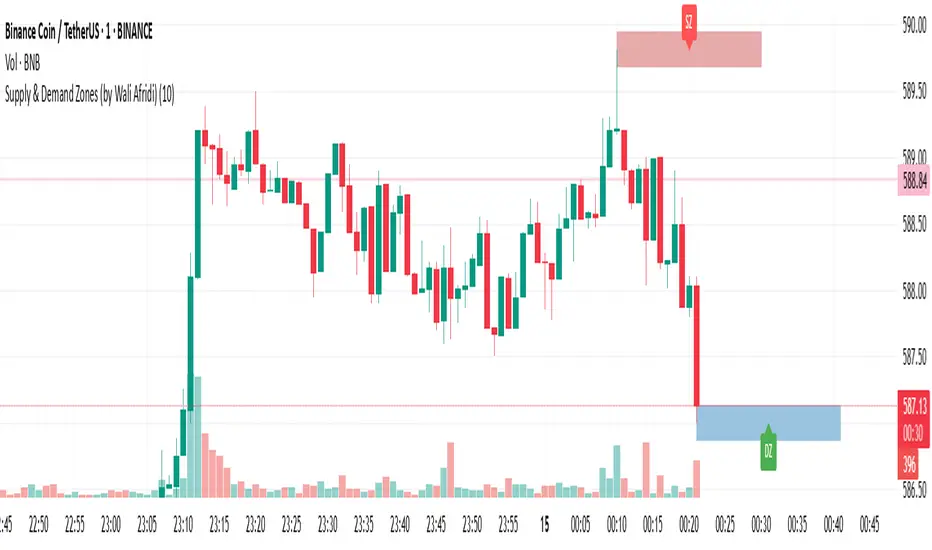
Supply & Demand Zones (by Wali Afridi)Description:
🚀 This indicator accurately detects Supply & Demand Zones by identifying swing highs and lows. It plots a single clean line for each zone and labels them as "SZ" (Supply Zone) and "DZ" (Demand Zone), ensuring a clear and minimalistic chart.
🔹 Features:
✅ Auto-detects recent Supply & Demand Zones
✅ Plots clean horizontal lines for the latest zones
✅ Displays "SZ" above the supply line & "DZ" below the demand line
✅ No duplicate labels—only one label per zone
✅ Minimal & clutter-free visualization
How to Use:
1️⃣ Add the indicator to your chart
2️⃣ Watch for Supply Zones (SZ) appearing above red lines – These indicate potential resistance areas where price may reverse or consolidate.
3️⃣ Watch for Demand Zones (DZ) appearing below green lines – These indicate strong support areas where price may bounce.
4️⃣ Use with other confirmations (Price Action, SMC, Volume) for better accuracy.
⚠️ Disclaimer:
This script is for educational purposes only and should not be considered financial advice. Always backtest and use risk management before applying it to live trading.