CMF and Scaled EFI OverlayCMF and Scaled EFI Overlay Indicator
Overview
The CMF and Scaled EFI Overlay indicator combines the Chaikin Money Flow (CMF) and a scaled version of the Elder Force Index (EFI) into a single chart. This allows traders to analyze both indicators simultaneously, facilitating better insights into market momentum and volume dynamics , specifically focusing on buying/selling pressure and momentum , without compromising the integrity of either indicator.
Purpose
Chaikin Money Flow (CMF): Measures buying and selling pressure by evaluating price and volume over a specified period. It indicates accumulation (buying pressure) when values are positive and distribution (selling pressure) when values are negative.
Elder Force Index (EFI): Combines price changes and volume to assess the momentum behind market moves. Positive values indicate upward momentum (prices rising with strong volume), while negative values indicate downward momentum (prices falling with strong volume).
By scaling the EFI to match the amplitude of the CMF, this indicator enables a direct comparison between pressure and momentum , preserving their shapes and zero crossings. Traders can observe the relationship between price movements, volume, and momentum more effectively, aiding in decision-making.
Understanding Pressure vs. Momentum
Chaikin Money Flow (CMF):
- Indicates the level of demand (buying pressure) or supply (selling pressure) in the market based on volume and price movements.
- Accumulation: When institutional or large investors are buying significant amounts of an asset, leading to an increase in buying pressure.
- Distribution: When these investors are selling off their holdings, increasing selling pressure.
Elder Force Index (EFI):
- Measures the strength and speed of price movements, indicating how forceful the current trend is.
- Positive Momentum: Prices are rising quickly, indicating a strong uptrend.
- Negative Momentum: Prices are falling rapidly, indicating a strong downtrend.
Understanding the difference between pressure and momentum is crucial. For example, a market may exhibit strong buying pressure (positive CMF) but weak momentum (low EFI), suggesting accumulation without significant price movement yet.
Features
Overlay of CMF and Scaled EFI: Both indicators are plotted on the same chart for easy comparison of pressure and momentum dynamics.
Customizable Parameters: Adjust lengths for CMF and EFI calculations and fine-tune the scaling factor for optimal alignment.
Preserved Indicator Integrity: The scaling method preserves the shape and zero crossings of the EFI, ensuring accurate analysis.
How It Works
CMF Calculation:
- Calculates the Money Flow Multiplier (MFM) and Money Flow Volume (MFV) to assess buying and selling pressure.
- CMF is computed by summing the MFV over the specified length and dividing by the sum of volume over the same period:
CMF = (Sum of MFV over n periods) / (Sum of Volume over n periods)
EFI Calculation:
- Calculates the EFI using the Exponential Moving Average (EMA) of the price change multiplied by volume:
EFI = EMA(n, Change in Close * Volume)
Scaling the EFI:
- The EFI is scaled by multiplying it with a user-defined scaling factor to match the CMF's amplitude.
Plotting:
- Both the CMF and the scaled EFI are plotted on the same chart.
- A zero line is included for reference, aiding in identifying crossovers and divergences.
Indicator Settings
Inputs
CMF Length (`cmf_length`):
- Default: 20
- Description: The number of periods over which the CMF is calculated. A higher value smooths the indicator but may delay signals.
EFI Length (`efi_length`):
- Default: 13
- Description: The EMA length for the EFI calculation. Adjusting this value affects the sensitivity of the EFI to price changes.
EFI Scaling Factor (`efi_scaling_factor`):
- Default: 0.000001
- Description: A constant used to scale the EFI to match the CMF's amplitude. Fine-tuning this value ensures the indicators align visually.
How to Adjust the EFI Scaling Factor
Start with the Default Value:
- Begin with the default scaling factor of `0.000001`.
Visual Inspection:
- Observe the plotted indicators. If the EFI appears too large or small compared to the CMF, proceed to adjust the scaling factor.
Fine-Tune the Scaling Factor:
- Increase or decrease the scaling factor incrementally (e.g., `0.000005`, `0.00001`, `0.00005`) until the amplitudes of the CMF and EFI visually align.
- The optimal scaling factor may vary depending on the asset and timeframe.
Verify Alignment:
- Ensure that the scaled EFI preserves the shape and zero crossings of the original EFI.
- Overlay the original EFI (if desired) to confirm alignment.
How to Use the Indicator
Analyze Buying/Selling Pressure and Momentum:
- Positive CMF (>0): Indicates accumulation (buying pressure).
- Negative CMF (<0): Indicates distribution (selling pressure).
- Positive EFI: Indicates positive momentum (prices rising with strong volume).
- Negative EFI: Indicates negative momentum (prices falling with strong volume).
Look for Indicator Alignment:
- Both CMF and EFI Positive:
- Suggests strong bullish conditions with both buying pressure and upward momentum.
- Both CMF and EFI Negative:
- Indicates strong bearish conditions with selling pressure and downward momentum.
Identify Divergences:
- CMF Positive, EFI Negative:
- Buying pressure exists, but momentum is negative; potential for a bullish reversal if momentum shifts.
- CMF Negative, EFI Positive:
- Selling pressure exists despite rising prices; caution advised as it may indicate a potential bearish reversal.
Confirm Signals with Other Analysis:
- Use this indicator in conjunction with other technical analysis tools (e.g., trend lines, support/resistance levels) to confirm trading decisions.
Example Usage
Scenario 1: Bullish Alignment
- CMF Positive: Indicates accumulation (buying pressure).
- EFI Positive and Increasing: Shows strengthening upward momentum.
- Interpretation:
- Strong bullish signal suggesting that buyers are active, and the price is likely to continue rising.
- Action:
- Consider entering a long position or adding to existing ones.
Scenario 2: Bearish Divergence
- CMF Negative: Indicates distribution (selling pressure).
- EFI Positive but Decreasing: Momentum is positive but weakening.
- Interpretation:
- Potential bearish reversal; price may be rising but underlying selling pressure suggests caution.
- Action:
- Be cautious with long positions; consider tightening stop-losses or preparing for a possible trend reversal.
Tips
Adjust for Different Assets:
- The optimal scaling factor may differ across assets due to varying price and volume characteristics.
- Always adjust the scaling factor when analyzing a new asset.
Monitor Indicator Crossovers:
- Crossings above or below the zero line can signal potential trend changes.
Watch for Divergences:
- Divergences between the CMF and EFI can provide early warning signs of trend reversals.
Combine with Other Indicators:
- Enhance your analysis by combining this overlay with other indicators like moving averages, RSI, or Ichimoku Cloud.
Limitations
Scaling Factor Sensitivity:
- An incorrect scaling factor may misalign the indicators, leading to inaccurate interpretations.
- Regular adjustments may be necessary when switching between different assets or timeframes.
Not a Standalone Indicator:
- Should be used as part of a comprehensive trading strategy.
- Always consider other market factors and indicators before making trading decisions.
Disclaimer
No Guarantee of Performance:
- Past performance is not indicative of future results.
- Trading involves risk, and losses can exceed deposits.
Use at Your Own Risk:
- This indicator is provided for educational purposes.
- The author is not responsible for any financial losses incurred while using this indicator.
Code Summary
//@version=5
indicator(title="CMF and Scaled EFI Overlay", shorttitle="CMF & Scaled EFI", overlay=false)
cmf_length = input.int(20, minval=1, title="CMF Length")
efi_length = input.int(13, minval=1, title="EFI Length")
efi_scaling_factor = input.float(0.000001, title="EFI Scaling Factor", minval=0.0, step=0.000001)
// --- CMF Calculation ---
ad = high != low ? ((2 * close - low - high) / (high - low)) * volume : 0
mf = math.sum(ad, cmf_length) / math.sum(volume, cmf_length)
// --- EFI Calculation ---
efi_raw = ta.ema(ta.change(close) * volume, efi_length)
// --- Scale EFI ---
efi_scaled = efi_raw * efi_scaling_factor
// --- Plotting ---
plot(mf, color=color.green, title="CMF", linewidth=2)
plot(efi_scaled, color=color.red, title="EFI (Scaled)", linewidth=2)
hline(0, color=color.gray, title="Zero Line", linestyle=hline.style_dashed)
- Lines 4-6: Define input parameters for CMF length, EFI length, and EFI scaling factor.
- Lines 9-11: Calculate the CMF.
- Lines 14-16: Calculate the EFI.
- Line 19: Scale the EFI by the scaling factor.
- Lines 22-24: Plot the CMF, scaled EFI, and zero line.
Feedback and Support
Suggestions: If you have ideas for improvements or additional features, please share your feedback.
Support: For assistance or questions regarding this indicator, feel free to contact the author through TradingView.
---
By combining the CMF and scaled EFI into a single overlay, this indicator provides a powerful tool for traders to analyze market dynamics more comprehensively. Adjust the parameters to suit your trading style, and always practice sound risk management.
Cerca negli script per "crossover债券是什么"

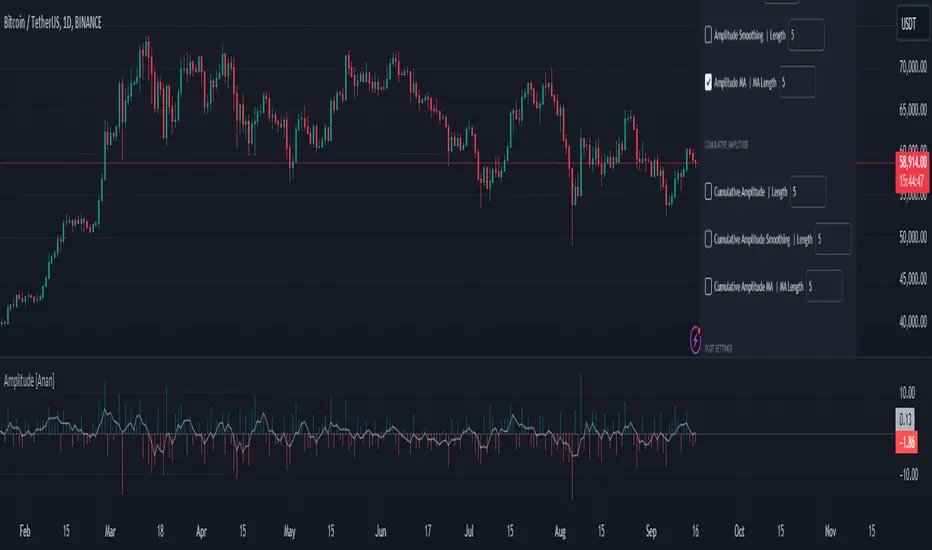
Amplitude [Anan]The Amplitude indicator calculates and visualizes both the amplitude and cumulative amplitude of price movements, providing traders with insights into price volatility and trend strength. By distinguishing between positive and negative amplitude movements, this indicator aids in identifying bullish and bearish sentiments, potential reversal points, and confirming trend directions.
█ Main Formulas
‣ Amplitude = High - Low
‣ Cumulative Amplitude = sum of Amplitude over the specified lookback period
‣ Percentage Amplitude = (Amplitude / Open) × 100%
High: Candle high (or highest high when lookback > 1)
Low: Candle low (or lowest low when lookback > 1)
Open: Open price of the first candle in the lookback period
█ Key Features
✦Dual Amplitude Calculations:
Amplitude: Reflects price range and direction over a short-term period.
Cumulative Amplitude: Aggregates amplitude over a longer period for broader trend analysis.
✦Customizable Parameters: Adjust lookback periods, smoothing options, moving averages and Alerts.
✦Direction Separation: Distinguish between positive and negative amplitude movements to identify market sentiment.
✦Flexible Visualization: Customizable colors and plot styles for enhanced chart readability.
✦Alert System: Generate signals based on amplitude direction and moving average crossovers
█ How to Use and Interpret
✦Understanding Amplitude and Cumulative Amplitude:
‣Amplitude: Measures the price range (high - low) over a specified short-term period.
‣Cumulative Amplitude: Aggregates amplitude over a defined longer-term period.
‣Percentage Representation: shows amplitude relative to the open price from `amp_length` bars ago, providing a normalized view.
‣Interpretation:
Large Amplitude Values: Indicate high volatility.
Small Amplitude Values: Indicate low volatility.
✦Trend Identification:
‣Uptrend: Consistently positive amplitudes and upward-moving averages.
‣Downtrend: Consistently negative amplitudes and downward-moving averages.
✦Overbought/Oversold Conditions:
‣High Positive Amplitude: May indicate overbought conditions and potential reversals.
‣High Negative Amplitude: May indicate oversold conditions and potential reversals.
✦Volatility Analysis:
‣High Amplitude Values: Suggest increased market volatility.
‣Low Amplitude Values: Suggest reduced market volatility.
✦Signal Confirmation:
‣Moving Average Crossovers: Confirm the strength and direction of trends, aiding in informed trading decisions.
✦Trading Strategies:
‣ Breakout Trading: Large increases in amplitude can signal potential breakouts.
‣ Mean Reversion: Extreme amplitude values may indicate upcoming price corrections.
‣ Volatility-Based Strategies: Adjust position sizes or trading frequency based on amplitude magnitudes.
‣ Multi-Timeframe Analysis: Compare amplitudes across different timeframes for a comprehensive market view.
█ Customization Tips
‣ Lookback Periods: Experiment with different periods to suit your trading style and asset characteristics.
‣ Smoothing Settings: Adjust to balance responsiveness and noise reduction.
‣ Percentage Amplitude: Use for normalized comparisons across different price levels.
5-9-20-100 Day EMAIndicator Name: "5-9-20-100 Day EMA"
Purpose: This indicator plots four key EMAs (5, 9, 20, and 100-day) on a daily chart, providing a clear visualization of both short-term and long-term trends. The EMAs serve as critical triggers for identifying potential entry and exit points based on price interactions with these moving averages.
Technical Details:
Version: Pine Script v5
EMAs Used:
5-Day EMA (Lime): Captures the most recent price trends, useful for identifying short-term momentum.
9-Day EMA (Yellow): Offers a slightly broader view, often used to confirm the short-term trend.
20-Day EMA (Orange): Represents a medium-term trend, commonly used as a signal for trend reversals.
100-Day EMA (Red): Indicates the long-term trend, often serving as strong support or resistance levels.
Trigger Points:
Crossovers: Price crossing above or below these EMAs can trigger potential buy or sell signals.
Convergence/Divergence: The interaction between the EMAs, such as a faster EMA crossing a slower one, can signal trend reversals or continuations.
Utility: This indicator is ideal for traders who rely on EMA crossovers and the relationship between different EMAs to make informed trading decisions.

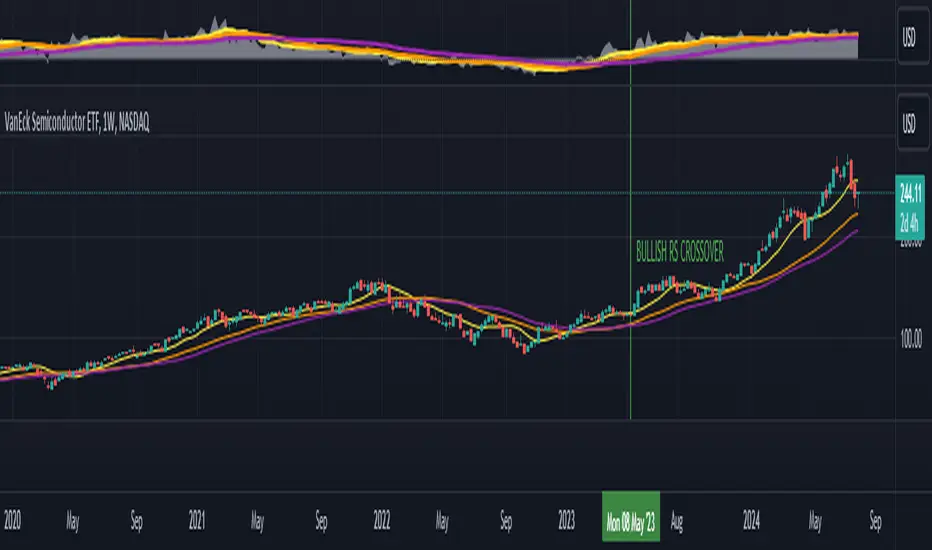
Relative Strength with 3 SMAMansfield RS with 3 SMAs
Overview
The Mansfield Relative Strength (RS) indicator with three Simple Moving Averages (SMAs) enhances traditional RS analysis by adding more clarity and precision to trend identification. This personalized version aims to define RS trends more clearly and end them sooner, helping traders make better-informed decisions.
Key Features
Relative Strength Calculation:
Comparison: Calculates the RS of a chosen symbol against a benchmark (default: S&P 500).
Normalization: Uses the stock’s closing price divided by the closing price of the benchmark over a specified period.
Three SMAs:
Periods: Configurable periods for three SMAs (default: 10, 20, 50).
Trend Smoothing: SMAs help smooth the RS line, making it easier to spot trends and potential reversals.
Visualization:
Area Plot: The RS line is displayed as an area plot.
Color Coding: Different colors for each SMA to distinguish them easily (yellow, orange, purple).
Customization Options:
Comparative Symbol: Choose any benchmark symbol.
Period Adjustment: Customize the periods for both the RS calculation and the SMAs.
Visibility: Option to show or hide the SMAs.
How to Use
Setup:
Add to Chart: Apply the indicator to your TradingView chart.
Customize: Adjust the comparative symbol, RS period, and SMA periods as per your preference.
Interpretation:
Rising RS Line: Indicates the stock is outperforming the benchmark.
Falling RS Line: Suggests underperformance.
SMA Crossovers: Watch for the RS line crossing above or below the SMAs to signal potential buy or sell points.
Trend Direction: SMAs help confirm the trend direction. A rising RS line above the SMAs indicates a strong relative performance.
Trading Strategy:
Trend Confirmation: Use SMA crossovers to confirm trends.
Divergence: Identify divergences between the price action and the RS line for potential reversal signals.
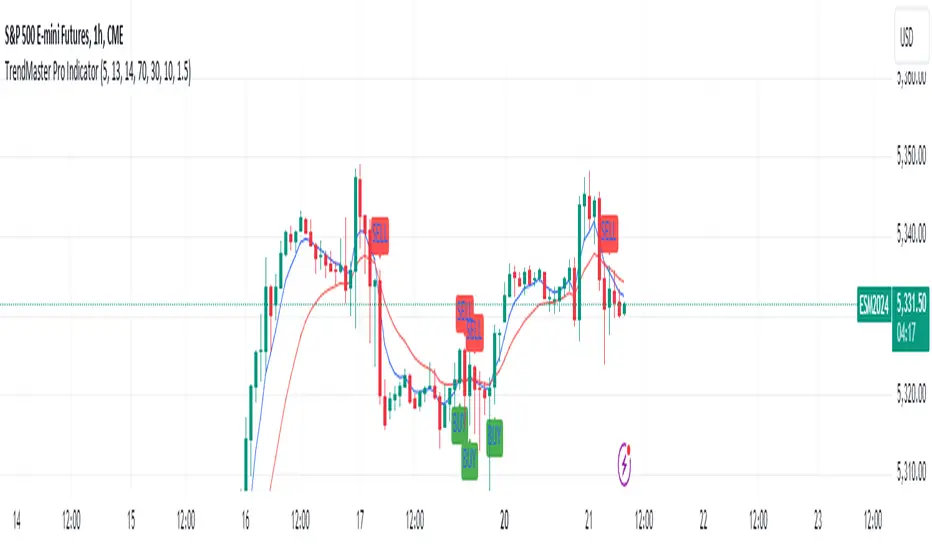
TrendMaster Pro IndicatorThe TrendMaster Pro Indicator is an advanced tool designed to assist traders in identifying potential buy and sell signals by leveraging a combination of exponential moving averages (EMAs), the relative strength index (RSI), and a custom volatility filter. This powerful indicator is suitable for traders of all levels and can be applied to various markets and timeframes, offering flexibility and reliability in trading decisions.
Key Features:
EMA Crossover Detection:
Utilizes a 5-period (short) and 13-period (long) EMA crossover to detect trend changes.
A bullish signal is generated when the 5 EMA crosses above the 13 EMA, indicating an upward trend.
A bearish signal is generated when the 5 EMA crosses below the 13 EMA, indicating a downward trend.
RSI Confirmation:
Incorporates a 14-period RSI to confirm the strength of detected trends.
A buy signal is validated when the RSI is above 50, indicating bullish momentum.
A sell signal is validated when the RSI is below 50, indicating bearish momentum.
Custom Volatility Filter:
Employs a volatility filter based on the standard deviation of closing prices over a specified period (default is 10 periods).
Ensures signals are only generated during periods of significant market movement, reducing noise and false signals.
The volatility threshold can be adjusted to suit different market conditions and trading styles.
How It Works:
EMA Crossover:
The TrendMaster Pro Indicator continuously monitors the crossover between the 5-period and 13-period EMAs.
A crossover event triggers the initial signal, suggesting a potential change in trend direction.
RSI Confirmation:
After an EMA crossover, the indicator checks the 14-period RSI value to confirm the trend's strength.
This confirmation step helps filter out weak or unreliable signals, ensuring only high-probability trades are considered.
Volatility Filter:
The indicator calculates the standard deviation of closing prices over the selected period to measure market volatility.
Signals are only generated if the volatility exceeds the user-defined threshold, ensuring that trades are made in active and dynamic market conditions.
How to Use:
Apply the Indicator:
Add the TrendMaster Pro Indicator to your trading chart via the TradingView platform.
Customize the EMA, RSI, and volatility settings according to your trading preferences and the specific market conditions.
Interpret Buy and Sell Signals:
Buy Signal: Look for a buy signal when the 5 EMA crosses above the 13 EMA, the RSI is above 50, and volatility exceeds the threshold. This combination indicates a strong bullish trend.
Sell Signal: Look for a sell signal when the 5 EMA crosses below the 13 EMA, the RSI is below 50, and volatility exceeds the threshold. This combination indicates a strong bearish trend.
Adjust Settings:
The default settings can be fine-tuned to match your trading strategy. Adjust the EMA lengths, RSI period, and volatility threshold to optimize the indicator for different assets and timeframes.
Unique Features:
Comprehensive Trend Detection: Combines multiple indicators (EMAs, RSI, volatility) to provide a holistic view of market trends.
Customizable: Easily adjustable settings allow traders to tailor the indicator to their specific needs and preferences.
Noise Reduction: The volatility filter ensures signals are generated only during significant market movements, improving signal accuracy and reliability.
Conclusion:
The TrendMaster Pro Indicator is a versatile and powerful tool that can enhance your trading strategy by providing clear and reliable buy and sell signals. Whether you are a day trader or a swing trader, this indicator can help you navigate the markets with confidence and precision. Add the TrendMaster Pro Indicator to your toolkit today and experience a new level of trading efficiency and effectiveness.
OI Volume Oscillator Cross DynamicsThe OI Volume Oscillator Cross Dynamics is a custom indicator designed to analyze the relationship between Open Interest (OI) and Volume Oscillator in the cryptocurrency markets. This tool aims to assist traders in identifying potential market sentiment shifts, enabling them to make informed trading decisions based on the dynamic interplay of these key market components.
Key Components:
Open Interest (OI): This component represents the total number of outstanding derivative contracts, such as futures and options, that have not been settled. Open Interest provides insights into market participation and trader commitment, offering a broader perspective on the flow of money into the market.
Volume Oscillator: The Volume Oscillator is a momentum indicator that showcases the difference between two volume moving averages. It is instrumental in identifying bullish or bearish market trends by providing insights into buying and selling pressure in the market.
Functional Dynamics:
Crossover Analysis: The indicator identifies points where the Volume Oscillator crosses above or below the Open Interest, marking potential shifts in market sentiment. These crossover points are visually represented, making them easily identifiable for analysis.
Visual Cues: The indicator uses visual shapes and colors to enhance interpretability. Bullish crossovers are marked with green upward triangles, while bearish crossovers are represented by red downward triangles.
Customization: The indicator allows for customization of the Volume Oscillator’s sensitivity through a multiplier, enabling traders to adjust the indicator according to their trading strategy and market outlook.
Usage Guidelines:
Bullish Scenario: A crossover of the Volume Oscillator above the Open Interest is interpreted as a bullish signal, indicating potential upward price movement due to increased buying pressure or trading activity.
Bearish Scenario: A crossover of the Volume Oscillator below the Open Interest is seen as a bearish signal, suggesting potential downward price movement due to increased selling pressure or reduced trading activity.
Conclusion:
The OI Volume Oscillator Cross Dynamics indicator is designed to provide traders with a nuanced perspective of market activity through the combined analysis of Open Interest and Volume Oscillator. Its design aims to offer valuable insights, allowing for a strategic approach to trading based on the observed market dynamics.
The code is open source and utilizes Binance info but you can alter the code to meet your needs to go beyond just Bitcoin if needed.

Dee EMA 5.0
1. Indicator Features:
- The indicator can plot four different sets of EMA on a chart.
- The EMA values can be displayed on the chart with their respective names (e.g., ema9, ema20, etc.).
- The indicator allows customization of the EMA values.
2. Purpose of Dee_EMA 5.0:
- Dee_EMA 5.0 is a unique EMA indicator specially designed for traders to provide better insights and aid in trading decisions.
- The primary reason for building this indicator is to address the challenge of managing multiple time frames while using normal EMA tables.
- Traditional EMA tables might not show all EMA values across different time frames simultaneously, leading to time-consuming processes like shifting time frames and refreshing charts.
- Dee_EMA 5.0 solves this issue by displaying EMA values for different time frames in one table, allowing traders to make quick judgments without repeatedly changing time frames and refreshing charts.
3. Importance of Different Time Frame EMA Values:
- Different time frames EMA values are crucial in trading because they provide valuable insights into the market dynamics at various levels.
- When using shorter time frames (e.g., 1-minute), EMA values can help identify short-term trends, support, and resistance levels.
- On the other hand, using larger time frames (e.g., 5-minute or 15-minute) provides more data and increases the accuracy of EMA-based analysis, enabling traders to identify longer-term trends and potential price movements.
4. EMA Crossover Table:
- Traders often prefer a clutter-free chart without too many lines, but they still need access to EMA values for analysis.
- The EMA table and EMA crossover table serve this purpose by providing EMA values and EMA crossover information in a structured table format.
- With the EMA crossover table, traders can quickly check EMA values and crossovers across different time frames without having to switch time frames repeatedly, saving time and facilitating faster decision-making during trading.
In summary, Dee_EMA 5.0 is an EMA indicator designed to help traders efficiently analyze EMA values across different time frames, allowing for faster and more informed trading decisions. The EMA crossover table provides additional convenience by presenting EMA crossovers without cluttering the chart.

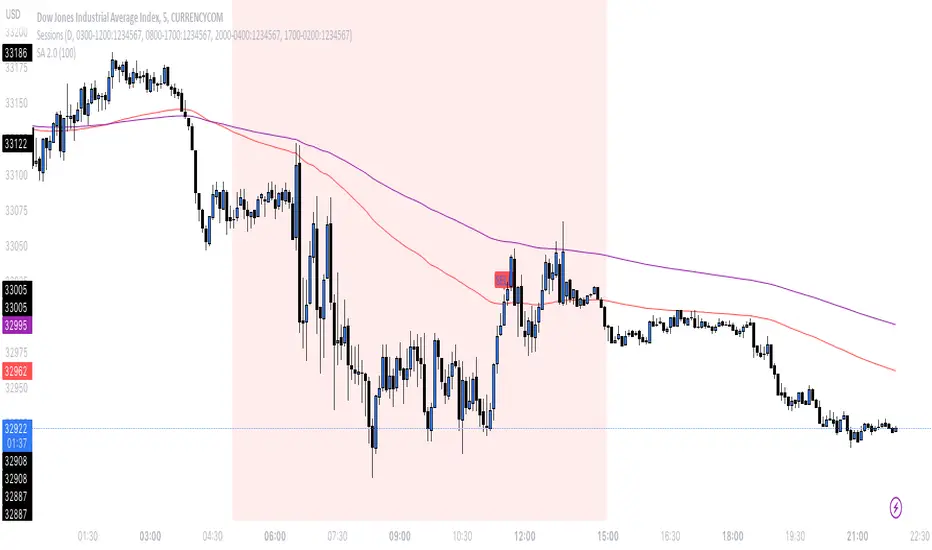
SA 2.0The 100/200 EMA crossover strategy is a popular trend-following strategy used in technical analysis. It aims to identify potential buy and sell signals based on the crossover of two exponential moving averages (EMAs), specifically the 100-period EMA and the 200-period EMA. This strategy is designed to capture the momentum of the market and take advantage of sustained trends in the price of US30. This strategy can also work on other instruments, just backtest the winrate.
How it Works:
Timeframe Selection: The strategy is optimized for the US30 index and is implemented on both the 5-minute and 3-minute charts. These shorter timeframes provide more frequent trading opportunities and allow for quicker decision-making.
EMA Crossover: The strategy focuses on the crossover of the 100-period EMA and the 200-period EMA. When the 100 EMA crosses above the 200 EMA, it generates a bullish signal, indicating a potential upward trend. Conversely, when the 100 EMA crosses below the 200 EMA, it generates a bearish signal, suggesting a potential downward trend.
Rejection Confirmation: To filter out false signals and increase the reliability of the strategy, it incorporates a rejection confirmation. After the initial crossover, the strategy looks for price rejections near the 100 EMA. A rejection occurs when the price briefly moves below the 100 EMA and then quickly bounces back above it, indicating potential support and a possible continuation of the trend. It is during this rejection that the strategy generates the buy or sell signal.
Buy and Sell Signals: When a rejection occurs after the crossover, the strategy generates a buy signal if the rejection is above the 100 EMA. This suggests that the price is likely to continue its upward momentum. On the other hand, a sell signal is generated if the rejection occurs below the 100 EMA, indicating a potential continuation of the downward trend. These signals help traders identify favorable entry points for long or short positions.
Risk Management: As with any trading strategy, proper risk management is crucial. Traders can use stop-loss orders to limit potential losses in case the market moves against their positions. Additionally, setting profit targets or trailing stops can help secure profits as the trend progresses.
It's important to note that no trading strategy guarantees success, and it's recommended to test the strategy on historical data or in a demo trading environment before applying it with real funds. Furthermore, regular monitoring and adjustment may be necessary to adapt to changing market conditions.
Disclaimer: This description is for informational purposes only and should not be considered as financial advice. Trading carries risks, and individuals should exercise caution and consult with a qualified financial professional before making any investment decisions.
ALMA/EMA/SRSI Strategy + IndicatorBack with another great high hit rate strategy!!
Disclaimer* This strategy was sampled using source code written by @ClassicScott , as referred to in the script, there is a clear line where the source code was scripted by myself.
This Strategy consists of three key factors, the ALMA, EMA crossover, and a Stochastic Rsi
ALMA: The Alma is the step line shown, turning green and red at select times. This average value gives general oversight of the macro movement of price action. and this particular one was coded by Mr.ClassicScott.
EMA crossover: At the input screen you are given an option of the fast and slow ema's. The default is solely for the hit rate and correlation to the Alma of this strategy. The arrows you see depicted on the chart are the crossover events happening.
Stochastic Rsi: The Stochastic Rsi is a stochastic value, using data sampled from the rsi. The use of this indicator in my strategy is to prevent entries when too overbought and oversold, as well as closures and vice versa, to prevent holding bags either way.
Fixed % TP: In the input screen you are given a take profit and stop loss percentage, for good R/R the hit rate will take a notch down, but with no R/R it will be near perfect.
How to use this:
Add it to your chart to get the strategy inputs. (The strategy is really only useful on a 15min TF. However the indicator within it can be used on anything at anytime!)
Watch the yellow and aqua moving averages, these are your ema's and crossover's will trigger signals based on your integer inputs.
Find Correlation between other leading indicators, as well as crossover's down/up and a red/green alma.
DO NOT use the arrows as buy/sell signals. These are simply to show ema's are crossing under or over. Momentum indicator's paired with this can be useful to determine if it could be a buy signal or sell signal.
Cheat Code's Notes:
Almost at 1000 boosts!!! I appreciate the support from everyone and I will keep trying my best to deliver quality strategies for the people.
-Cheat Code
BYBIT:BTCUSDT

SSL HYBRID AdvancedSSL HYBRID Advanced
SSL Hybrid is an Advanced version of the default SSL Hybrid by Mihkel00.
Multiple Indicators
MACD Crossover Signals
EMA 200
Bollinger Band
Bollinger Band Squeeze
ADX Crossover and ADX level
CCI Over Brought /Sold
Stochastic Over Brought /Sold
RSI Over Brought /Sold
CREDITS
QQE MOD byMihkel00
SSL Hybrid by Mihkel00
Waddah Attar Explosion by shayankm
Support Resistance LonesomeTheBlue
Indicators On Chart
QQE MOD is plotted as Dot below and above the candle and also as Background
QQE line is plotted and can be used as crossover to find trend. Flat movement of QQE is Sideways
Weak ADX is plotted as a Background color. Same can be verified using Bollinger band Squeeze.
EMA crossover can be plotted by selecting MTF MA(multi time frame moving average indicator) Area plot is provided.
CCI , Stochastic, RSI signals provided in the table option
WAE (volume indicator ) is shown in Table
EMA 200 is plotted and color Represents ADX level and direction. Plots on EMA 200 are ADX crossovers
MACD crossovers are represented by Triangles above and below Candles
Support Resistance levels are plotted (change settings)
Pivot Points are plotted (change settings)
Bollinger Bands Plotted
EMA 20 and EMA 50 plotted with AREA for additional confirmation
Buy: When the table option shows completely Blue signals in all indicators
Sell: When the table option shows completely Pink signals in all indicators
WARNING not recommended for lower time frames. Use at your own Risk.
Updates will be released shortly if any. please provide your suggestions to make it more functional indicator.

Hull MAThis Hull MA uses the default settings of the built-in MA. The basic idea is that we are in a buy setup when hull is below price, and a sell setup when hull is above price. The indicator is extended with slightly change in contrast when moving average is declining and it plot the ma/price crossovers: green dot when a buy setup is appearing, and red dot when a sell setup is forming. It is possible to hide crossovers in the option panel.
Three alert conditions is added "Hull MA cross", "Hull MA sell" and "Hull MA buy". I use "Hull MA cross" on slow frames (2w, M) and "Hull MA buy/sell" on faster frames.

EMA 200 MultiTF G/R + Cross Alerts by LifeHack Trader1. Indicator Setup
The script starts by defining the version of Pine Script (v5) and creating an indicator called "EMA 200 MultiTF G/R + Cross Alerts by LifeHack Trader."
The overlay=true parameter ensures that the indicator is plotted directly on the price chart.
2. Function to Get EMA200
A custom function getEma200 is defined to retrieve the 200-period Exponential Moving Average (EMA) for a specified timeframe (tf).
This function uses the request.security function to fetch the close price's EMA from different timeframes.
3. Calculate EMA200 for Multiple Timeframes
The script calculates the EMA200 for four timeframes: 15 minutes ("15"), 1 hour ("60"), 4 hours ("240"), and 1 day ("D").
These values are stored in variables (ema15, ema1h, ema4h, ema1d) and represent the EMA for each timeframe.
4. Determine Price Above or Below EMA200 (G/R)
For each timeframe, the script checks whether the closing price is above or below the EMA200.
It uses boolean checks to determine if the price is above the EMA200, assigning the status "G" (Green) for above and "R" (Red) for below.
5. Cross Signal Detection (Up/Down)
The script detects crossovers and crossunders between the price and EMA200 for each timeframe.
A crossover signal is detected when the price crosses above the EMA200 (bullish), and a crossunder signal is detected when the price crosses below the EMA200 (bearish).
These signals are stored in separate variables (crossUp, crossDown).
6. Display a Table with G/R Status and Cross Alerts
A table is created and displayed in the top-right corner of the chart. The table shows the status (G or R) for each timeframe and the cross signal (▲ for crossover, ▼ for crossunder, or - for no cross event).
The table is updated with the respective values for each timeframe every time a new bar is formed.
7. Alert Conditions
The script defines alert conditions based on the crossovers and crossunders.
When a price crosses above the EMA200 (cross-up), an alert is triggered for a potential buy opportunity. When the price crosses below the EMA200 (cross-down), an alert is triggered for a potential sell opportunity.
Alerts are configured for each timeframe (15 minutes, 1 hour, 4 hours, and 1 day).
This script provides a comprehensive system for monitoring price action relative to the EMA200 on multiple timeframes, highlighting crossovers, and delivering visual feedback and alerts based on the price's relationship with the EMA.

ZenAlgo - ADXThis open-source indicator builds upon the official Average Directional Index (ADX) implementation by TradingView. It preserves the core logic of the original ADX while introducing additional visualization features, configurability, and analytical overlays to assist with directional strength analysis.
Core Calculation
The script computes the ADX, +DI, and -DI based on smoothed directional movement and true range over a user-defined length. The smoothing is performed using Wilder’s method, as in the original implementation.
True Range is calculated from the current high, low, and previous close.
Directional Movement components (+DM, -DM) are derived by comparing the change in highs and lows between consecutive bars.
These values are then smoothed, and the +DI and -DI are expressed as percentages of the smoothed True Range.
The difference between +DI and -DI is normalized to derive DX, which is further smoothed to yield the ADX value.
The indicator includes a selectable signal line (SMA or EMA) applied to the ADX for crossover-based visualization.
Visualization Enhancements
Several plots and conditions have been added to improve interpretability:
Color-coded histograms and lines visualize DI relative to a configurable threshold (default: 25). Colors follow the ZenAlgo color scheme.
Dynamic opacity and gradient coloring are used for both ADX and DI components, allowing users to distinguish weak/moderate/strong directional trends visually.
Mirrored ADX is internally calculated for certain overlays but not directly plotted.
The script also provides small circles and diamonds to highlight:
Crossovers between ADX and its signal line.
DI crossing above or below the 25 threshold.
Rising ADX confirmed by rising DI values, with point size reflecting ADX strength.
Divergence Detection
The indicator includes optional detection of fractal-based divergences on the DI curve:
Regular and hidden bullish and bearish divergences are identified based on relative fractal highs/lows in both price and DI.
Detected divergences are optionally labeled with 'R' (Regular) or 'H' (Hidden), and color-coded accordingly.
Fractal points are defined using 5-bar patterns to ensure consistency and reduce false positives.
ADX/DI Table
When enabled, a floating table displays live values and summaries:
ADX value , trend direction (rising/falling), and qualitative strength.
DI composite , trend direction, and relative strength.
Contextual power dynamics , describing whether bulls or bears are gaining or losing strength.
The background colors of the table reflect current trend strength and direction.
Interpretation Guidelines
ADX indicates the strength of a trend, regardless of its direction. Values below 20 are often considered weak, while those above 40 suggest strong trending conditions.
+DI and -DI represent bullish and bearish directional movements, respectively. Crossovers between them are used to infer trend direction.
When ADX is rising and either +DI or -DI is dominant and increasing, the trend is likely strengthening.
Divergences between DI and price may suggest potential reversals but should be interpreted cautiously and not in isolation.
The threshold line (default 25) provides a basic filter for ignoring low-strength conditions. This can be adjusted depending on the market or timeframe.
Added Value over Existing Indicators
Fully color-graded ADX and DI display for better visual clarity.
Optional signal MA over ADX with crossover markers.
Rich contextual labeling for both divergence and threshold events.
Power dynamics commentary and live table help users contextualize current momentum.
Customizable options for smoothing type, divergence display, table position, and visual offsets.
These additions aim to improve situational awareness without altering the fundamental meaning of ADX/DI values.
Limitations and Disclaimers
As with any ADX-based tool, this indicator does not indicate market direction alone —it measures strength, not trend bias.
Divergence detection relies on fractal patterns and may lag or produce false positives in sideways markets.
Signal MA crossovers and DI threshold breaks are not entry signals , but contextual markers that may assist with timing or filtering other systems.
The table text and labels are for visual assistance and do not replace proper technical analysis or market context.

Win-Loss Streak PlotterWin-Loss Streak Plotter
This indicator tracks the win/loss streaks of moving average crossovers (using simple moving averages for illustration purposes). It calculates the price change after each crossover, marking each as a win (green) or loss (red). The win rate is shown separately.
Inputs:
Source: Price series (default: open)
Fast MA: Fast moving average (default: open)
Slow MA: Slow moving average (default: open)
Total Crosses to Analyze: Number of crossovers to track
Crosses per Row: Number of crossovers per row in the table
Output:
A table displays each crossover’s result (win/loss).
A separate win rate table shows the percentage of wins.
Suggestions are always welcomed!

Multi-indicator Signal Builder [Skyrexio]Overview
Multi-Indicator Signal Builder is a versatile, all-in-one script designed to streamline your trading workflow by combining multiple popular technical indicators under a single roof. It features a single-entry, single-exit logic, intrabar stop-loss/take-profit handling, an optional time filter, a visually accessible condition table, and a built-in statistics label. Traders can choose any combination of 12+ indicators (RSI, Ultimate Oscillator, Bollinger %B, Moving Averages, ADX, Stochastic, MACD, PSAR, MFI, CCI, Heikin Ashi, and a “TV Screener” placeholder) to form entry or exit conditions. This script aims to simplify strategy creation and analysis, making it a powerful toolkit for technical traders.
Indicators Overview
1. RSI (Relative Strength Index)
Measures recent price changes to evaluate overbought or oversold conditions on a 0–100 scale.
2. Ultimate Oscillator (UO)
Uses weighted averages of three different timeframes, aiming to confirm price momentum while avoiding false divergences.
3. Bollinger %B
Expresses price relative to Bollinger Bands, indicating whether price is near the upper band (overbought) or lower band (oversold).
4. Moving Average (MA)
Smooths price data over a specified period. The script supports both SMA and EMA to help identify trend direction and potential crossovers.
5. ADX (Average Directional Index)
Gauges the strength of a trend (0–100). Higher ADX signals stronger momentum, while lower ADX indicates a weaker trend.
6. Stochastic
Compares a closing price to a price range over a given period to identify momentum shifts and potential reversals.
7. MACD (Moving Average Convergence/Divergence)
Tracks the difference between two EMAs plus a signal line, commonly used to spot momentum flips through crossovers.
8. PSAR (Parabolic SAR)
Plots a trailing stop-and-reverse dot that moves with the trend. Often used to signal potential reversals when price crosses PSAR.
9. MFI (Money Flow Index)
Similar to RSI but incorporates volume data. A reading above 80 can suggest overbought conditions, while below 20 may indicate oversold.
10. CCI (Commodity Channel Index)
Identifies cyclical trends or overbought/oversold levels by comparing current price to an average price over a set timeframe.
11. Heikin Ashi
A type of candlestick charting that filters out market noise. The script uses a streak-based approach (multiple consecutive bullish or bearish bars) to gauge mini-trends.
12. TV Screener
A placeholder condition designed to integrate external buy/sell logic (like a TradingView “Buy” or “Sell” rating). Users can override or reference external signals if desired.
Unique Features
1. Multi-Indicator Entry and Exit
You can selectively enable any subset of 12+ classic indicators, each with customizable parameters and conditions. A position opens only if all enabled entry conditions are met, and it closes only when all enabled exit conditions are satisfied, helping reduce false triggers.
2. Single-Entry / Single-Exit with Intrabar SL/TP
The script supports a single position at a time. Once a position is open, it monitors intrabar to see if the price hits your stop-loss or take-profit levels before the bar closes, making results more realistic for fast-moving markets.
3. Time Window Filter
Users may specify a start/end date range during which trades are allowed, making it convenient to focus on specific market cycles for backtesting or live trading.
4. Condition Table and Statistics
A table at the bottom of the chart lists all active entry/exit indicators. Upon each closed trade, an integrated statistics label displays net profit, total trades, win/loss count, average and median PnL, etc.
5. Seamless Alerts and Automation
Configure alerts in TradingView using “Any alert() function call.”
The script sends JSON alert messages you can route to your own webhook.
The indicator can be integrated with Skyrexio alert bots to automate execution on major cryptocurrency exchanges
6. Optional MA/PSAR Plots
For added visual clarity, optionally plot the chosen moving averages or PSAR on the chart to confirm signals without stacking multiple indicators.
Methodology
1. Multi-Indicator Entry Logic
When multiple entry indicators are enabled (e.g., RSI + Stochastic + MACD), the script requires all signals to align before generating an entry. Each indicator can be set for crossovers, crossunders, thresholds (above/below), etc. This “AND” logic aims to filter out low-confidence triggers.
2. Single-Entry Intrabar SL/TP
One Position At a Time: Once an entry signal triggers, a trade opens at the bar’s close.
Intrabar Checks: Stop-loss and take-profit levels (if enabled) are monitored on every tick. If either is reached, the position closes immediately, without waiting for the bar to end.
3. Exit Logic
All Conditions Must Agree: If the trade is still open (SL/TP not triggered), then all enabled exit indicators must confirm a closure before the script exits on the bar’s close.
4. Time Filter
Optional Trading Window: You can activate a date/time range to constrain entries and exits strictly to that interval.
Justification of Methodology
Indicator Confluence: Combining multiple tools (RSI, MACD, etc.) can reduce noise and false signals.
Intrabar SL/TP: Capturing real-time spikes or dips provides a more precise reflection of typical live trading scenarios.
Single-Entry Model: Straightforward for both manual and automated tracking (especially important in bridging to bots).
Custom Date Range: Helps refine backtesting for specific market conditions or to avoid known irregular data periods.
How to Use
1. Add the Script to Your Chart
In TradingView, open Indicators , search for “Multi-indicator Signal Builder”.
Click to add it to your chart.
2. Configure Inputs
Time Filter: Set a start and end date for trades.
Alerts Messages: Input any JSON or text payload needed by your external service or bot.
Entry Conditions: Enable and configure any indicators (e.g., RSI, MACD) for a confluence-based entry.
Close Conditions: Enable exit indicators, along with optional SL (negative %) and TP (positive %) levels.
3. Set Up Alerts
In TradingView, select “Create Alert” → Condition = “Any alert() function call” → choose this script.
Entry Alert: Triggers on the script’s entry signal.
Close Alert: Triggers on the script’s close signal (or if SL/TP is hit).
Skyrexio Alert Bots: You can route these alerts via webhook to Skyrexio alert bots to automate order execution on major crypto exchanges (or any other supported broker).
4. Visual Reference
A condition table at the bottom summarizes active signals.
Statistics Label updates automatically as trades are closed, showing PnL stats and distribution metrics.
Backtesting Guidelines
Symbol/Timeframe: Works on multiple assets and timeframes; always do thorough testing.
Realistic Costs: Adjust commissions and potential slippage to match typical exchange conditions.
Risk Management: If using the built-in stop-loss/take-profit, set percentages that reflect your personal risk tolerance.
Longer Test Horizons: Verify performance across diverse market cycles to gauge reliability.
Example of statistic calculation
Test Period: 2023-01-01 to 2025-12-31
Initial Capital: $1,000
Commission: 0.1%, Slippage ~5 ticks
Trade Count: 468 (varies by strategy conditions)
Win rate: 76% (varies by strategy conditions)
Net Profit: +96.17% (varies by strategy conditions)
Disclaimer
This indicator is provided strictly for informational and educational purposes .
It does not constitute financial or trading advice.
Past performance never guarantees future results.
Always test thoroughly in demo environments before using real capital.
Enjoy exploring the Multi-Indicator Signal Builder! Experiment with different indicator combinations and adjust parameters to align with your trading preferences, whether you trade manually or link your alerts to external automation services. Happy trading and stay safe!

Ichimoku Cloud Crosses_AITIchimoku Cloud Crosser_AIT
The "Ichimoku Cloud Crosses_AIT" indicator is designed to leverage the Ichimoku Cloud components, focusing on the crossovers between the Tenkan-sen and Kijun-sen lines. This indicator visually displays these crossovers on the price chart to help traders identify potential long and short trading opportunities.
1. Indicator Components
Ichimoku Cloud Elements
Tenkan-sen (Conversion Line): A short-term trend indicator. It is the midpoint of the highest high and the lowest low over a specified period (tenkanLength). In this indicator, the default period is set to 21.
Kijun-sen (Base Line): A medium-term trend indicator. It is the midpoint of the highest high and the lowest low over the specified period (kijunLength). In this indicator, the default period is set to 120.
Senkou Span A and B: These components are part of the traditional Ichimoku Cloud, but they are not directly plotted in this version of the indicator.
Chikou Span (Lagging Span): This component is included in the calculation but is not plotted in this indicator version.
2. Signal Conditions
Long Signal
Condition: A long signal is generated when the Tenkan-sen crosses above the Kijun-sen.
Visual Representation: Displayed as a yellow triangle below the price bar.
Short Signal
Condition: A short signal is generated when the Tenkan-sen crosses below the Kijun-sen.
Visual Representation: Displayed as a fuchsia triangle above the price bar.
3. How to Use the Indicator
Add the Indicator: Apply the "Ichimoku Cloud Crosses_AIT" indicator to your chart in TradingView.
Adjust Parameters: You can customize the periods for the Tenkan-sen, Kijun-sen, Senkou Span A, Senkou Span B, and Chikou Span in the indicator's settings.
Interpret the Signals:
Long Signal: Look for a yellow triangle below the bar, indicating a potential bullish crossover (Tenkan-sen crossing above Kijun-sen).
Short Signal: Look for a fuchsia triangle above the bar, indicating a potential bearish crossover (Tenkan-sen crossing below Kijun-sen).
Conclusion
The "Ichimoku Cloud Crosses_AIT" indicator provides a clear visualization of the crossovers between the Tenkan-sen and Kijun-sen lines on the price chart. This tool helps traders quickly identify potential bullish and bearish signals, making it a valuable addition to any trading strategy. Adjust the settings and parameters as needed to fit your specific trading style and market conditions.

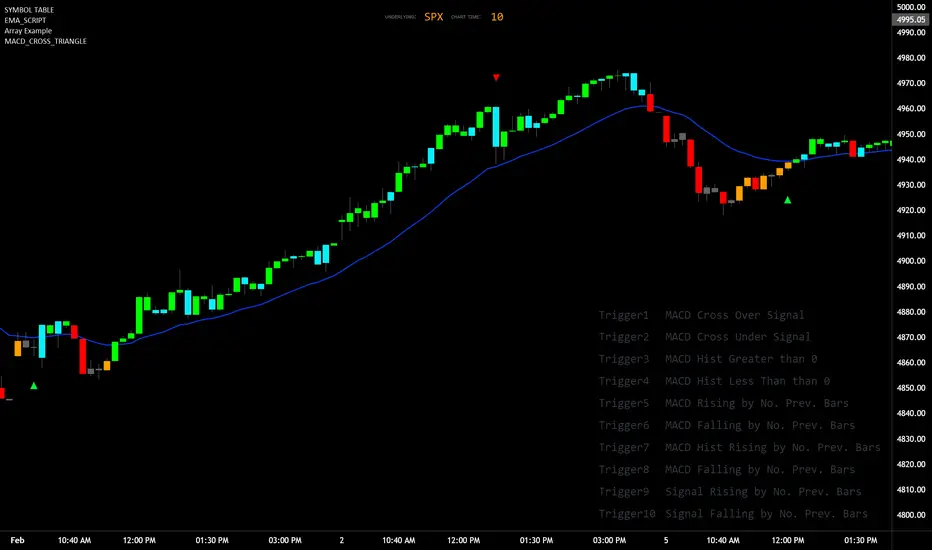
MACD_TRIGGER_CROSS_TRIANGLEMACD Triangle Trigger Indicator by thebearfib
Overview
The MACD Cross Triangle Indicator is a powerful tool for traders who rely on the MACD's signal line crossovers to make informed trading decisions. This indicator enhances the traditional MACD by allowing users to customize triggers for bullish and bearish signals and by displaying these signals directly on the chart with visually distinctive labels.
Features
Customizable Color Scheme: Choose distinct colors for bullish and bearish signals to fit your chart's theme or your personal preference.
Flexible Trigger Conditions: Select from a variety of trigger conditions based on MACD and signal line behaviors over a specified number of bars back.
Visual Signal Indicators: Bullish and bearish signals are marked with upward and downward triangles, making it easy to spot potential entry or exit points.
Detailed Trigger Descriptions: A comprehensive table lists all available triggers and their descriptions, aiding in selection and understanding of each trigger's mechanism.
Configuration Options
Bullish and Bearish Colors: Customize the color of the labels for bullish (upward) and bearish (downward) signals.
Trend Lookback Period: Choose how far back (in bars) the indicator should look to determine the trend, affecting the calculation of certain triggers.
Trigger Selection for Bullish and Bearish Signals: Pick specific triggers for both bullish and bearish conditions from a list of 10 different criteria, ranging from MACD crossovers to historical comparisons of MACD, signal line, and histogram values.
Label Size and Font Settings: Adjust the size of the signal labels on the chart and the font size of the trigger descriptions table to ensure readability and fit with your chart layout.
Trigger Descriptions Table Position and Color: Customize the position and color of the trigger descriptions table to match your chart's aesthetic and layout preferences.
Trigger Mechanisms
Trigger 1 to 10: Each trigger corresponds to a specific condition involving the MACD line, signal line, and histogram. These include crossovers, directional changes compared to previous bars, and comparisons of current values to historical values.
Usage
1. Select Trigger Conditions: Choose the desired triggers for bullish and bearish signals based on your trading strategy.
2. Customize Visuals: Set your preferred colors for the bullish and bearish labels, adjust label and font sizes, and configure the trigger descriptions table.
3. Analyze Signals: Watch for the upward (bullish) and downward (bearish) triangles to identify potential trading opportunities based on MACD crossover signals.
Conclusion
The MACD Cross Triangle Indicator offers a customizable and visually intuitive way to leverage MACD crossover signals for trading. With its flexible settings and clear signal indicators, traders can tailor the indicator to fit their strategy and improve their decision-making process on TradingView.
Drunken Bird Inspiration for the support and resistance plateau lines came from AnotherDAPTrader.
The TSL Drunken Bird is an enhanced technical analysis tool for swing traders on TradingView, based on the original Accurate Swing Trading System by ceyhun. It generates buy and sell signals when price crosses a dynamic Trailing Stop Loss (TSL) level derived from recent highs and lows. This version introduces plateau detection for support and resistance lines, dynamic label expiration to reduce clutter, customizable line styles and decay, and improved HTF confluence for trend-aligned trading. Visual elements include signal labels, horizontal lines, a colored TSL plot, and optional bar/background coloring. Alerts are available for buy/sell crossovers, making it suitable for assets like NASDAQ E-mini futures, stocks, forex, and more.
This script adapts and expands upon ceyhun's original codetradingview.com, adding significant features such as tolerance-based plateau identification for support/resistance, label management with timeframe-aware expiration (~7 days), cross-count decay for lines, and expanded customization options. Inspiration for the support and resistance plateau lines came from AnotherDAPTrader. Released under the Mozilla Public License 2.0.Key
Features
Swing Signals: "BUY" and "SELL" labels on price crossovers/crossunders of the TSL, with a user-defined lookback (default 3).
HTF Confluence: Filters signals based on higher timeframe trend (e.g., "EXIT LONG" instead of "SELL" if HTF is bullish); toggleable.
HTF Options: Select from 5m, 15m, 30m, 1h, 4h, Daily, Weekly, or Monthly.
Plateau Detection: Identifies flat highs/lows (with tolerance) for resistance/support lines, plotted as dotted/solid/dashed with customizable colors, thickness, and decay after crosses (default 2).
Horizontal Lines: Green (buy) and red (sell) lines at signal closes, extending right until crossed; toggle between short (no extension limit) or long visualization.
TSL Visualization: Colored line (green if close >= TSL, red otherwise) for dynamic levels.
Bar/Background Coloring: Optional green/red coloring based on price vs. TSL.
Label Expiration: All labels (signals and plateaus) auto-delete after ~7 days (timeframe-adjusted, default 1008 bars).
Alerts: Triggers for "Buy Signal" and "Sell Signal" on crossovers.
How to Use
Add to Chart: Paste the Pine Script into TradingView's editor and add to your chart.
Configure Settings:
Swing: Lookback for highs/lows (min 1).
Plateau Tolerance: Flatness allowance (default 0.0).
Use HTF Confluence: Enable for trend filtering.
Higher Time Frame: Choose timeframe string.
Barcolor/Bgcolor: Toggle coloring.
Show Plateau Lines: Enable support/resistance.
Line Styles/Colors/Thickness: Customize buy/sell and plateau visuals.
Plateau Line Decay: Crosses before stopping extension.
Label Expiration: Bars for auto-deletion (~7 days).
Interpret Elements:
Labels: "BUY"/"SELL" (green/red), "EXIT SHORT"/"EXIT LONG" (orange) on signals; "Res"/"Sup" on plateaus.
Lines: Extend right until conditions met (cross for buy/sell, decay threshold for plateaus).
TSL Plot: Monitors trend shifts.
Set Alerts: Use "Buy Signal" or "Sell Signal" conditions for notifications.
Testing: Apply to volatile assets; adjust Swing for signal frequency, tolerance for plateau sensitivity.
Ideal Use Cases
Swing trading on 1m–1h charts for entries/exits aligned with HTF trends.
Identifying support/resistance in ranging markets via plateaus.
Scalping with short lookbacks or longer swings with HTF enabled.
Manual or alert-based trading on futures, stocks, or forex.
Why It's Valuable
This indicator builds on ceyhun's core TSL logic with practical enhancements for modern trading: clutter reduction via expiration/decay, visual customization, and plateau-based S/R for better context. It promotes disciplined, trend-aware decisions while maintaining simplicity.
Note: Optimized for any timeframe/asset; test in demo. Not financial advice—use with risk management.

Multi Oscillator OB/OS Signals v3 - Scope TestIndicator Description: Multi Oscillator OB/OS Signals
Purpose:
The "Multi Oscillator OB/OS Signals" indicator is a TradingView tool designed to help traders identify potential market extremes and momentum shifts by monitoring four popular oscillators simultaneously: RSI, Stochastic RSI, CCI, and MACD. Instead of displaying these oscillators in separate panes, this indicator plots distinct visual symbols directly onto the main price chart whenever specific predefined conditions (typically related to overbought/oversold levels or line crossovers) are met for each oscillator. This provides a consolidated view of potential signals from these different technical tools.
How It Works:
The indicator calculates the values for each of the four oscillators based on user-defined settings (like length periods and price sources) and then checks for specific signal conditions on every bar:
Relative Strength Index (RSI):
It monitors the standard RSI value.
When the RSI crosses above the user-defined Overbought (OB) level (e.g., 70), it plots an "Overbought" symbol (like a downward triangle) above that price bar.
When the RSI crosses below the user-defined Oversold (OS) level (e.g., 30), it plots an "Oversold" symbol (like an upward triangle) below that price bar.
Stochastic RSI:
This works similarly to RSI but is based on the Stochastic calculation applied to the RSI value itself (specifically, the %K line of the Stoch RSI).
When the Stoch RSI's %K line crosses above its Overbought level (e.g., 80), it plots its designated OB symbol (like a downward arrow) above the bar.
When the %K line crosses below its Oversold level (e.g., 20), it plots its OS symbol (like an upward arrow) below the bar.
Commodity Channel Index (CCI):
It tracks the CCI value.
When the CCI crosses above its Overbought level (e.g., +100), it plots its OB symbol (like a square) above the bar.
When the CCI crosses below its Oversold level (e.g., -100), it plots its OS symbol (like a square) below the bar.
Moving Average Convergence Divergence (MACD):
Unlike the others, MACD signals here are not based on fixed OB/OS levels.
It identifies when the main MACD line crosses above its Signal line. This is considered a bullish crossover and is indicated by a specific symbol (like an upward label) plotted below the price bar.
It also identifies when the MACD line crosses below its Signal line. This is a bearish crossover, indicated by a different symbol (like a downward label) plotted above the price bar.
Visualization:
All these signals appear as small, distinct shapes directly on the price chart at the bar where the condition occurred. The shapes, their colors, and their position (above or below the bar) are predefined for each signal type to allow for quick visual identification. Note: In the current version of the underlying code, the size of these shapes is fixed (e.g., tiny) and not user-adjustable via the settings.
Configuration:
Users can access the indicator's settings to customize:
The calculation parameters (Length periods, smoothing, price source) for each individual oscillator (RSI, Stoch RSI, CCI, MACD).
The specific Overbought and Oversold threshold levels for RSI, Stoch RSI, and CCI.
The colors associated with each type of signal (OB, OS, Bullish Cross, Bearish Cross).
(Limitation Note: While settings exist to toggle the visibility of signals for each oscillator individually, due to a technical workaround in the current code, these toggles may not actively prevent the shapes from plotting if the underlying condition is met.)
Alerts:
The indicator itself does not automatically generate pop-up alerts. However, it creates the necessary "Alert Conditions" within TradingView's alert system. This means users can manually set up alerts for any of the specific signals generated by the indicator (e.g., "RSI Overbought Enter," "MACD Bullish Crossover"). When creating an alert, the user selects this indicator, chooses the desired condition from the list provided by the script, and configures the alert actions.
Intended Use:
This indicator aims to provide traders with convenient visual cues for potential over-extension in price (via OB/OS signals) or shifts in momentum (via MACD crossovers) based on multiple standard oscillators. These signals are often used as potential indicators for:
Identifying areas where a trend might be exhausted and prone to a pullback or reversal.
Confirming signals generated by other analysis methods or trading strategies.
Noting shifts in short-term momentum.
Disclaimer: As with any technical indicator, the signals generated should not be taken as direct buy or sell recommendations. They are best used in conjunction with other forms of analysis (price action, trend analysis, volume, fundamental analysis, etc.) and within the framework of a well-defined trading plan that includes risk management. Market conditions can change, and indicator signals can sometimes be false or misleading.

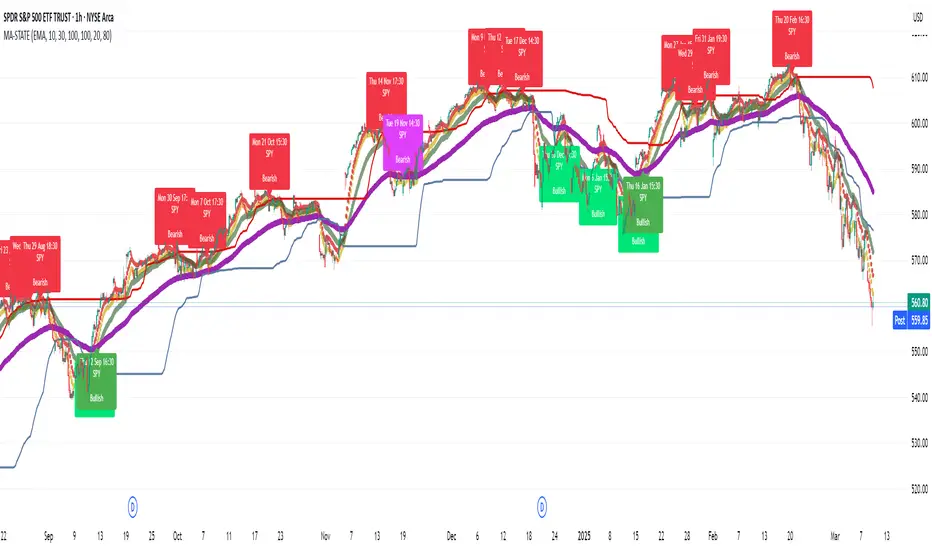
TestMA-STATEOverview:
This Pine Script (version 6) is designed to generate trading events based on moving average (MA) behavior and dynamically calculated percentiles. It leverages a custom state machine library (version 7) from decrypt_capital to track and manage state transitions related to MA conditions, and it triggers alerts (and optionally, chart labels) when specific state transitions occur.
Key Components:
License & Metadata:
The script is distributed under the Mozilla Public License 2.0.
It carries copyright by decrypt_capital.
The title ("TestMA-STATE") and short title ("MA-STATE") are defined, and the script runs on an overlay with extended backtracking and drawing limits.
State Machine Integration:
The script imports the lib_statemachine_modified library (version 7) using the alias modSM.
A persistent state machine instance (MovingAverageDirection_SM) is created to manage various MA-related states.
Several state constants are defined to represent different market conditions, such as:
MA_SHORT_ABOVE_OVERBOUGHT: When the short MA low is above the overbought threshold.
MA_SHORT_CROSSUNDER_MID & MA_SHORT_CROSSUNDER_BIG: Conditions for bearish crossunders.
MA_SHORT_BELOW_OVERSOLD: When the short MA high is below the oversold threshold.
MA_SHORT_CROSSOVER_MID & MA_SHORT_CROSSOVER_BIG: Conditions for bullish crossovers.
Inputs & MA Calculation:
Users can choose the type of moving average (EMA, SMA, WMA, VWMA) and adjust lengths for short, mid, and big MAs.
Additional inputs include lookback length for percentile calculations and percentile thresholds for determining overbought and oversold boundaries.
The script computes:
Short MA Low and High: Based on the low and high series.
Mid MA and Big MA: Based on the average price (ohlc4).
Dynamic Percentile Boundaries:
Two functions (f_getPercentile() and f_getPercentileArr()) calculate dynamic percentile values from the MA data.
These functions determine the oversold and overbought boundaries used in the state transition conditions.
Timestamp & Alert Header Formatting:
A helper function (f_formatTimestamp()) formats timestamps into a human-readable form (e.g., "Tue 12 Mar 16:30").
This formatted time, along with ticker information and other details, is used to build an alert header.
State Transitions & Alerts:
The script calls the state machine’s step() method multiple times with conditions based on the relationship between MA values and the percentile boundaries.
For example:
A bullish condition is triggered when the short MA low moves above the overbought threshold.
A bearish condition is triggered when the short MA high falls below the oversold boundary.
Transitions are further refined by checking if the MA is rising or falling.
When specific state transitions occur (e.g., MA_SHORT_CROSSOVER_MID after MA_SHORT_BELOW_OVERSOLD), the script:
Checks that the transition is recent (using the barsSinceState() method).
Optionally creates a label on the chart.
Triggers an alert with a descriptive message.
Chart Plotting:
The script plots the calculated moving averages (short, mid, and optionally big) on the chart.
It also plots the dynamic percentile boundaries for visual reference.
Purpose & Usage:
Trading Signal Generation:
The primary goal is to monitor key MA conditions and trigger alerts when significant crossovers or crossunders occur. These events—such as bullish crossovers when the market recovers from oversold conditions or bearish crossunders when the market retracts from overbought conditions—can be used as trading signals.
Visualization:
Users have options to display the various moving averages and percentile boundaries directly on the chart, as well as optional labels that mark when an alert is generated.
Alerting:
When specific state transitions are detected, the script constructs and sends an alert message with a timestamp, ticker, and descriptive text, aiding traders in making timely decisions.
Gold Pro StrategyHere’s the strategy description in a chat format:
---
**Gold (XAU/USD) Trend-Following Strategy**
This **trend-following strategy** is designed for trading gold (XAU/USD) by combining moving averages, MACD momentum indicators, and RSI filters to capture sustained trends while managing volatility risks. The strategy uses volatility-adjusted stops to protect gains and prevent overexposure during erratic price movements. The aim is to take advantage of trending markets by confirming momentum and ensuring entries are not made at extreme levels.
---
**Key Components**
1. **Trend Identification**
- **50 vs 200 EMA Crossover**
- **Bullish Trend:** 50 EMA crosses above 200 EMA, and the price closes above the 200 EMA
- **Bearish Trend:** 50 EMA crosses below 200 EMA, and the price closes below the 200 EMA
2. **Momentum Confirmation**
- **MACD (12,26,9)**
- **Buy Signal:** MACD line crosses above the signal line
- **Sell Signal:** MACD line crosses below the signal line
- **RSI (14 Period)**
- **Bullish Zone:** RSI between 50-70 to avoid overbought conditions
- **Bearish Zone:** RSI between 30-50 to avoid oversold conditions
3. **Entry Criteria**
- **Long Entry:** Bullish trend, MACD bullish crossover, and RSI between 50-70
- **Short Entry:** Bearish trend, MACD bearish crossover, and RSI between 30-50
4. **Exit & Risk Management**
- **ATR Trailing Stops (14 Period):**
- Initial Stop: 3x ATR from entry price
- Trailing Stop: Adjusts to lock in profits as price moves favorably
- **Position Sizing:** 100% of equity per trade (high-risk strategy)
---
**Key Logic Flow**
1. **Trend Filter:** Use the 50/200 EMA relationship to define the market's direction
2. **Momentum Confirmation:** Confirm trend momentum with MACD crossovers
3. **RSI Validation:** Ensure RSI is within non-extreme ranges before entering trades
4. **Volatility-Based Risk Management:** Use ATR stops to manage market volatility
---
**Visual Cues**
- **Blue Line:** 50 EMA
- **Red Line:** 200 EMA
- **Green Triangles:** Long entry signals
- **Red Triangles:** Short entry signals
---
**Strengths**
- **Clear Trend Focus:** Avoids counter-trend trades
- **RSI Filter:** Prevents entering overbought or oversold conditions
- **ATR Stops:** Adapts to gold’s inherent volatility
- **Simple Rules:** Easy to follow with minimal inputs
---
**Weaknesses & Risks**
- **Infrequent Signals:** 50/200 EMA crossovers are rare
- **Potential Missed Opportunities:** Strict RSI criteria may miss some valid trends
- **Aggressive Position Sizing:** 100% equity allocation can lead to large drawdowns
- **No Profit Targets:** Relies on trailing stops rather than defined exit targets
---
**Performance Profile**
| Metric | Expected Range |
|----------------------|---------------------|
| Annual Trades | 4-8 |
| Win Rate | 55-65% |
| Max Drawdown | 25-35% |
| Profit Factor | 1.8-2.5 |
---
**Optimization Recommendations**
1. **Increase Trade Frequency**
Adjust the EMAs to shorter periods:
- `emaFastLen = input.int(30, "Fast EMA")`
- `emaSlowLen = input.int(150, "Slow EMA")`
2. **Relax RSI Filters**
Adjust the RSI range to:
- `rsiBullish = rsi > 45 and rsi < 75`
- `rsiBearish = rsi < 55 and rsi > 25`
3. **Add Profit Targets**
Introduce a profit target at 1.5% above entry:
```pine
strategy.exit("Long Exit", "Long",
stop=longStopPrice,
profit=close*1.015, // 1.5% target
trail_offset=trailOffset)
```
4. **Reduce Position Sizing**
Risk a smaller percentage per trade:
- `default_qty_value=25`
---
**Best Use Case**
This strategy excels in **strong trending markets** such as gold rallies during economic or geopolitical crises. However, during sideways or choppy market conditions, the strategy might require manual intervention to avoid false signals. Additionally, integrating fundamental analysis—like monitoring USD weakness or geopolitical risks—can enhance its effectiveness.
---
This strategy offers a balanced approach for trading gold, combining trend-following principles with risk management tailored to the volatility of the market.

Dual Spectrum RSI [CHE]Dual Spectrum RSI Indicator
Introduction
The Dual Spectrum RSI Indicator is an innovative and robust tool designed for traders aiming to enhance their market analysis and trading precision. This script leverages multi-timeframe analysis, advanced RSI configurations, and customizable visualization options to provide actionable insights for both trend-following and contrarian strategies.
Key Features
1. Dynamic Timeframe Selection
- Automatically adapts the resolution based on the current chart's timeframe.
- Options to switch between Auto Timeframe, Multiplier-based Timeframe, or Manual Resolution for complete control.
2. Advanced RSI Calculations
- Dual RSI setup for multi-layered analysis:
- Primary RSI for trend identification on the higher timeframe (HTF).
- Secondary RSI for entry signals with oversold/overbought crossovers on the current chart timeframe.
3. EMA Integration on Higher Timeframe (HTF)
- The Exponential Moving Average (EMA) acts as a robust trend filter, calculated on the Higher Timeframe (HTF).
- This ensures that trade signals align with the broader market trend, providing a strategic edge and reducing noise from lower timeframes.
4. Signal Clarity
- Visual labels for Buy and Sell signals directly on the chart.
- Dynamic stop-loss suggestions that adjust based on EMA crossovers and trend changes.
5. Customizable Visualization
- Gradient fills for overbought/oversold zones provide intuitive visual cues.
- User-friendly inputs for adjusting separator lines, color schemes, and label styles.
6. Comprehensive Data Display
- Real-time updates in an Info Box, showing active timeframe settings and resolution.
- Easy-to-understand trend conditions, making it accessible for both novice and professional traders.
Benefits for Traders
1. Precision in Decision-Making
The multi-timeframe capability ensures that traders always have the broader market context, minimizing false signals and enhancing trade accuracy.
2. Flexibility and Customization
Fully adjustable parameters allow traders to tailor the indicator to their unique trading style, whether scalping, day trading, or swing trading.
3. Enhanced Market Insights
By combining HTF trend filters, RSI dynamics, and EMA thresholds, this indicator provides a holistic view of market conditions.
4. User-Friendly Interface
The clean layout and intuitive options make it easy to integrate this tool into any TradingView setup.
5. Increased Confidence in Trades
With visual aids such as labels, gradients, and a trend-detection mechanism, traders can make decisions with greater confidence and less emotional bias.
Example Use Cases
1. Trend-Following Strategy
- Utilize the HTF EMA filter to confirm bullish or bearish trends.
- Enter trades when the secondary RSI crosses oversold/overbought levels in the direction of the trend.
2. Reversal Strategy
- Identify overextended trends using RSI crossovers.
- Look for counter-trend opportunities with precise stop-loss placements.
3. Scalping Setup
- Switch to intraday timeframes and use the multiplier-based resolution to capture short-term market movements.
How to Use
1. Add the script to your TradingView chart by pasting the provided Pine Script code into the Pine Editor.
2. Adjust the Timeframe Type, RSI parameters, and EMA length to align with your trading goals.
3. Monitor the generated signals and use them in conjunction with your broader trading strategy.
Disclaimer
The content provided, including all code and materials, is strictly for educational and informational purposes only. It is not intended as, and should not be interpreted as, financial advice, a recommendation to buy or sell any financial instrument, or an offer of any financial product or service. All strategies, tools, and examples discussed are provided for illustrative purposes to demonstrate coding techniques and the functionality of Pine Script within a trading context.
Any results from strategies or tools provided are hypothetical, and past performance is not indicative of future results. Trading and investing involve high risk, including the potential loss of principal, and may not be suitable for all individuals. Before making any trading decisions, please consult with a qualified financial professional to understand the risks involved.
By using this script, you acknowledge and agree that any trading decisions are made solely at your discretion and risk.
Conclusion
The Dual Spectrum RSI Indicator is not just another technical tool—it's a comprehensive trading companion that adapts to your needs, simplifies market analysis, and boosts your trading performance. Whether you're a beginner or a seasoned trader, this indicator provides the edge you need to succeed in today's dynamic markets.
Try It Today!
Experience the power of multi-timeframe analysis and take your trading to the next level. Add the Dual Spectrum RSI Indicator to your TradingView arsenal now!
Best regards
Chervolino

Multiple RSITitle: MultiRSI: A Versatile Multi-Timeframe RSI Indicator
Short Description:
A powerful RSI-based indicator that incorporates three RSI lengths (Fast, Medium, and Slow) to help traders analyze trends, momentum, and potential reversals with clear visual signals.
Full Description:
Overview:
The MultiRSI script provides traders with a dynamic tool to assess market conditions across multiple RSI timeframes. It calculates Fast, Medium, and Slow RSI values, assigns meaningful colors based on trend analysis, and highlights key crossover points for actionable insights.
Key Features:
Triple RSI Display:
Fast RSI (default: 8): Ideal for capturing short-term momentum.
Medium RSI (default: 12): Provides a balanced perspective.
Slow RSI (default: 16): Helps identify longer-term trends.
Trend Analysis:
Color-coded RSI lines:
Green, blue, and aqua for uptrends.
Yellow, orange, and red for potential downtrends.
Visual differentiation for easy interpretation.
Crossover Signals:
Upward Cross (triangle up): Indicates potential bullish momentum.
Downward Cross (triangle down): Suggests possible bearish momentum.
Marked directly on the chart for clarity.
Customizable Inputs:
Adjust RSI lengths to suit your trading strategy.
Grouped input settings for a seamless configuration experience.
Usage Scenarios:
Identify trend strength and reversals in different timeframes.
Spot key momentum shifts with crossover signals.
Combine with other indicators for a comprehensive trading strategy.
How It Works:
The script compares the Fast RSI against the Medium RSI and the Medium RSI against the Slow RSI to determine short-, medium-, and long-term trends. Crossovers between Medium and Slow RSI values signal potential momentum shifts.
Visualization:
Clear, color-coded plots for the three RSI levels.
Highlighted crossovers for quick decision-making.
License:
This script is open-source under the Mozilla Public License 2.0. Feel free to use, modify, and share!
