CANX MA Crossover© CanxStixTrader
Moving average crossover systems measure drift in the market. They are great strategies for time-limited traders. KEEP IT SIMPLE
This strategy works both for buys and sells using the reaction line to guide your position against the reactions.
HOW TO USE THE INDICATOR
1) Choose your market and timeframe.
2) Choose the length.
3) Choose the multiplier.
4) Choose if the strategy is long-only or bidirectional (longs & shorts).
TIPS
The strategy works best in bullish markets as that is the primary direction that market such as stocks, indexes and metals like to move.
- Increase the multiplier to reduce whipsaws
- Increase the length to take fewer trades
- Decrease the length to take more trades
- Try a Long-Only strategy to see if that performs better.
The base set up when you load the indicator is for the 1 minute chart on gold. We found that it also works well on the US Indexes. For other markets you may need to change the length and multiplier to suit the market and back test its results.
Cerca negli script per "crossover债券是什么"

HMA 200 + EMA 20 Crossover StrategyThis strategy combines a long-term trend filter using the Hull Moving Average (HMA 200) with a short-term entry trigger using the Exponential Moving Average (EMA 20).
📈 Entry Logic:
Buy Entry: When price is above the HMA 200 and crosses above the EMA 20.
Sell Entry: When price is below the HMA 200 and crosses below the EMA 20.
The strategy closes the current position and reverses on the opposite signal.
⚙️ Strategy Settings (Backtest Configuration):
Position size: 10% of equity per trade
Commission: 0.1% per trade (to simulate broker fees)
Slippage: 2 ticks (to reflect realistic fill conditions)
✅ Purpose:
This script is designed to identify high-probability trades in the direction of the overall trend, avoiding whipsaw conditions. It is useful for traders looking for a dynamic crossover-based system that filters trades based on longer-term momentum.
🔎 Make sure to test across multiple assets and timeframes. For best results, apply this strategy to liquid trending markets like major FX pairs, indices, or high-cap stocks.

OBVX Conviction Bias🧮 The OBVX Conviction Bias overlay tracks the flow of directional volume using the classic On-Balance Volume calculation, then filters it through a layered moving average system to expose crowd commitment , pressure transitions , and momentum fatigue . The tool applies two smoothed averages to the OBV line—a fast curve and a longer-term baseline scaled using Euler’s constant (2.718)—and visualizes their relationship using a color-coded crossover ribbon and pressure fills. When used correctly, it reveals whether a move is being supported by meaningful volume, or whether the crowd is starting to disengage.
🚦 The core signal compares OBV to its fast moving average. When OBV climbs above the short average, it fills green—suggesting real directional effort. When OBV sinks below, the fill turns maroon—flagging fading conviction or pullback potential. A second fill between the short and long OBV moving averages captures the broader trend of volume intention. If the short is above the long, this space fills greenish, showing constructive pressure. If it flips, the fill fades red, signaling crowd hesitation, rotation, or early exhaustion.
⚖️ All smoothing is user-selectable, defaulting to VWMA for effort-sensitive structure. The long-term average is auto-scaled using the natural exponential multiplier (2.718), offering rhythm that reflects the curve of participation. OBVX Conviction Bias isn’t trying to predict—it’s trying to show you where the crowd is leaning , and whether that lean is gaining traction or losing strength.
🧐 Ideal Use-Cases:
• Detect divergence between volume flow and price action
• Confirm breakout validity with volume alignment
• Fade breakouts where OBV fails to follow through
• Time pullback entries when OBV pressure resumes in trend direction
🍷 Recommended Pairings:
• ZVOL to measure whether volume is statistically significant or just noise (as shown)
• RVOL Effort Matrix to validate crowd effort by tier and structure zone
• SUPeR TReND 2.718 and/or MA Ribbons for directional confluence
• ATR Turbulence to track volatility-phase alignment with volume intention

MACD Volume Strategy (BBO + MACD State, Reversal Type)Overview
MACD Volume Strategy (BBO + MACD State, Reversal Type) is a momentum-based reversal system that combines MACD crossover logic with volume filtering to enhance signal accuracy and minimize noise. It aims to identify structural trend shifts and manage risk using predefined parameters.
※This strategy is for educational and research purposes only. All results are based on historical simulations and do not guarantee future performance.
Strategy Objectives
Identify early trend transitions with high probability
Filter entries using volume dynamics to validate momentum
Maintain continuous exposure using a reversal-style model
Apply a consistent 1:1.5 risk-to-reward ratio per trade
Key Features
Integrated MACD and volume oscillator filtering
Zero repainting (all signals confirmed on closed candles)
Automatic position flipping for seamless direction shifts
Stop-loss and take-profit based on recent structural highs/lows
Trading Rules
Long Entry Conditions
MACD crosses above the zero line (BBO Buy arrow)
Volume oscillator is positive (short EMA > long EMA)
MACD is above the signal line
Close any existing short and enter a new long
Short Entry Conditions
MACD crosses below the zero line (BBO Sell arrow)
Volume oscillator is positive
MACD is below the signal line
Close any existing long and enter a new short
Exit Rules
Take Profit (TP) = Entry ± (risk distance × 1.5)
Stop Loss (SL) = Recent swing low (for long) or high (for short)
Early Exit = Triggered when a reversal signal appears (flip logic)
Risk Management Parameters
Pair: ETH/USD
Timeframe: 10-minute
Starting Capital: $3,000
Commission: 0.02%
Slippage: 2 pip
Risk per Trade: 5% of account equity (adjusted for sustainable practice)
Total Trades: 312 (backtest on selected dataset)
※Risk parameters are fully configurable and should be adjusted to suit each trader's personal setup and broker conditions.
Parameters & Configurations
Volume Short Length: 6
Volume Long Length: 12
MACD Fast Length: 11
MACD Slow Length: 21
Signal Smoothing: 10
Oscillator MA Type: SMA
Signal Line MA Type: SMA
Visual Support
Green arrow = Long entry
Red arrow = Short entry
MACD lines, signal line, and histogram
SL/TP markers plotted directly on the chart
Strategic Advantages & Uniqueness
Volume filtering eliminates low-participation, weak signals
Structurally aligned SL/TP based on recent market pivots
No repainting — decisions are made only on closed candles
Always in the market due to the reversal-style framework
Inspirations & Attribution
This strategy is inspired by the excellent work of:
Bitcoinblockchainonline – “BBO_Roxana_Signals MACD + vol”
Leveraging MACD zero-line cross and volume oscillator for intuitive signal generation.
HasanRifat – “MACD Fake Filter ”
Introduced a signal filter using MACD wave height averaging to reduce false positives.
This strategy builds upon those ideas to create a more automated, risk-aware, and technically adaptive system.
Summary
MACD Volume Strategy is a clean, logic-first automated trading system built for precision-seeking traders. It avoids discretionary bias and provides consistent signal logic under backtested historical conditions.
100% mechanical — no discretionary input required
Designed for high-confidence entries
Can be extended with filters, alerts, or trailing stops
※Strategy performance depends on market context. Past performance is not indicative of future results. Use with proper risk management and careful configuration.

Smart MA CrossoverThe Smart MA Crossover indicator is a trend-following tool designed to help traders identify high-probability buy and sell signals based on a dynamic moving average and volume confirmation.
This indicator allows traders to customize the moving average type (SMA, EMA, HMA, WMA, VWMA, SMMA, or VWAP) while incorporating an ATR-based filter for better signal clarity.
How It Works
The script analyzes price movements in relation to a selected moving average and volume conditions to generate trend-based trade signals:
🟢 Buy Signal:
- Price is trading above the moving average for at least two bars.
- A sudden upward momentum is detected (price > open * 1.005).
- Volume is higher than the 50-period SMA of volume.
- The price was trading below the moving average three bars ago.
🔴 Sell Signal:
- Price is trading below the moving average for at least two bars.
- A sudden downward movement is detected (price < open * 0.995).
- Volume is higher than the 50-period SMA of volume.
- The price was trading above the moving average three bars ago.
- When these conditions are met, a label appears on the chart, marking the potential trade signal.
Key Features
- Customizable Moving Averages – Choose between SMA, EMA, HMA, WMA, VWMA, SMMA, or VWAP.
- Dynamic Trend Detection – Moving average color changes based on trend direction.
- Volume Confirmation – Avoid false signals by filtering trades using SMA-based volume analysis.
- ATR-Based Signal Placement – Labels are positioned dynamically based on ATR values to improve visibility.
- Background Trend Highlighting – The background changes color depending on whether price is above (green) or below (red) the moving average.
- Alerts for Buy & Sell Signals – Get real-time notifications when a trade signal is generated.
How to Use
- This indicator is best suited for trend-following strategies and works across different markets, including stocks, forex, and crypto.
- It can be used on multiple timeframes, but traders should combine it with additional analysis to refine trade decisions.
- ATR-based signal placement ensures that buy/sell labels do not clutter the chart.
Important Notes
- This indicator does not predict future price movements—it is a trend-based tool meant to assist with trade decisions.
- No financial advice – Always use risk management when trading.
- TradingView users who do not read Pine Script can still fully utilize this script thanks to clear labels and alerts.
Best MA Pair Finder (Crossover Strategy)This indicator automatically identifies the optimal pair of moving averages (MAs) for a crossover strategy using all available historical data. It offers several MA options—including SMA, EMA, and TEMA—allowing users to select the desired type in the settings. The indicator supports two strategy modes: “Long Only” and “Buy & Sell”, which can be chosen via the options.
For each MA pair combination, the indicator performs a backtest and calculates the profit factor, considering only those pairs where the total number of trades meets or exceeds the user-defined "Minimum Trades" threshold. This parameter ensures that the selected optimal pair is based on a statistically meaningful sample rather than on a limited number of trades.
The results provided by this indicator are based on historical data and backtests, which may not guarantee future performance. Users should conduct their own analysis and use proper risk management before making trading decisions.

Moving Average Crossover StrategyCertainly! Below is an example of a professional trading strategy implemented in Pine Script for TradingView. This strategy is a simple moving average crossover strategy, which is a common approach used by many traders. It uses two moving averages (a short-term and a long-term) to generate buy and sell signals.
Input Parameters:
shortLength: The length of the short-term moving average.
longLength: The length of the long-term moving average.
Moving Averages:
shortMA: The short-term simple moving average (SMA).
longMA: The long-term simple moving average (SMA).
Conditions:
longCondition: A buy signal is generated when the short-term MA crosses above the long-term MA.
shortCondition: A sell signal is generated when the short-term MA crosses below the long-term MA.
Trade Execution:
The strategy enters a long position when the longCondition is met.
The strategy enters a short position when the shortCondition is met.
Plotting:
The moving averages are plotted on the chart.
Buy and sell signals are plotted as labels on the chart.
How to Use:
Copy the script into TradingView's Pine Script editor.
Adjust the shortLength and longLength parameters to fit your trading style.
Add the script to your chart and apply it to your desired timeframe.
Backtest the strategy to see how it performs on historical data.
This is a basic example, and professional traders often enhance such strategies with additional filters, risk management rules, and other indicators to improve performance.

RSI Crossover dipali parikhThis script generates buy and sell signals based on the crossover of the Relative Strength Index (RSI) and the RSI-based Exponential Moving Average (EMA). It also includes an additional condition for both buy and sell signals that the RSI-based EMA must be either above or below 50.
Key Features:
Buy Signal: Triggered when:
The RSI crosses above the RSI-based EMA.
The RSI-based EMA is above 50.
A green "BUY" label will appear below the bar when the buy condition is met.
Sell Signal: Triggered when:
The RSI crosses below the RSI-based EMA.
The RSI-based EMA is below 50.
A red "SELL" label will appear above the bar when the sell condition is met.
Customizable Inputs:
RSI Length: Adjust the period for calculating the RSI (default is 14).
RSI-based EMA Length: Adjust the period for calculating the RSI-based EMA (default is 9).
RSI Threshold: Adjust the threshold (default is 50) for when the RSI-based EMA must be above or below.
Visuals:
The RSI is plotted as a blue line.
The RSI-based EMA is plotted as an orange line.
Buy and sell signals are indicated by green "BUY" and red "SELL" labels.
Alerts:
Alerts can be set for both buy and sell conditions to notify you when either condition is met.
How to Use:
Use this script to identify potential buy and sell opportunities based on the behavior of the RSI relative to its EMA.
The buy condition indicates when the RSI is strengthening above its EMA, and the sell condition signals when the RSI is weakening below its EMA.
Strategy Use:
Ideal for traders looking to leverage RSI momentum for entering and exiting positions.
The RSI-based EMA filter helps smooth out price fluctuations, focusing on stronger signals.
This script is designed for both discretionary and algorithmic traders, offering a simple yet effective method for spotting trend reversals and continuation opportunities using RSI.

MA Crossover with Demand/Supply Zones + Stop Loss/Take ProfitStop Loss and Take Profit Inputs:
Added stopLossPerc and takeProfitPerc as inputs to allow the user to define the stop loss and take profit levels as a percentage of the entry price.
Stop Loss and Take Profit Calculation:
For long positions, the stop loss is calculated as strategy.position_avg_price * (1 - stopLossPerc), and the take profit is calculated as strategy.position_avg_price * (1 + takeProfitPerc).
For short positions, the stop loss is calculated as strategy.position_avg_price * (1 + stopLossPerc), and the take profit is calculated as strategy.position_avg_price * (1 - takeProfitPerc).
Exit Strategy:
Added strategy.exit to define the stop loss and take profit levels for each trade. The from_entry parameter ensures that the exit is tied to the specific entry order.
Flexibility:
The stop loss and take profit levels are dynamic and adjust based on the entry price of the trade.
How It Works:
When a buy signal is generated (MA crossover near a demand zone), the strategy enters a long position and sets a stop loss and take profit level based on the input percentages.
When a sell signal is generated (MA crossunder near a supply zone), the strategy enters a short position and sets a stop loss and take profit level based on the input percentages.
The trade will exit automatically if either the stop loss or take profit level is hit.
Example:
If the entry price for a long position is $100, and the stop loss is set to 1% while the take profit is set to 2%:
Stop loss level =
100
∗
(
1
−
0.01
)
=
100∗(1−0.01)=99
Take profit level =
100
∗
(
1
+
0.02
)
=
100∗(1+0.02)=102
Notes:
You can adjust the stopLossPerc and takeProfitPerc inputs to suit your risk management preferences.
Always backtest the strategy to ensure the stop loss and take profit levels are appropriate for your trading instrument and timeframe.

Long Position with 1:3 Risk Reward and 20EMA CrossoverThe provided Pine Script code implements a strategy to identify long entry signals based on a 20-EMA crossover on a 5-minute timeframe. Once a buy signal is triggered, it calculates and plots the following:
Entry Price: The price at which the buy signal is generated.
Stop Loss: The low of the previous candle, acting as a risk management tool.
Take Profit: The price level calculated based on a 1:3 risk-reward ratio.
Key Points:
Buy Signal: A buy signal is generated when the current 5-minute candle closes above the 20-EMA.
Risk Management: The stop-loss is set below the entry candle to limit potential losses.
Profit Target: The take-profit is calculated based on a 1:3 risk-reward ratio, aiming for a potential profit three times the size of the risk.
Visualization: The script plots the entry price, stop-loss, and take-profit levels on the chart for visual clarity.
Remember:
Backtesting: It's crucial to backtest this strategy on historical data to evaluate its performance and optimize parameters.
Risk Management: Always use appropriate risk management techniques, such as stop-loss orders and position sizing, to protect your capital.
Market Conditions: Market conditions can change, and strategies that worked in the past may not perform as well in the future. Continuously monitor and adapt your strategy.
By understanding the core components of this script and applying sound risk management principles, you can effectively use it to identify potential long entry opportunities in the market.


MA Crossover StrategyIt is very simple strategy, in this you will will whenever MA 7 crossover MA 30 you will get the Buy and Sell signal. Best time frame to test this strategy is 4 hour and 1 day. Also you can try 1 hour and 15 min time frame

MACD Crossover with +/- FilterThis is to directly target when MACD crosses the Signal line. The purpose of this script is to target a +/- change of 3 in the MACD value after the most recent cross. It uses the value of the MACD line and holds it until a value of 3.00 + or - a crossover or crossunder happens. That's the significance of the red and green circles that appear on the chart. This is not financial advice, but I wanted to recreate what a friend of mine was doing manually and automate it for him.
The first circle that appears after MACD/SIGNAL lines cross would represent a potential trade idea. The circles after the first one match the intention of the first dot as they meet the condition of more than a value of -3 or +3 as the previous dot.
Inputs:
Standard Inputs as normal MACD (Moving Average Converging Divergence) within TradingView
Fast Length: User can change it to any value they want
Slow Length: User can change it to any value they want
Standard 12, 26, 9 as normal MACD // 9 being signal smoothing
Oscillator and Signal Line moving average type is using EMA's
Timeframe is dependent on user chart.
Circles are used for signaling the change in values. Red indicates a short-term bearish trend. Green indicates a short-term bullish trend.
Tested on lower timeframes:
1m, 3m, 5m, 15m, 60m
Not used as much on higher timeframes. Used for trading futures. This is what I use it for. It can be used for other futures than just NQ or ES, but those 2 are the ones that I've tested. Code it shown below for users to tinker with.
Style of indication symbol can be changed via settings within the indicator in the "Style" tab, as well as location of the symbol(s). Additionally, color can be changed as well, if you prefer different colors.
Not financial advice. Just trade ideas.
Vortex Cross w/MA ConfirmationThis script is a trading strategy that combines the Vortex Indicator and a Moving Average (MA) to generate potential entry signals for long and short positions.
1. Vortex Indicator:
The Vortex Indicator consists of two lines: Vortex Positive (VIP) and Vortex Negative (VIM). It is designed to identify trend direction and measure the strength of a trend.
2. Moving Average (MA):
The script uses a chosen type of Moving Average (SMA, EMA, SMMA, WMA, or VWMA) to smooth the price data. The smoothed line is referred to as the "Smoothing Line."
3. Determine Long and Short Conditions:
The script looks for potential long entry signals when VIP crosses above VIM, highlighting each crossover on the chart, and the closing price is above the Smoothing Line. It searches for short entry signals when VIM crosses above VIP, with the closing price is below the Smoothing Line. When the long or short conditions are met, the strategy enters either a long or short position accordingly.
Potential Usage:
The strategy can be utilized in trending markets, where the Vortex Indicator helps identify trend direction and strength, and the Moving Average smooths the price data to filter out some noise. It aims to capture trends and ride them while avoiding false signals during choppy or sideways markets.
Moving Average - TREND POWER v1.1- (AS)0)NOTE:
This is first version of this indicator. It's way more complicated than it should be. Check out Moving Average-TREND POWER v2.1-(AS), its waaaaay less complicated and might be better.Enjoy...
1)INTRODUCTION/MAIN IDEA:
In simpliest form this script is a trend indicator that rises if Moving average if below price or falling if above and going back to zero if there is a crossover with a price. To use this indicator you will have to adjust settings of MAs and choose conditions for calculation.
While using the indicator we might have to define CROSS types or which MAs to use. List of what cross types are defined in the script and Conditiones to choose from.The list will be below.
2) COMPOSITION:
-MA1 can be defined by user in settings, possible types: SMA, EMA, RMA, HMA, TEMA, DEMA, LSMA, WMA.
-MA2 is always ALMA
3) OVERLAY:
Default is false but if you want to see MA1/2 on chart you can change code to true and then turn on overlay in settings. Most plot settings are avalible only in OV=false.
if OV=true possible plots ->MA1/2, plotshape when choosen cross type
if OV=false -> main indicator,TSHs,Cross counter
4)PRESETS :
Indicator has three modes that can be selected in settings. First two are presets and do not require selecting conditions as they set be default.
-SIMPLE - most basic
-ABSOLUTE - shows only positive values when market is trending or zero when in range
-CUSTOM - main and the most advanced form that will require setting conditions to use in calculating trend
4.1)SIMPLE – this is the most basic form of conditions that uses only First MA. If MA1 is below selected source (High/Low(High for Uptrend and Low for DNtrend or OHLC4) on every bar value rises by 0.02. if it above Low or OHLC4 it falls by 0.02 with every bar. If there is a cross of MA with price value is zero. This preset uses CROSS_1_ULT(list of all cross types below)
4.2) ABSOLUTE – does not show direction of the trend unlike others and uses both MA1 and MA2. Uses CROSS type 123_ULT
4.3) CUSTOM – here we define conditions manually. This mode is defined in parts (5-8 of description)
5)SETTINGS:
SOURCE/OVERLAY(line1) – select source of calculation form MA1/MA2, select for overlay true (look point 3)
TRESHOLDS(line2). – set upper and lower THS, turn TSHs on/off
MA1(line3) – Length/type of MA/Offset(only if MA type is LSM)
MA2(line4) – length/offset/sigma -(remember to set ma in the way that in Uptrend MA2MA1 in DNtrend)
Use faster MA types for short term trends and slower types / bigger periods for longer term trends, defval MA1/2 settings
are pretty much random so using them is not recomended.
CROSSshape(line5) – choose which cross type you want to plot on chart(only in OV=true) or what type you want to use in counting via for loops,
CROSScount(line6) – set lookback for type of cross choosen above
BOOLs in lines 5 and 6 - plotshape if OV=true/plot CROSScount histogram (if OV=false)
Lines 7 and 8 – PRESET we want to use /SRC for calculation of indicator/are conditions described below/which MAs to use/Condition for
reducing value t 0 - (if PRESET is ABSOLUTE or SIMPLE only SRC should be set(Line 8 does not matter if not CUSTOM))
5)SOURCE for CONDS:
Here you can choose between H/L and OHLC. If H/L value grow when MAlow. If OHLC MAOHLC. H/L is set by default and recommended. This can be selected for all presets not only CUSTOM
6)CROSS types LIST:
“1 means MA1, 2 is MA2 and 3 I cross of MA1/MA2. L stands for low and H for high so for example 2H means cross of MA2 and high”
NAME -DEFINITION Number of possible crosses
1L - cross of MA1 and low 1
1H - cross of MA1 and high 1
1HL - cross of MA1 and low or MA1 and high 2 -1L/1H
2L - cross of MA2 and low 1
2H - cross of MA2 and high 1
2HL - cross of MA2 and low or MA1 and high 2 -2L/2H
12L - cross of MA1 and low or MA2 and low 2 -1L/2L
12H - cross of MA1 and high or MA2 and high 2 -1H/2H
12HL - MA1/2 and high/low 4 -1H/1L/2H/2L
3 -cross of MA1 and MA2 1
123HL -crosses from 12HL or 3 5 -12HL/3
1_ULT - cross of MA1 with any of price sources(close,low,high,ohlc4 etc…)
2_ULT - cross of MA2 with any of price sources(close,low,high,ohlc4 etc…)
123_ULT – all crosses possible of MA1/2 (all of the above so a lot)
7)CRS CONDS:
“conditions to reduce value back to zero”
>/< - 0 if indicator shows Uptrend and there’s a cross with high of selected MA or 0 if in DNtrend and cross with low. Better for UP/DN trend detection
ALL – 0 if cross of MA with high or low no matter the trend, better for detecting consolidation
ULT – if any cross of selected MA, most crosses so goes to 0 most often
8)MA selection and CONDS:
-MA1: only MA1 is used,if MA1 below price value grows and the other way around
MA1price =-0.02
-MA2 – only MA2 is used, same conditions as MA1 but using MA2
MA2price =-0.02
-BOTH – MA1 and MA2 used, grows when MA1 if below, grows faster if MA1 and MA2 are below and fastest when MA1 and MA2 are below and MA2price=-0.02
-MA1 and MA2 >price=-0.03
-MA1 and MA2 ?price and MA2>MA1=-0.04
9)CONDITIONS SELECTION SUMMARRY:
So when CUSTOM we choose :
1)SOURCE – H/L or OHLC
2)MAs – MA1/MA2/BOTH
3)CRS CONDS (>/<,ALL,ULT)
So for example...
if we take MA1 and ALL value will go to zero if 1HL
if MA1 and >/< - 0 if 1L or 1H (depending if value is positive or negative).(1L or 1H)
If ALL and BOTH zero when 12HL
If BOTH and ULT value goes back to zero if Theres any cross of MA1/MA2 with price or cross of MA1 and MA2.(123_ULT)
If >/< and BOTH – 0 if 12L in DNtrend or 12H if UPtrend
10) OTHERS
-script was created on EURUSD 5M and wasn't tested on different markets
-default values of MA1/MA2 aren't optimalized so do not
-There might be a logical error in the script so let me know if you find it (most probably in 'BOTH')
-thanks to @AlifeToMake for help
-if you have any ideas to improve let me know
-there are also tooltips to help

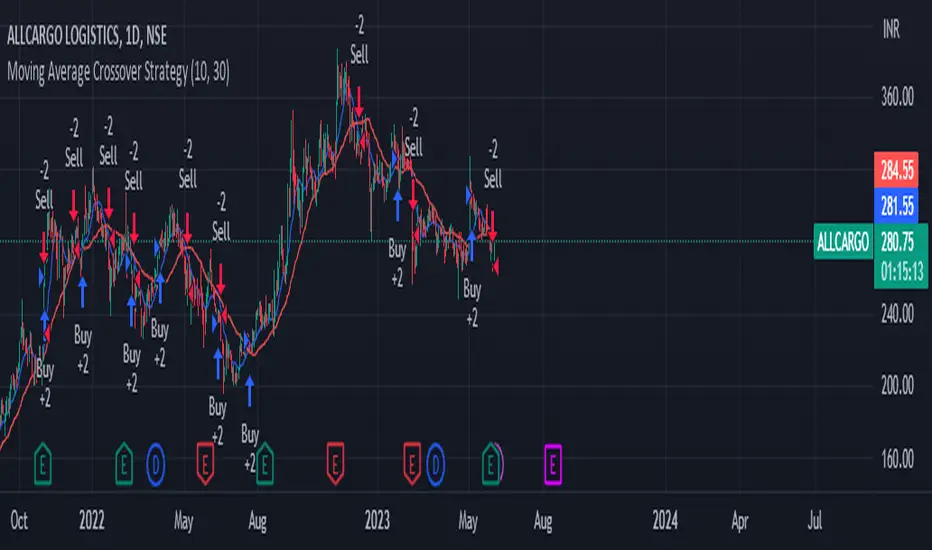
Moving Average Crossover Strategymoving average crossover startegy 10*30
it indicates when to buy or sell
The Flash-Strategy (Momentum-RSI, EMA-crossover, ATR)The Flash-Strategy (Momentum-RSI, EMA-crossover, ATR)
Are you tired of manually analyzing charts and trying to find profitable trading opportunities? Look no further! Our algorithmic trading strategy, "Flash," is here to simplify your trading process and maximize your profits.
Flash is an advanced trading algorithm that combines three powerful indicators to generate highly selective and accurate trading signals. The Momentum-RSI, Super-Trend Analysis and EMA-Strategy indicators are used to identify the strength and direction of the underlying trend.
The Momentum-RSI signals the strength of the trend and only generates trading signals in confirmed upward or downward trends. The Super-Trend Analysis confirms the trend direction and generates signals when the price breaks through the super-trend line. The EMA-Strategy is used as a qualifier for the generation of trading signals, where buy signals are generated when the EMA crosses relevant trend lines.
Flash is highly selective, as it only generates trading signals when all three indicators align. This ensures that only the highest probability trades are taken, resulting in maximum profits.
Our trading strategy also comes with two profit management options. Option 1 uses the so-called supertrend-indicator which uses the dynamic ATR as a key input, while option 2 applies pre-defined, fixed SL and TP levels.
The settings for each indicator can be customized, allowing you to adjust the length, limit value, factor, and source value to suit your preferences. You can also set the time period in which you want to run the backtest and how many dollar trades you want to open in each position for fully automated trading.
Choose your preferred trade direction and stop-loss/take-profit settings, and let Flash do the rest. Say goodbye to manual chart analysis and hello to consistent profits with Flash. Try it now!
General Comments
This Flash Strategy has been developed in cooperation between Baby_whale_to_moon and JS-TechTrading. Cudos to Baby_whale_to_moon for doing a great job in transforming sophisticated trading ideas into pine scripts.
Detailed Description
The “Flash” script considers the following indicators for the generation of trading signals:
1. Momentum-RSI
2. ‘Super-Trend’-Analysis
3. EMA-Strategy
1. Momentum-RSI
• This indicator signals the strength of the underlying upward- or downward-trend.
• The signal range of this indicator is from 0 to 100. Values > 60 indicate a confirmed upward- or downward-trend.
• The strategy will only generate trading signals in case the stock (or any other financial security) is in a confirmed upward- (long entry signals) or downward-trend (short entry signals).
• This indicator provides information with regards to the strength of the underlying trend and it does not give any insight with regard to the direction of the trend. Therefore, this strategy also considers other indicators which provide technical confirmation with regards to the direction of the underlying trend.
Graph 1 shows this concept:
• The Momentum-RSI indicator gives lower readings during consolidation phases and no trading signals are generated during these periods.
Example (graph 2):
2. Super-Trend Analysis
• The red line in the graph below represents the so-called super-trend-line. Trading signals are only generated in case the price action breaks through this super-trend-line indicating a new confirmed upward-trend (or downward-trend, respectively).
• If that happens, the super trend-line changes its color from red to green, giving confirmation that the trend changed from bearish to bullish and long-entries can be considered.
• The vice-versa approach can be considered for short entries.
Graph 3 explains this concept:
3. Exponential Moving Average / EMA-Strategy
The functionality of this EMA-element of the strategy has been programmed as follows:
• The exponential moving average and two other trend lines are being used as qualifiers for the generation of trading-signals.
• Buy-signals for long-entries are only considered in case the EMA (yellow line in the graph below) crosses the red line.
• Sell-signals for short-entries are only considered in case the EMA (yellow line in the graph below) crosses the green line.
An example is shown in graph 4 below:
We use this indicator to determine the new trend direction that may occur by using the data of the price's past movement.
4. Bringing it all together
This section describes in detail, how this strategy combines the Momentum-RSI, the super-trend analysis and the EMA-strategy.
The strategy only generates trading-signals in case all of the following conditions and qualifiers are being met:
1. Momentum-RSI is higher than the set value of this strategy. The standard and recommended value is 60 (graph 5):
2. The super-trend analysis needs to indicate a confirmed upward-trend (for long-entry signals) or a confirmed downward-trend (for short-entry signals), respectively.
3. The EMA-strategy needs to indicate that the stock or financial security is in a confirmed upward-trend (long-entries) or downward-trend (short-entries), respectively.
The strategy will only generate trading signals if all three qualifiers are being met. This makes this strategy highly selective and is the key secret for its success.
Example for Long-Entry (graph 6):
When these conditions are met, our Long position is opened.
Example for Short-Entry (graph 7):
Trade Management Options (graph 8)
Option 1
In this dynamic version, the so-called supertrend-indicator is being used for the trade exit management. This supertrend-indicator is a sophisticated and optimized methodology which uses the dynamic ATR as one of its key input parameters.
The following settings of the supertrend-indicator can be changed and optimized (graph 9):
The dynamic SL/TP-lines of the supertrend-indicator are shown in the charts. The ATR-length and the supertrend-factor result in a multiplier value which can be used to fine-tune and optimize this strategy based on the financial security, timeframe and overall market environment.
Option 2 (graph 10):
Option 2 applies pre-defined, fixed SL and TP levels which will appear as straight horizontal lines in the chart.
Settings options (graph 11):
The following settings can be changed for the three elements of this strategy:
1. (Length Mom-Rsi): Length of our Mom-RSI indicator.
2. Mom-RSI Limit Val: the higher this number, the more momentum of the underlying trend is required before the strategy will start creating trading signals.
3. The length and factor values of the super trend indicator can be adjusted:ATR Length SuperTrend and Factor Super Trend
4. You can set the source value used by the ema trend indicator to determine the ema line: Source Ema Ind
5. You can set the EMA length and the percentage value to follow the price: Length Ema Ind and Percent Ema Ind
6. The backtesting period can be adjusted: Start and End time of BackTest
7. Dollar cost per position: this is relevant for 100% fully automated trading.
8. Trade direction can be adjusted: LONG, SHORT or BOTH
9. As we explained above, we can determine our stop-loss and take-profit levels dynamically or statically. (Version 1 or Version 2 )
Display options on the charts graph 12):
1. Show horizontal lines for the Stop-Loss and Take-profit levels on the charts.
2. Display relevant Trend Lines, including color setting options for the supertrend functionality. In the example below, green lines indicate a confirmed uptrend, red lines indicate a confirmed downtrend.
Other comments
• This indicator has been optimized to be applied for 1 hour-charts. However, the underlying principles of this strategy are supply and demand in the financial markets and the strategy can be applied to all timeframes. Daytraders can use the 1min- or 5min charts, swing-traders can use the daily charts.
• This strategy has been designed to identify the most promising, highest probability entries and trades for each stock or other financial security.
• The combination of the qualifiers results in a highly selective strategy which only considers the most promising swing-trading entries. As a result, you will normally only find a low number of trades for each stock or other financial security per year in case you apply this strategy for the daily charts. Shorter timeframes will result in a higher number of trades / year.
• Consequently, traders need to apply this strategy for a full watchlist rather than just one financial security.

Crossing TableCrossing Table V1
I created this indicator as it had been asked for a number of times to create a crossover/under table screen and here it is!!!
The indicator is set up to be selected from SMA, EMA and Volume.
The SMA is defaulted to 2/10 but it is customizable to whatever SMA you choose to use.
Volume is based off a volume formula and the volume settings in the indicators settings, and the table will show either buyers/sellers on the last candle on the volume in the settings.
Just like the SMA the EMA option will be based off the default value of 5/13 but can be customized to your choosing.
If there are any question or comments just let me know :)

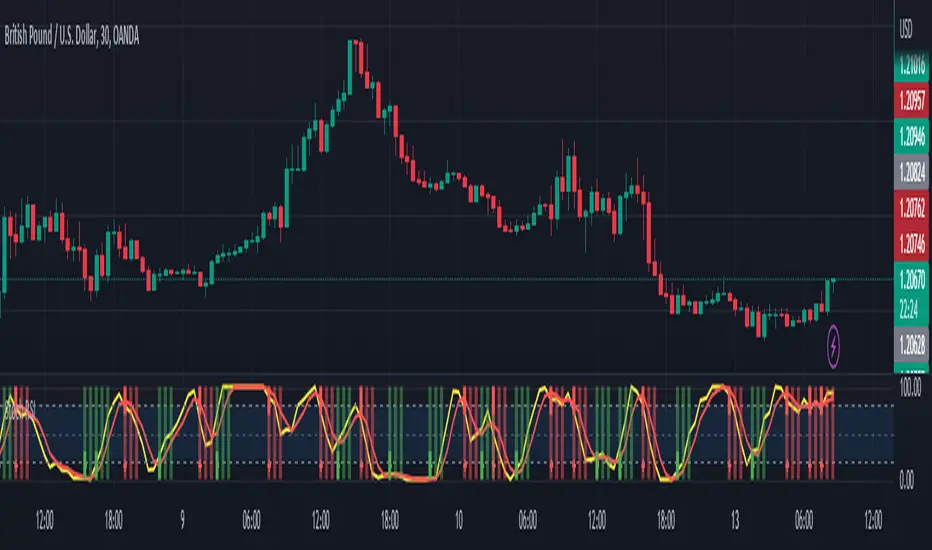
Stochastic RSI with crossover-indication and alertsOn the normal Stochastic RSI it may be hard to see the exact crosses between the two lines. This version makes that a little easier.
Shows green line when K-line crosses up the D-line, but below the 50-level (this treshold level can be adjusted in the settings).
Shows red line when K-line crosses down the D-line, but above the 50-level (treshold level can be adjusted).
Option to show lines on the subsequent one or two bars. For instance you can use a rule that a crossover is still valid for trade-entry when it happened 2 bars ago.
Stoch/RSI with EMA50 Cross & HHLLA hybrid but simple indicator that plots 4 strategies in one pane .
1) RSI Indicator
2) Stoch RSI
3) EMA50 Cross (To determine direction in current timeframe)
4) Higher Highs & Lower Lows to analyze the trend and break of trend
The relative strength index (RSI) is a momentum indicator used in technical analysis. It is displayed as an oscillator (a line graph) on a scale of zero to 100. When the RSI indicator crosses 30 on the RSI chart, it is a bullish sign and when it crosses 70, it is a bearish sign.
The Stochastic RSI (StochRSI) is also a momentum indicator used in technical analysis. It is displayed as an oscillator (a line graph) on a scale of zero to 100. When the StochRSI indicator crosses 20 on the RSI chart, it is a bullish sign and when it crosses 80, it is a bearish sign.
The EMA50Cross denotes two cases in the script:
a) A crossover of CMP on the EMA50 is highlighted by a green bar signals a possible bullish trend
b) A crossunder of CMP on the EMA50 is highlighted by a red bar signals a possible bearish trend
The HHLL is denoted by mneumonics HH, HL,LH, LL. A combination of HHs and HLs denotes a uptrend while the combination of LLs and LHs denoted a downtrend
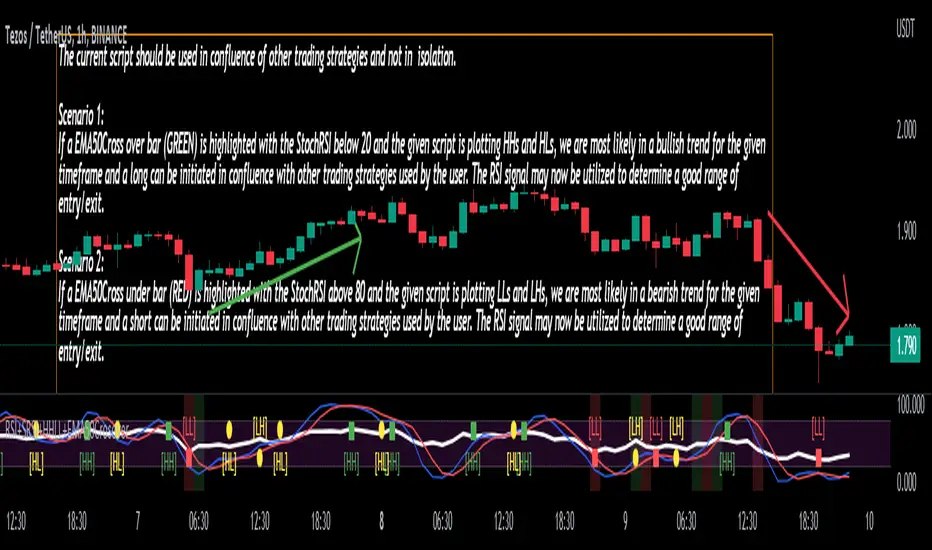
The current script should be used in confluence of other trading strategies and not in isolation.
Scenario 1:
If a EMA50Cross over bar (GREEN) is highlighted with the StochRSI below 20 and the given script is plotting HHs and HLs, we are most likely in a bullish trend for the given timeframe and a long can be initiated in confluence with other trading strategies used by the user. The RSI signal may now be utilized to determine a good range of entry/exit.
Scenario 2:
If a EMA50Cross under bar (RED) is highlighted with the StochRSI above 80 and the given script is plotting LLs and LHs, we are most likely in a bearish trend for the given timeframe and a short can be initiated in confluence with other trading strategies used by the user. The RSI signal may now be utilized to determine a good range of entry/exit.
Disclaimer:
The current script should be used in confluence with other trading strategies and not in isolation. The scripts works best on 4H and 1D Timeframes and should be used with caution on lower timeframes.
This indicator is not intended to give exact entry or exit points for a trade but to provide a general idea of the trend & determine a good range for entering or exiting the trade. Please DYOR
Credit & References:
This script uses the default technical analysis reference library provided by PineScript (denoted as ta)

TrendicatorThis is a very simple crossover script that looks at a exponential moving average with a standard length set at 20, which may be redefined by the user. A (Uptrend) buy signal is given once a candle closes above the moving average, coloring the exponential average green, and a sell signal is given once a candle closes below the moving average, coloring the exponential average red.
The goal of this indicator is to provide the user with a rather robust idea of whether the market is trending upwards or downwards, more so than providing definitive buy or sell signals. It works with symbols that do not change drastically in shorter time periods (I only trade XAU/USD). FXOPEN:XAUUSD

Moving Averages With Cross AlertsA simple way to add up to 5 moving averages with optional crossover/crossunder alerts.
Available options for Moving Average Type are:
SMA
EMA (default)
HMA
RMA
WMA
VWMA
VWAP
ALMA
By default, 5 moving averages are enabled and set to the following:
MA1 set to 5
MA2 set to 13
MA3 set to 50
MA4 set to 200
MA5 set to 800
Each moving average has the following options:
Enable/Disable
Source (default is close)
Length
Color