Supertrend + MACD with Advanced FiltersDetailed Guide
1. Indicator Overview
Purpose:
This enhanced indicator combines Supertrend and MACD to signal potential trend changes. In addition, it now includes several extra filters for more reliable signals:
Multi-Timeframe (MTF) Confirmation: Checks a higher timeframe’s trend.
ADX (Momentum) Filter: Ensures the market is trending strongly.
Dynamic Factor Adjustment: Adapts the Supertrend sensitivity to current volatility.
Volume Filter: Verifies that current volume is above average.
Each filter can be enabled or disabled according to your preference.
How It Works:
The Supertrend calculates dynamic support/resistance levels based on ATR and an adjustable factor, while MACD identifies momentum shifts via its crossovers. The additional filters then confirm whether the conditions meet your criteria for a trend change. If all enabled filters align, the indicator plots a shape and triggers an alert.
2. Supertrend Component with Dynamic Factor
Base Factor & ATR Period:
The Supertrend uses these inputs to compute its dynamic bands.
Dynamic Factor Toggle:
When enabled, the factor is adjusted by comparing the current ATR to its simple moving average. This makes the indicator adapt to higher or lower volatility conditions, helping to reduce false signals.
3. MACD Component
Parameters:
Standard MACD settings (Fast MA, Slow MA, Signal Smoothing) determine the responsiveness of the MACD line. Crossovers between the MACD line and its signal line indicate potential trend reversals.
4. Multi-Timeframe (MTF) Filter
Function:
If enabled, the indicator uses a higher timeframe’s simple moving average (SMA) to confirm the prevailing trend.
Bullish Confirmation: The current close is above the higher timeframe SMA.
Bearish Confirmation: The current close is below the higher timeframe SMA.
5. ADX Filter (Momentum)
Custom Calculation:
Since the built-in ta.adx function may not be available, a custom ADX is calculated. This involves:
Determining positive and negative directional movements (DMs).
Smoothing these values to obtain +DI and -DI.
Calculating the DX and then smoothing it to yield the ADX.
Threshold:
Only signals where the ADX exceeds the set threshold (default 20) are considered valid, ensuring that the market is trending strongly enough.
6. Volume Filter
Function:
Checks if the current volume exceeds the average volume (SMA) multiplied by a specified factor. This helps confirm that a price move is supported by sufficient trading activity.
7. Combined Signal Logic & Alerts
Final Signal:
A bullish signal is generated when:
MACD shows a bullish crossover,
Supertrend indicates an uptrend,
And all enabled filters (MTF, ADX, volume) confirm the signal.
The bearish signal is generated similarly in the opposite direction.
Alerts:
Alert conditions are set so that TradingView can notify you via pop-up, email, or SMS when these combined conditions are met.
8. User Adjustments
Toggle Filters:
Use the on/off switches for MTF, ADX, and Volume filters as needed.
Parameter Tuning:
Adjust the ATR period, base factor, higher timeframe settings, ADX period/threshold, and volume multiplier to match your trading style and market conditions.
Backtesting:
Always backtest your settings to ensure that they perform well with your strategy.
Cerca negli script per "crossover债券是什么"
Moneyball EMA-MACD indicator [VinnieTheFish]Summary of the Moneyball EMA-MACD Indicator Script
Author: VinnieTheFish
Purpose:
This indicator helps traders identify trend direction, momentum shifts, and potential trade signals based on EMA and MACD crossovers.
This Pine Script is a custom indicator that combines Exponential Moving Averages (EMAs) and MACD (Moving Average Convergence Divergence) to analyze price trends and momentum. The script uses a custom 9/50 MACD with a 16 smoothing period. The script is written in a way that you can create your own custom MACD settings and create alerts based on those parameters. The chart bars are color coded based on the relative position of the MACD and Signal line primarily for bullish long trade setups.
Bar color coding helps the trader spot potential reversals based on where the price currently resides in relation to the custom 9/50 EMA based MACD and the 16 period smoothing period for the signal line. Indicator also has custom alerts to notify the trader when a potential trade setup exists that correspond with the bar color change.
Question: So why is this called the Moneywell EMA-MACD Indicator?
Answer: In the movie Moneyball the Oakland A's broke down how to win a championship based on data. To make the playoffs you needed so many wins, then broken down by runs and then broken down to base hits. A base hit was good as a walk. With trading often times we look too often for home runs and ignore the importance of getting on base with small wins. This indicator was designed on shorter timeframes to identify those base hits, but can also be adapted to higher timeframes for swing trading.
Key Features:
User Inputs:
Configurable fast and slow lengths for MACD calculation.
Choice between SMA and EMA for oscillator and signal line smoothing.
Customizable signal smoothing length.
EMA Calculation:
Computes 3 EMA, 9 EMA, 20 EMA, and 50 EMA to track short-term and long-term trends.
MACD Calculation:
Computes MACD using either SMA or EMA based on user selection.
Generates the MACD signal line for comparison.
Crossover Conditions:
Detects MACD and Signal line crossovers above and below the zero line.
Identifies price momentum shifts.
Bar Coloring Logic:
Green: MACD is above 0 and above the signal line.
White: MACD is below the signal line.
Orange: MACD is below 0 but above the signal line.
Fuchsia: Bullish EMA 3/9 cross but price is still below the 20/50 EMA.
Alerts for Key Trading Signals:
MACD crossing above/below the zero line.
Signal line crossing above/below the zero line.
MACD reaching new highs/lows.
Alerts for colored bar conditions.

Volume Weighted HMA Index | mad_tiger_slayerTitle: 🍉 Volume Weighted HMA Index | mad_tiger_slayer 🐯
Description:
The Volume Weighted HMA Index is a cutting-edge indicator designed to enhance the accuracy and responsiveness of trading signals by combining the power of volume with the Hull Moving Average (HMA). This indicator adjusts the HMA based on volume-weighted price changes, providing faster and more reliable entry and exit signals while reducing the likelihood of false signals.
Intended and Best Uses:
Used for Strategy Creation:
Extremely Quick Entries and Exits
Intended for Higher timeframe however can be used for scalping paired with additional scripts.
Can be paired to create profitable strategies
TREND FOLLOWING NOT MEAN REVERTING!!!!
[Key Features:
Volume Integration: Dynamically adjusts the HMA using volume data to prioritize higher-volume bars, ensuring that market activity plays a crucial role in signal generation.
Enhanced Signal Clarity: The indicator calculates precise long and short signals by detecting volume-weighted HMA crossovers.
Bar Coloring: Visually differentiate bullish and bearish conditions with customizable bar colors, making trends easier to identify.
Custom Signal Plotting: Optional long and short signal markers for a clear visual representation of potential trade opportunities.
Highly Configurable: Adjust parameters such as volume length and calculation source to tailor the indicator to your trading preferences and strategy.
How It Works:
Volume Weighting: The indicator calculates the HMA using a volume-weighted price change, amplifying the influence of high-volume periods on the moving average.
Trend Identification: Crossovers of the volume-weighted HMA with zero determine trend direction, where:
A bullish crossover signals a long condition.
A bearish crossunder signals a short condition.
Visual Feedback: Bar colors and optional signal markers provide real-time insights into trend direction and trading signals.
Use Cases:
Trend Following: Quickly identify emerging trends with volume-accelerated HMA calculations.
Trade Confirmation: Use the indicator to confirm the strength and validity of your trade setups.
Custom Signal Integration: Combine this indicator with your existing strategies to refine entries and exits.
Notes:
Ensure that your trading instrument provides volume data for accurate calculations. If no volume is available, the script will notify you.
This script works best when combined with other indicators or trading frameworks for a comprehensive market view.
Inspired by the community and designed for traders looking to stay ahead of the curve, the Volume Weighted HMA Index is a versatile tool for traders of all levels.
Uptrick: Dynamic AMA RSI Indicator### **Uptrick: Dynamic AMA RSI Indicator**
**Overview:**
The **Uptrick: Dynamic AMA RSI Indicator** is an advanced technical analysis tool designed for traders who seek to optimize their trading strategies by combining adaptive moving averages with the Relative Strength Index (RSI). This indicator dynamically adjusts to market conditions, offering a nuanced approach to trend detection and momentum analysis. By leveraging the Adaptive Moving Average (AMA) and Fast Adaptive Moving Average (FAMA), along with RSI-based overbought and oversold signals, traders can better identify entry and exit points with higher precision and reduced noise.
**Key Components:**
1. **Source Input:**
- The source input is the price data that forms the basis of all calculations. Typically set to the closing price, traders can customize this to other price metrics such as open, high, low, or even the output of another indicator. This flexibility allows the **Uptrick** indicator to be tailored to a wide range of trading strategies.
2. **Adaptive Moving Average (AMA):**
- The AMA is a moving average that adapts its sensitivity based on the dominant market cycle. This adaptation allows the AMA to respond swiftly to significant price movements while smoothing out minor fluctuations, making it particularly effective in trending markets. The AMA adjusts its responsiveness dynamically using a calculated phase adjustment from the dominant cycle, ensuring it remains responsive to the current market environment without being overly reactive to market noise.
3. **Fast Adaptive Moving Average (FAMA):**
- The FAMA is a more sensitive version of the AMA, designed to react faster to price changes. It serves as a signal line in the crossover strategy, highlighting shorter-term trends. The interaction between the AMA and FAMA forms the core of the signal generation, with crossovers between these lines indicating potential buy or sell opportunities.
4. **Relative Strength Index (RSI):**
- The RSI is a momentum oscillator that measures the speed and change of price movements, providing insights into whether an asset is overbought or oversold. In the **Uptrick** indicator, the RSI is used to confirm the validity of crossover signals between the AMA and FAMA, adding an additional layer of reliability to the trading signals.
**Indicator Logic:**
1. **Dominant Cycle Calculation:**
- The indicator starts by calculating the dominant market cycle using a smoothed price series. This involves applying exponential moving averages to a series of price differences, extracting cycle components, and determining the instantaneous phase of the cycle. This phase is then adjusted to provide a phase adjustment factor, which plays a critical role in determining the adaptive alpha.
2. **Adaptive Alpha Calculation:**
- The adaptive alpha, a key feature of the AMA, is computed based on the fast and slow limits set by the trader. This alpha is clamped within these limits to ensure the AMA remains appropriately sensitive to market conditions. The dynamic adjustment of alpha allows the AMA to be highly responsive in volatile markets and more conservative in stable markets.
3. **Crossover Detection:**
- The indicator generates trading signals based on crossovers between the AMA and FAMA:
- **CrossUp:** When the AMA crosses above the FAMA, it indicates a potential bullish trend, suggesting a buy opportunity.
- **CrossDown:** When the AMA crosses below the FAMA, it signals a potential bearish trend, indicating a sell opportunity.
4. **RSI Confirmation:**
- To enhance the reliability of these crossover signals, the indicator uses the RSI to confirm overbought and oversold conditions:
- **Buy Signal:** A buy signal is generated only when the AMA crosses above the FAMA and the RSI confirms an oversold condition, ensuring that the signal aligns with a momentum reversal from a low point.
- **Sell Signal:** A sell signal is triggered when the AMA crosses below the FAMA and the RSI confirms an overbought condition, indicating a momentum reversal from a high point.
5. **Signal Management:**
- To prevent signal redundancy during strong trends, the indicator tracks the last generated signal (buy or sell) and ensures that the next signal is only issued when there is a genuine reversal in trend direction.
6. **Signal Visualization:**
- **Buy Signals:** The indicator plots a "BUY" label below the bar when a buy signal is generated, using a green color to clearly mark the entry point.
- **Sell Signals:** A "SELL" label is plotted above the bar when a sell signal is detected, marked in red to indicate an exit or shorting opportunity.
- **Bar Coloring (Optional):** Traders have the option to enable bar coloring, where green bars indicate a bullish trend (AMA above FAMA) and red bars indicate a bearish trend (AMA below FAMA), providing a visual representation of the market’s direction.
**Customization Options:**
- **Source:** Traders can select the price data input that best suits their strategy (e.g., close, open, high, low, or custom indicators).
- **Fast Limit:** Adjustable sensitivity for the fast response of the AMA, allowing traders to tailor the indicator to different market conditions.
- **Slow Limit:** Sets the slower boundary for the AMA’s sensitivity, providing stability in less volatile markets.
- **RSI Length:** The period for the RSI calculation can be adjusted to fit different trading timeframes.
- **Overbought/Oversold Levels:** These thresholds can be customized to define the RSI levels that trigger buy or sell confirmations.
- **Enable Bar Colors:** Traders can choose whether to enable bar coloring based on the AMA/FAMA relationship, enhancing visual clarity.
**How Different Traders Can Use the Indicator:**
1. **Day Traders:**
- **Uptrick: Dynamic AMA RSI Indicator** is highly effective for day traders who need to make quick decisions in fast-moving markets. The adaptive nature of the AMA and FAMA allows the indicator to respond rapidly to intraday price swings. Day traders can use the buy and sell signals generated by the crossover and RSI confirmation to time their entries and exits with greater precision, minimizing exposure to false signals often prevalent in high-frequency trading environments.
2. **Swing Traders:**
- Swing traders can benefit from the indicator’s ability to identify and confirm trend reversals over several days or weeks. By adjusting the RSI length and sensitivity limits, swing traders can fine-tune the indicator to catch longer-term price movements, helping them to ride trends and maximize profits over medium-term trades. The dual confirmation of crossovers with RSI ensures that swing traders enter trades that have a higher probability of success.
3. **Position Traders:**
- For position traders who hold trades over longer periods, the **Uptrick** indicator offers a reliable method to stay in trades that align with the dominant trend while avoiding premature exits. By adjusting the slow limit and extending the RSI length, position traders can smooth out the indicator’s sensitivity, allowing them to focus on major market shifts rather than short-term volatility. The bar coloring feature also provides a clear visual indication of the overall trend, aiding in trade management decisions.
4. **Scalpers:**
- Scalpers, who seek to profit from small price movements, can use the fast responsiveness of the FAMA in conjunction with the RSI to identify micro-trends within larger market moves. The indicator’s ability to adapt quickly to changing conditions makes it a valuable tool for scalpers looking to execute numerous trades in a short period, capturing profits from minor price fluctuations while avoiding prolonged exposure.
5. **Algorithmic Traders:**
- Algorithmic traders can incorporate the **Uptrick** indicator into automated trading systems. The precise crossover signals combined with RSI confirmation provide clear and actionable rules that can be coded into algorithms. The adaptive nature of the indicator ensures that it can be used across different market conditions and timeframes, making it a versatile component of algorithmic strategies.
**Usage:**
The **Uptrick: Dynamic AMA RSI Indicator** is a versatile tool that can be integrated into various trading strategies, from short-term day trading to long-term investing. Its ability to adapt to changing market conditions and provide clear buy and sell signals makes it an invaluable asset for traders seeking to improve their trading performance. Whether used as a standalone indicator or in conjunction with other technical tools, **Uptrick** offers a dynamic approach to market analysis, helping traders to navigate the complexities of financial markets with greater confidence.
**Conclusion:**
The **Uptrick: Dynamic AMA RSI Indicator** offers a comprehensive and adaptable solution for traders across different styles and timeframes. By combining the strengths of adaptive moving averages with RSI confirmation, it delivers robust signals that help traders capitalize on market trends while minimizing the risk of false signals. This indicator is a powerful addition to any trader’s toolkit, enabling them to make informed decisions with greater precision and confidence. Whether you're a day trader, swing trader, or long-term investor, the **Uptrick** indicator can enhance your trading strategy and improve your market outcomes.

Advanced ADX [CryptoSea]The Advanced ADX Analysis is a sophisticated tool designed to enhance market analysis through detailed ADX calculations. This tool is built for traders who seek to identify market trends, strength, and potential reversals with higher accuracy. By leveraging the Average Directional Index (ADX), Directional Indicator Plus (DI+), and Directional Indicator Minus (DI-), this indicator offers a comprehensive view of market dynamics.
New Overlay Feature: This script uses the new 'force overlay' feature which lets you plot on the chart as well as plotting in an oscillator pane at the same time.
force_overlay=true
Key Features
Comprehensive ADX Tracking: Tracks ADX values along with DI+ and DI- to provide a complete view of market trend strength and direction. The ADX measures the strength of the trend, while DI+ and DI- indicate the trend direction. This combined analysis helps traders identify strong and weak trends with precision.
Trend Duration Monitoring: Monitors the duration of strong and weak trends, offering insights into trend persistence and potential reversals. By keeping track of how long the ADX has been above or below a certain threshold, traders can gauge the sustainability of the current trend.
Customizable Alerts: Features multiple alert options for strong trends, weak trends, and DI crossovers, ensuring traders are notified of significant market events. These alerts can be tailored to notify traders when certain conditions are met, such as when the ADX crosses a threshold or when DI+ crosses DI-.
Adaptive Display Options: Includes customizable background color settings and extended statistics display for in-depth market analysis. Users can choose to highlight strong or weak trends on the chart background, making it easier to visualize market conditions at a glance.
In the example below, we have a bullish scenario play out where the DI+ has been above the DI- for 11 candles and our dashboard shows the average is 10.48 candles. With the ADX above its threshold this would be a bullish signal.
This ended up in a 20%+ move to the upside. The dashboard will help point out things to consider when looking to exit the position, the DI+ getting close to the max DI+ duration would be a sign that momentum is weakening and that price may cool off or even reverse.
How it Works
ADX Calculation: Computes the ADX, DI+, and DI- values using a user-defined period. The ADX is derived from the smoothed average of the absolute difference between DI+ and DI-. This calculation helps determine the strength of a trend without considering its direction.
Trend Duration Analysis: Tracks and calculates the duration of strong and weak trends, as well as DI+ and DI- durations. This analysis provides a detailed view of how long a trend has been in place, helping traders assess the reliability of the trend.
Alert System: Provides a robust alert system that triggers notifications for strong trends, weak trends, and DI crossovers. The alerts are based on specific conditions such as the duration of the trend or the crossover of directional indicators, ensuring traders are informed about critical market movements.
Visual Enhancements: Utilizes color gradients and background settings to visually represent trend strength and duration. This feature enhances the visual analysis of trends, making it easier for traders to identify significant market changes at a glance.
In the example below, we see the ADX weakening after we have just had a move up, if you are looking to get into this position you want to see the ADX growing with either the DI+ or DI- breaking their average durations.
As you can see below, although the ADX manages to move above the threshold, there are no DI+/- breaks which is shown by price moving sideways. Not something most traders would be interested in.
Application
Strategic Decision-Making: Assists traders in making informed decisions by providing detailed analysis of ADX movements and trend durations. By understanding the strength and direction of trends, traders can better time their entries and exits.
Trend Confirmation: Reinforces trading strategies by confirming potential reversals and trend strength through ADX and DI analysis. This confirmation helps traders validate their trading signals, reducing the risk of false signals.
Customized Analysis: Adapts to various trading styles with extensive input settings that control the display and sensitivity of trend data. Traders can customize the indicator to suit their specific needs, making it a versatile tool for different trading strategies.
The Advanced ADX Analysis by is an invaluable addition to a trader's toolkit, offering depth and precision in market trend analysis to navigate complex market conditions effectively. With its comprehensive tracking, alert system, and customizable display options, this indicator provides traders with the tools they need to stay ahead of the market.

Fisher Transform on RSIOverview
The Fisher Transform on RSI indicator combines the Relative Strength Index (RSI) with the Fisher Transform to offer a refined tool for identifying market turning points and trends. By applying the Fisher Transform to the RSI, this indicator converts RSI values into a Gaussian normal distribution, enhancing the precision of detecting overbought and oversold conditions. This method provides a clearer and more accurate identification of potential market reversals than the standard RSI.
Key/Unique Features
Fisher Transform Applied to RSI : Transforms RSI values into a Gaussian normal distribution, improving the detection of overbought and oversold conditions.
Smoothing : Applies additional smoothing to the Fisher Transform, reducing noise and providing clearer signals.
Signal Line : Includes a signal line to identify crossover points, indicating potential buy or sell signals.
Custom Alerts : Built-in alert conditions for bullish and bearish crossovers, keeping traders informed of significant market movements.
Visual Enhancements : Background color changes based on crossover conditions, offering immediate visual cues for potential trading opportunities.
How It Works
RSI Calculation : The indicator calculates the Relative Strength Index (RSI) based on the selected source and period length.
Normalization : The RSI values are normalized to fit within a range of -1 to 1, which is essential for the Fisher Transform.
Fisher Transform : The normalized RSI values undergo the Fisher Transform, converting them into a Gaussian normal distribution.
Smoothing : The transformed values are smoothed using a simple moving average to reduce noise and provide more reliable signals.
Signal Line : A signal line, which is a simple moving average of the smoothed Fisher Transform, is plotted to identify crossover points.
Alerts and Visuals : Custom alert conditions are set for bullish and bearish crossovers, and the background color changes to indicate these conditions.
Usage Instructions
Trend Identification : Use the Fisher Transform on RSI to identify overbought and oversold conditions with enhanced precision, aiding in spotting potential trend reversals.
Trade Signals : Monitor the crossovers between the smoothed Fisher Transform and the signal line. A bullish crossover suggests a potential buying opportunity, while a bearish crossover indicates a potential selling opportunity.
Alerts : Set custom alerts based on the built-in conditions to receive notifications when important crossover events occur, ensuring you never miss a trading opportunity.
Visual Cues : Utilize the background color changes to quickly identify bullish (green) and bearish (red) conditions, providing immediate visual feedback on market sentiment.
Complementary Analysis : Combine this indicator with other technical analysis tools and indicators to enhance your overall trading strategy and make more informed decisions.

eha Moving Averages StrategyMoving Average based strategies are very popular ones among both long-term investors and short-term traders as they can be tailored to any time frame. One of the main moving average strategies are crossovers. The very simple type is a price crossover , which is when the price crosses above or below a moving average to signal a potential change in trend.
Another strategy is to apply two moving averages to a chart: one longer (or slow) and one shorter (or fast). When the shorter-term MA crosses above the longer-term MA, it's a buy signal, as it indicates that the trend is shifting up (also known as “ Golden Cross ”). Meanwhile, when the shorter-term MA crosses below the longer-term MA, it's a sell signal, as it indicates that the trend is shifting down (which is also known as “ Dead/Death Cross ”).
This is a study to find a suitable trading strategy for 4-6 hour time frames. As you can see the performance is currently very poor. It has just generated almost 90 trades in a very long period from January 2017 to the time of publishing the study for the first time.
Moving averages work quite well in strong trending conditions but poorly in choppy or ranging conditions. Adjusting the time frame can correct this problem temporarily, although, at some point, these issues are likely to occur regardless of the time frame chosen for the moving average(s).
I am working on this basic strategy to make its performance better and I will update the post in the future. So keep in touch by following the post.
Why have I republished my study?
It sounds like TradingView stores and indexes scripts based on the title of the post rather than the actual title of the scripts and if one chose general terms as the title of the post, the TradingView script search engine may be unable to find it. So I decided to repost the strategy with a more searchable and unique prefix of " eha ".
Please provide me with your precious feedback.

RSI ROC Signals with Price Action# RSI ROC Signals with Price Action
## Overview
The RSI ROC (Rate of Change) Signals indicator is an advanced momentum-based trading system that combines RSI velocity analysis with price action confirmation to generate high-probability buy and sell signals. This indicator goes beyond traditional RSI analysis by measuring the speed of RSI changes and requiring price confirmation before triggering signals.
## Core Concept: RSI Rate of Change (ROC)
### What is RSI ROC?
RSI ROC measures the **velocity** or **acceleration** of the RSI indicator, providing insights into momentum shifts before they become apparent in traditional RSI readings.
**Formula**: `RSI ROC = ((Current RSI - Previous RSI) / Previous RSI) × 100`
### Why RSI ROC is Superior to Standard RSI:
1. **Early Momentum Detection**: Identifies momentum shifts before RSI reaches traditional overbought/oversold levels
2. **Velocity Analysis**: Measures the speed of momentum changes, not just absolute levels
3. **Reduced False Signals**: Filters out weak momentum moves that don't sustain
4. **Dynamic Thresholds**: Adapts to market volatility rather than using fixed RSI levels
5. **Leading Indicator**: Provides earlier signals compared to traditional RSI crossovers
## Signal Generation Logic
### 🟢 Buy Signal Process (3-Stage System):
#### Stage 1: Trigger Activation
- **RSI ROC** > threshold (default 7%) - RSI accelerating upward
- **Price ROC** > 0 - Price moving higher
- Records the **trigger high** (highest point during trigger)
#### Stage 2: Invalidation Check
- Signal invalidated if **RSI ROC** drops below negative threshold
- Prevents false signals during momentum reversals
#### Stage 3: Confirmation
- **Price breaks above trigger high** - Price action confirmation
- **Current candle is green** (close > open) - Bullish price action
- **State alternation** - Ensures no consecutive duplicate signals
### 🔴 Sell Signal Process (3-Stage System):
#### Stage 1: Trigger Activation
- **RSI ROC** < negative threshold (default -7%) - RSI accelerating downward
- **Price ROC** < 0 - Price moving lower
- Records the **trigger low** (lowest point during trigger)
#### Stage 2: Invalidation Check
- Signal invalidated if **RSI ROC** rises above positive threshold
- Prevents false signals during momentum reversals
#### Stage 3: Confirmation
- **Price breaks below trigger low** - Price action confirmation
- **Current candle is red** (close < open) - Bearish price action
- **State alternation** - Ensures no consecutive duplicate signals
## Key Features
### 🎯 **Smart Signal Management**
- **State Alternation**: Prevents signal clustering by alternating between buy/sell states
- **Trigger Invalidation**: Automatically cancels weak signals that lose momentum
- **Price Confirmation**: Requires actual price breakouts, not just momentum shifts
- **No Repainting**: Signals are confirmed and won't disappear or change
### ⚙️ **Customizable Parameters**
#### **RSI Length (Default: 14)**
- Standard RSI calculation period
- Shorter periods = more sensitive to price changes
- Longer periods = smoother, less noisy signals
#### **Lookback Period (Default: 1)**
- Period for ROC calculations
- 1 = compares to previous bar (most responsive)
- Higher values = smoother momentum detection
#### **RSI ROC Threshold (Default: 7%)**
- Minimum RSI velocity required for signal trigger
- Lower values = more signals, potentially more noise
- Higher values = fewer but higher-quality signals
### 📊 **Visual Signals**
- **Green Arrow Up**: Buy signal below price bar
- **Red Arrow Down**: Sell signal above price bar
- **Clean Chart**: No additional lines or oscillators cluttering the view
- **Size Options**: Customizable arrow sizes for visibility preferences
## Advantages Over Traditional Indicators
### vs. Standard RSI:
✅ **Earlier Signals**: Detects momentum changes before RSI reaches extremes
✅ **Dynamic Thresholds**: Adapts to market conditions vs. fixed 30/70 levels
✅ **Velocity Focus**: Measures momentum speed, not just position
✅ **Better Timing**: Combines momentum with price action confirmation
### vs. Moving Average Crossovers:
✅ **Leading vs. Lagging**: RSI ROC is forward-looking vs. backward-looking MAs
✅ **Volatility Adaptive**: Automatically adjusts to market volatility
✅ **Fewer Whipsaws**: Built-in invalidation logic reduces false signals
✅ **Momentum Focus**: Captures acceleration, not just direction changes
### vs. MACD:
✅ **Price-Normalized**: RSI ROC works consistently across different price ranges
✅ **Simpler Logic**: Clear trigger/confirmation process vs. complex crossovers
✅ **Built-in Filters**: Automatic signal quality control
✅ **State Management**: Prevents over-trading through alternation logic
## Trading Applications
### 📈 **Trend Following**
- Use in trending markets to catch momentum continuations
- Combine with trend filters for directional bias
- Excellent for breakout strategies
### 🔄 **Swing Trading**
- Ideal timeframes: 4H, Daily, Weekly
- Captures major momentum shifts
- Perfect for position entries/exits
### ⚡ **Scalping (Advanced Users)**
- Lower timeframes: 1m, 5m, 15m
- Reduce threshold for more frequent signals
- Combine with volume confirmation
### 🎯 **Momentum Strategies**
- Perfect for momentum-based trading systems
- Identifies acceleration phases in trends
- Complements breakout and continuation patterns
## Optimization Guidelines
### **Conservative Settings (Lower Risk)**
- RSI Length: 21
- ROC Threshold: 10%
- Lookback: 2
### **Standard Settings (Balanced)**
- RSI Length: 14 (default)
- ROC Threshold: 7% (default)
- Lookback: 1 (default)
### **Aggressive Settings (Higher Frequency)**
- RSI Length: 7
- ROC Threshold: 5%
- Lookback: 1
## Best Practices
### 🎯 **Entry Strategy**
1. Wait for signal arrow confirmation
2. Consider market context (trend, support/resistance)
3. Use proper position sizing based on volatility
4. Set stop-loss below/above trigger levels
### 🛡️ **Risk Management**
1. **Stop Loss**: Place beyond trigger high/low levels
2. **Position Sizing**: Use 1-2% risk per trade
3. **Market Context**: Avoid counter-trend signals in strong trends
4. **Time Filters**: Consider avoiding signals near major news events
### 📊 **Backtesting Recommendations**
1. Test on multiple timeframes and instruments
2. Analyze win rate vs. average win/loss ratio
3. Consider transaction costs in backtesting
4. Optimize threshold values for different market conditions
## Technical Specifications
- **Pine Script Version**: v6
- **Signal Type**: Non-repainting, confirmed signals
- **Calculation Basis**: RSI velocity with price action confirmation
- **Update Frequency**: Real-time on bar close
- **Memory Management**: Efficient state tracking with minimal resource usage
## Ideal For:
- **Momentum Traders**: Captures acceleration phases
- **Swing Traders**: Medium-term position entries/exits
- **Breakout Traders**: Confirms momentum behind breakouts
- **System Traders**: Mechanical signal generation with clear rules
This indicator represents a significant evolution in momentum analysis, combining the reliability of RSI with the precision of rate-of-change analysis and the confirmation of price action. It's designed for traders who want sophisticated momentum detection with built-in quality controls.

Volume Delta Oscillator with Divergence█ OVERVIEW
The Volume Delta Oscillator with Divergence is a technical indicator designed for the TradingView platform, helping traders identify potential trend reversal points and market momentum shifts through volume delta analysis and divergence detection. The indicator combines a smoothed volume delta oscillator with moving average-based signals, overbought/oversold levels, and divergence visualization, enhanced by configurable gradients and alerts for quick decision-making.
█ CONCEPT
The core idea of the indicator is to measure net buying or selling pressure through volume delta, smooth it for greater clarity, and detect divergences between price action and the oscillator. The indicator does not use external data, making it a compromise but practical tool for analyzing market dynamics based on available price and volume data. It provides insights into market dynamics, overbought/oversold conditions, and potential reversal points, with an attractive visual presentation.
█ WHY USE IT?
- Divergence detection: Identifies bullish and bearish divergences between price and the oscillator, signaling potential reversals.
- Volume delta analysis: Measures cumulative volume delta to assess buying/selling pressure, expressed as a percentage for cross-market comparability.
- Signal generation: Creates buy/sell signals based on overbought/oversold level crossovers, zero line crossovers, and moving average zero line crossovers.
- Visual clarity: Uses gradients, fills, and dynamic colors for intuitive chart analysis.
- Flexibility: Numerous settings allow adaptation to various markets (e.g., forex, crypto, stocks) and trading strategies.
█ HOW IT WORKS?
- Volume delta calculation: Computes net buying/selling pressure per candle as volume * (close - open) / (high - low), aggregated over a specified period (Cumulative Delta Length).
- Smoothing: Applies an EMA (Smoothing Length) to the cumulative delta percentage, creating a smoother oscillator (Delta Oscillator).
- Moving Average: Calculates an SMA (Moving Average Length) of the smoothed delta for trend confirmation (Moving Average (SMA)).
- Divergence detection: Identifies bullish and bearish divergences by comparing price and oscillator pivot highs/lows within a specified range (Pivot Length).
- Normalization: Delta is expressed as a percentage of total volume, ensuring consistency across instruments and timeframes.
- Signals: Generates signals for:
Crossing the oversold level upward (buy) or overbought level downward (sell).
Crossing the zero line by the oscillator or moving average (buy/sell).
Bullish/bearish divergences, marked with labels.
- Visualization: Draws the oscillator and moving average with dynamic colors, gradient fills, and transparent bands and labels, with configurable overbought/oversold levels.
- Alerts: Built-in alerts for divergence detection, overbought/oversold crossovers, and zero line crossovers (both oscillator and moving average).
█ SETTINGS AND CUSTOMIZATION
- Cumulative Delta Length: Period for aggregating volume delta (default: 14).
- Smoothing Length (EMA): EMA length for smoothing the delta oscillator (default: 2). Higher values smooth the signal but reduce the number of generated signals.
- Moving Average Length (SMA): SMA length for the moving average line (default: 40). Higher values allow SMA to be analyzed as a trend indicator, but require adjusting overbought/oversold levels for MA, as longer MA oscillates less.
- Pivot Length (Left/Right): Number of candles for detecting pivot highs/lows in divergence calculations (default: 2). Higher values can reduce noise but introduce a delay equal to the set value.
- Overbought/Oversold Levels: Thresholds for the oscillator (default: 18/-18) and for the moving average (default: 10/-10). For the moving average, no arrows appear; instead, the band changes color from gray to green (oversold) or red (overbought), which can strengthen entry signals for delta.
- Signal Type: Select signals to display: "Overbought/Oversold", "Zero Line", "MA Zero Line", "All", or "None" (default: Overbought/Oversold).
- Colors and gradients: Customize colors for bullish/bearish oscillator, moving average, zero line, overbought/oversold levels, and divergence labels.
- Transparency: Adjust gradient fill transparency (default: 70) and band/label transparency (default: 40) for consistent appearance.
- Visualizations: Enable/disable the moving average, gradients for zero/overbought/oversold levels, and gradient fills.
█ USAGE EXAMPLES
- Momentum analysis: Observe the delta oscillator above 0 for bullish momentum or below 0 for bearish momentum. The moving average (SMA), being smoothed, reacts more slowly and can confirm trend direction as a noise filter.
- Reversal signals: Look for buy triangles when the oscillator crosses the oversold level upward, especially when the moving average is below the MA oversold threshold. Similarly, look for sell triangles when crossing the overbought level downward, with the moving average above the MA overbought threshold. Divergence labels (bullish/bearish) indicate potential reversals.
- Divergence trading: Use bullish divergence labels (green) for potential buy opportunities and bearish labels (red) for sell opportunities, especially when confirmed by price action or other indicators.
- Customization: Adjust the cumulative delta length, smoothing, and moving average length to specific instruments and timeframes to minimize false signals.
█ NOTES FOR USERS
- Combine the indicator with other tools, such as Fibonacci levels, RSI, or pivot points, to increase accuracy.
- Test different settings for cumulative delta length, smoothing, and moving average length on your chosen instrument and timeframe to find optimal values.

Pasrsifal.RegressionTrendStateSummary
The Parsifal.Regression.Trend.State Indicator analyzes the leading coefficients of linear and quadratic regressions of price (against time). It also considers their first- and second-order changes. These features are aggregated into a Trend-State background, shown as a gradient color. In addition, the indicator generates fast and slow signals that can be used as potential entry- or exit triggers.
This tool is designed for advanced trend-following strategies, leveraging information from multiple trendline features.
Background
Trendlines provide insight into the state of a trend or the “trendiness” of a price process. While moving averages or pivot-based lines can serve as envelopes and breakout levels, they are often too lagging for swing traders, who need tools that adapt more closely to price swings, ideally using trendlines, around which the price process swings continuously.
Regression lines address this by cutting directly through the data, making them a natural anchor for observing how price winds around a central trendline within a chosen lookback period.
Regression Trendlines
• Linear Regression:
o Minimizes distance to all closing values over the lookback period.
o The slope represents the short-term linear trend.
o The change of slope indicates trend acceleration or deceleration.
o Linear regression lags during phases of rapid market shifts.
• Quadratic Regression:
o Fits a second-degree polynomial to minimize deviation from closing prices.
o The convexity term (leading coefficient) reflects curvature:
Positive convexity → accelerating uptrend or fading downtrend.
Negative convexity → accelerating downtrend or fading uptrend.
o The change of convexity detects early shifts in momentum and often reacts faster than slope features.
Features Extracted
The indicator evaluates six features:
• Linear features: slope, first derivative of slope, second derivative of slope.
• Quadratic features: convexity term, first derivative of the convexity term, second derivative of the convexity term.
• Linear features: capture broad, background trend behavior.
• Quadratic features: detect deviations, accelerations, and smaller-scale dynamics.
Quadratic terms generally react first to market changes, while linear terms provide stability and context.
Dynamics of Market Moves as seen by linear and quadratic regressions
• At the start of a rapid move:
The change of convexity reacts first, capturing the shift in dynamics before other features. The convexity term then follows, while linear slope features lag further behind. Because convexity measures deviation from linearity, it reflects accelerating momentum more effectively than slope.
• At the end of a rapid move:
Again, the change of convexity responds first to fading momentum, signaling the transition from above-linear to below-linear dynamics. Even while a strong trend persists, the change of convexity may flip sign early, offering a warning of weakening strength. The convexity term itself adjusts more slowly but may still turn before the price process does. Linear features lag the most, typically only flipping after price has already reversed, thereby smoothing out the rapid, more sensitive reactions of quadratic terms.
________________________________________
Parsifal Regression.Trend.State Method
1. Feature Mapping:
Each feature is mapped to a range between -1 and 1, preserving zero-crossings (critical for sign interpretation).
2. Aggregation:
A heuristic linear combination*) produces a background information value, visualized as a gradient color scale:
o Deep green → strong positive trend.
o Deep red → strong negative trend.
o Yellow → neutral or transitional states.
3. Signals:
o Fast signal (oscillator): ranges from -1 to 1, reflecting short-term trend state.
o Slow signal (smoothed): moving average of the fast signal.
o Their interactions (crossovers, zero-crossings) provide actionable trading triggers.
How to Use
The Trend-State background gradient provides intuitive visual feedback on the aggregated regression features (slope, convexity, and their changes). Because these features reflect not only current trend strength but also their acceleration or deceleration, the color transitions help anticipate evolving market states:
• Solid Green: All features near their highs. Indicates a strong, accelerating uptrend. May also reflect explosive or hyperbolic upside moves (including gaps).
• Fading Solid Green: A recently strong uptrend is losing momentum. Price may shift into a slower uptrend, consolidation, or even a reversal.
• Fading Green → Yellow: Often appears as a dirty yellow or a rapidly mixing pattern of green and red. Signals that the uptrend is weakening toward neutrality or beginning to turn negative.
• Yellow → Deepening Red: Two possible scenarios:
o Coming from a strong uptrend → suggests a sharp fade, though the trend may still technically be up.
o Coming from a weaker uptrend or sideways market → suggests the start of an accelerating downtrend.
• Solid Red: All features near their lows. Indicates a strong, accelerating downtrend. May also reflect crash-type conditions or downside gaps.
• Fading Solid Red: A recently strong downtrend is losing strength. Market may move into a slower decline, consolidation, or early reversal upward.
• Fading Red → Yellow : The downtrend is weakening toward neutral, with potential for a bullish shift.
• Yellow → Increasing Green: Two possible scenarios:
o Coming from a strong downtrend, it reflects a sharp fade of bearish momentum, though the market may still technically be trending down.
o Coming from a weaker downtrend or sideways movement, it suggests the start of an accelerating uptrend.
Note: Market evolution does not always follow this neat “color cycle.” It may jump between states, skip stages, or reverse abruptly depending on market conditions. This makes the background coloring particularly valuable as a contextual map of current and evolving price dynamics.
Signal Crossovers:
Although the fast signal is very similar (but not identical) to the background coloring, it provides a numerical representation indicating a bullish interpretation for rising values and bearish for falling.
o High-confidence entries:
Fast signal rising from < -0.7 and crossing above the slow signal → potential long entry.
Fast signal falling from > +0.7 and crossing below the slow signal → potential short entry.
o Low-confidence entries:
Crossovers near zero may still provide a valid trigger but may be noisy and should be confirmed with other signals.
o Zero-crossings:
Indicate broader state changes, useful for conservative positioning or option strategies. For confirmation of a Fast signal 0-crossing, wait for the Slow signal to cross as well.
________________________________________
*) Note on Aggregation
While the indicator currently uses a heuristic linear combination of features, alternatives such as Principal Component Analysis (PCA) could provide a more formal aggregation. However, while in the absence of matrix algebra, the required eigenvalue decomposition can be approximated, its computational expense does not justify the marginal higher insight in this case. The current heuristic approach offers a practical balance of clarity, speed, and accuracy.

Adaptive Momentum Flow (AMF)Overview
The Adaptive Momentum Flow (AMF) indicator is a powerful, multi-faceted tool designed to provide a comprehensive and adaptive view of market momentum and trend strength. Unlike traditional oscillators with fixed settings, AMF dynamically adjusts its calculations based on market volatility , ensuring its signals remain relevant across varying market conditions. By combining advanced Double Exponential Moving Averages (DEMA) with a powerful volume analysis component and a customizable scoring system, AMF offers a unique perspective on price action and underlying buying/selling pressure.
Key Features & How It Works
1. Adaptive DEMA Trend Strength:
At its core, AMF utilizes three DEMA lines (Fast, Medium, Slow) to assess the current trend's alignment and strength.
The indicator dynamically adjusts the lengths of these DEMA lines based on real-time market volatility, measured by Average True Range (ATR). This means AMF becomes more responsive in volatile markets and smoother in calmer periods.
A "Volatility Sensitivity" input allows you to fine-tune how aggressively the indicator adapts to these changes.
2. Volume Analysis (Buying/Selling Pressure):
AMF incorporates a dedicated volume analysis module to gauge whether volume is predominantly supporting upward or downward price movements. This helps identify periods of significant buying or selling pressure.
This volume analysis component is smoothed with an adjustable Moving Average (SMA, EMA, WMA, or DEMA) and contributes to the overall momentum score, adding a crucial layer of volume-driven confirmation to the analysis.
3. Comprehensive Scoring System:
The indicator generates a normalized "Oscillator Score" that ranges from -100 to 100. This score is a weighted sum of:
Price's relationship to the Fast DEMA.
The Fast DEMA's relationship to the Medium DEMA.
The Medium DEMA's relationship to the Slow DEMA.
The smoothed value from the volume analysis.
Each component's influence on the final score can be individually adjusted via input weights, allowing for deep customization.
Signal Line & Crossovers:
A smoothed "Signal Line" provides additional confirmation for momentum shifts. Crossovers between the main AMF line and its Signal Line can indicate potential changes in market direction.
Overbought/Oversold Levels:
Adjustable Overbought (default 70) and Oversold (default -70) levels visually highlight extreme momentum conditions.
These zones are enhanced with a color fill effect (bright red for overbought, bright cyan for oversold), making it easy to spot when the market is entering potentially exhausted states.
Crucially, these extreme zones can often be further validated by combining them with volatility bands (like Bollinger Bands or Keltner Channels as shown in the chart above) or other confluence indicators, offering stronger signals for potential reversals or exhaustion.
Benefits for Traders
Reduced Lag: DEMA's inherent design helps minimize lag compared to traditional moving averages, providing more timely signals.
Adaptive Intelligence: Automatically adjusts to market volatility, ensuring the indicator's sensitivity is appropriate for current conditions.
Holistic Momentum View: Combines price-based trend alignment with volume-based pressure for a more robust assessment of market flow.
Clear Visual Cues: Intuitive plots, signal line, and vibrant overbought/oversold zone fills make interpretation straightforward.
Customizable: Extensive input options allow traders to tailor the indicator to their specific trading style, asset, and timeframe.
How to Use
Trend Confirmation: Look for the AMF line and its Signal Line to align with the price trend.
Momentum Shifts: Crossovers between the AMF line and its Signal Line can indicate shifts in momentum.
Extreme Conditions: Pay attention when the AMF line enters the neon-highlighted overbought or oversold zones, signaling potential reversals or pauses in the current momentum. Always consider confirming these signals with other analysis tools, such as price action, chart patterns, support/resistance levels, or volatility indicators.
Customization: Experiment with the "Volatility Sensitivity," DEMA multipliers, and scoring weights to find the optimal settings for your trading strategy.

EMA RSI Trend Reversal Ver.1Overview:
The EMA RSI Trend Reversal indicator combines the power of two well-known technical indicators—Exponential Moving Averages (EMAs) and the Relative Strength Index (RSI)—to identify potential trend reversal points in the market. The strategy looks for key crossovers between the fast and slow EMAs, and uses the RSI to confirm the strength of the trend. This combination helps to avoid false signals during sideways market conditions.
How It Works:
Buy Signal:
The Fast EMA (9) crosses above the Slow EMA (21), indicating a potential shift from a downtrend to an uptrend.
The RSI is above 50, confirming strong bullish momentum.
Visual Signal: A green arrow below the price bar and a Buy label are plotted on the chart.
Sell Signal:
The Fast EMA (9) crosses below the Slow EMA (21), indicating a potential shift from an uptrend to a downtrend.
The RSI is below 50, confirming weak or bearish momentum.
Visual Signal: A red arrow above the price bar and a Sell label are plotted on the chart.
Key Features:
EMA Crossovers: The Fast EMA crossing above the Slow EMA signals potential buying opportunities, while the Fast EMA crossing below the Slow EMA signals potential selling opportunities.
RSI Confirmation: The RSI helps confirm trend strength—values above 50 indicate bullish momentum, while values below 50 indicate bearish momentum.
Visual Cues: The strategy uses green arrows and red arrows along with Buy and Sell labels for clear visual signals of when to enter or exit trades.
Signal Interpretation:
Green Arrow / Buy Label: The Fast EMA (9) has crossed above the Slow EMA (21), and the RSI is above 50. This is a signal to buy or enter a long position.
Red Arrow / Sell Label: The Fast EMA (9) has crossed below the Slow EMA (21), and the RSI is below 50. This is a signal to sell or exit the long position.
Strategy Settings:
Fast EMA Length: Set to 9 (this determines how sensitive the fast EMA is to recent price movements).
Slow EMA Length: Set to 21 (this smooths out price movements to identify the broader trend).
RSI Length: Set to 14 (default setting to track momentum strength).
RSI Level: Set to 50 (used to confirm the strength of the trend—above 50 for buy signals, below 50 for sell signals).
Risk Management (Optional):
Use take profit and stop loss based on your preferred risk-to-reward ratio. For example, you can set a 2:1 risk-to-reward ratio (2x take profit for every 1x stop loss).
Backtesting and Optimization:
Backtest the strategy on TradingView by opening the Strategy Tester tab. This will allow you to see how the strategy would have performed on historical data.
Optimization: Adjust the EMA lengths, RSI period, and risk-to-reward settings based on your asset and time frame.
Limitations:
False Signals in Sideways Markets: Like any trend-following strategy, this indicator may generate false signals during periods of low volatility or sideways movement.
Not Suitable for All Market Conditions: This indicator performs best in trending markets. It may underperform in choppy or range-bound markets.
Strategy Example:
XRP/USD Example:
If you're trading XRP/USD and the Fast EMA (9) crosses above the Slow EMA (21), while the RSI is above 50, the indicator will signal a Buy.
Conversely, if the Fast EMA (9) crosses below the Slow EMA (21), and the RSI is below 50, the indicator will signal a Sell.
Bitcoin (BTC/USD):
On the BTC/USD chart, when the indicator shows a green arrow and a Buy label, it’s signaling a potential long entry. Similarly, a red arrow and Sell label indicate a short entry or exit from a previous long position.
Summary:
The EMA RSI Trend Reversal Indicator helps traders identify potential trend reversals with clear buy and sell signals based on the EMA crossovers and RSI confirmations. By using green arrows and red arrows, along with Buy and Sell labels, this strategy offers easy-to-understand visual signals for entering and exiting trades. Combine this with effective risk management and backtesting to optimize your trading performance.

Dynamic Sentiment RSI [UAlgo]The Dynamic Sentiment RSI is a technical analysis tool that combines the classic RSI (Relative Strength Index) concept with dynamic sentiment analysis, offering traders enhanced insights into market conditions. Unlike the traditional RSI, this indicator integrates volume weighting, sentiment factors, and smoothing features to provide a more nuanced view of momentum and potential market reversals. It is designed to assist traders in detecting overbought/oversold conditions, momentum shifts, and to generate potential buy or sell signals using crossover and crossunder techniques. By dynamically adjusting based on sentiment and volume factors, this RSI offers better adaptability to varying market conditions, making it suitable for different trading styles and timeframes.
This tool is particularly helpful for traders who wish to explore not only price movement but also the underlying market sentiment, offering a more comprehensive approach to momentum analysis. The sentiment factor amplifies the RSI's sensitivity to price shifts, making it easier to detect early signals of market reversals or the continuation of a trend.
🔶 Key Features
Dynamic Sentiment Calculation: The indicator incorporates a "Sentiment Factor" that adjusts the RSI length dynamically based on a multiplier, helping traders better understand market sentiment at different time intervals.
Volume Weighting: When enabled, the RSI calculations are weighted by volume, allowing traders to give more importance to price movements with higher trading volume, which may provide more accurate signals.
Smoothing Feature: A customizable smoothing period is applied to the RSI to help filter out noise and make the signal smoother. This feature is particularly useful for traders who prefer to focus on long-term trends while minimizing false signals.
Step Size Customization: A "Step Size" input allows users to round the sentiment RSI to predefined intervals, making the results easier to interpret and act upon. This feature allows you to focus on significant sentiment changes and ignore minor fluctuations.
Crossover/Crossunder Alerts: The indicator includes crossover and crossunder signals on the zero-line, helping traders identify potential buy and sell opportunities as the smoothed RSI crosses these levels.
The indicator offers a clear visual display with multiple color-coded lines and areas:
Sentiment RSI: Plotted as an area chart, color-coded based on sentiment strength.
Raw RSI: A purple line representing the raw adjusted RSI.
Smoothed RSI: A dynamic line, color-coded aqua or orange based on its position relative to the zero line.
Buy/Sell Signals: Triangle shapes are plotted at crossovers and crossunders, providing clear entry and exit points.
🔶 Interpreting the Indicator
Sentiment RSI
-This line represents the sentiment-adjusted RSI, where the higher the value, the stronger the bullish sentiment, and the lower the value, the stronger the bearish sentiment. It is rounded to step intervals, making it easier to detect significant shifts in sentiment.
- A positive sentiment RSI (above 0) suggests bullish market conditions, while a negative sentiment RSI (below 0) suggests bearish conditions.
Smoothed RSI
The smoothed RSI helps reduce noise and shows the trend more clearly.
Crossovers of the zero line are significant:
- Crossover above zero: Indicates that bullish momentum is building, potentially signaling a buying opportunity.
- Crossunder below zero: Signals a shift towards bearish momentum, potentially indicating a sell signal.
Traders should look for these crossovers in conjunction with other signals for more accurate entry/exit points.
Raw RSI (Adjusted)
The raw adjusted RSI offers a less smoothed, more responsive version of the RSI. While it may be noisier, it provides early signals of market reversals and trends.
Crossover/Crossunder Signals
- When the smoothed RSI crosses above the zero line, a "Signal Up" triangle appears, indicating a potential buying opportunity.
- When the smoothed RSI crosses below the zero line, a "Signal Down" triangle appears, signaling a potential sell opportunity.
These signals help traders time their entries and exits by identifying momentum shifts.
Volume Weighting (Optional)
- If volume weighting is enabled, the RSI will give more weight to periods of higher trading volume, making the signals more reliable when the market is highly active.
Strong Up/Down Levels (40/-40)
- These dotted lines represent extreme sentiment levels. When the sentiment RSI reaches 40 or -40, the market may be nearing an overbought or oversold condition, respectively. This could be a signal for traders to prepare for potential reversals or shifts in momentum.
By combining the various components of this indicator, traders can gain a comprehensive view of market sentiment and price action, helping them make more informed trading decisions. The combination of sentiment factors, volume weighting, and smoothing makes this indicator highly flexible and suitable for a variety of trading strategies.
🔶 Disclaimer
Use with Caution: This indicator is provided for educational and informational purposes only and should not be considered as financial advice. Users should exercise caution and perform their own analysis before making trading decisions based on the indicator's signals.
Not Financial Advice: The information provided by this indicator does not constitute financial advice, and the creator (UAlgo) shall not be held responsible for any trading losses incurred as a result of using this indicator.
Backtesting Recommended: Traders are encouraged to backtest the indicator thoroughly on historical data before using it in live trading to assess its performance and suitability for their trading strategies.
Risk Management: Trading involves inherent risks, and users should implement proper risk management strategies, including but not limited to stop-loss orders and position sizing, to mitigate potential losses.
No Guarantees: The accuracy and reliability of the indicator's signals cannot be guaranteed, as they are based on historical price data and past performance may not be indicative of future results.

The Flash-Strategy with Minervini Stage Analysis QualifierThe Flash-Strategy (Momentum-RSI, EMA-crossover, ATR) with Minervini Stage Analysis Qualifier
Introduction
Welcome to a comprehensive guide on a cutting-edge trading strategy I've developed, designed for the modern trader seeking an edge in today's dynamic markets. This strategy, which I've honed through my years of experience in the trading arena, stands out for its unique blend of technical analysis and market intuition, tailored specifically for use on the TradingView platform.
As a trader with a deep passion for the financial markets, my journey began several years ago, driven by a relentless pursuit of a trading methodology that is both effective and adaptable. My background in trading spans various market conditions and asset classes, providing me with a rich tapestry of experiences from which to draw. This strategy is the culmination of that journey, embodying the lessons learned and insights gained along the way.
The cornerstone of this strategy lies in its ability to generate precise long signals in a Stage 2 uptrend and equally accurate short signals in a Stage 4 downtrend. This approach is rooted in the principles of trend following and momentum trading, harnessing the power of key indicators such as the Momentum-RSI, EMA Crossover, and Average True Range (ATR). What sets this strategy apart is its meticulous design, which allows it to adapt to the ever-changing market conditions, providing traders with a robust tool for navigating both bullish and bearish scenarios.
This strategy was born out of a desire to create a trading system that is not only highly effective in identifying potential trade setups but also straightforward enough to be implemented by traders of varying skill levels. It's a reflection of my belief that successful trading hinges on clarity, precision, and disciplined execution. Whether you are a seasoned trader or just beginning your journey, this guide aims to provide you with a comprehensive understanding of how to harness the full potential of this strategy in your trading endeavors.
In the following sections, we will delve deeper into the mechanics of the strategy, its implementation, and how to make the most out of its features. Join me as we explore the nuances of a strategy that is designed to elevate your trading to the next level.
Stage-Specific Signal Generation
A distinctive feature of this trading strategy is its focus on generating long signals exclusively during Stage 2 uptrends and short signals during Stage 4 downtrends. This approach is based on the widely recognized market cycle theory, which divides the market into four stages: Stage 1 (accumulation), Stage 2 (uptrend), Stage 3 (distribution), and Stage 4 (downtrend). By aligning the signal generation with these specific stages, the strategy aims to capitalize on the most dynamic and clear-cut market movements, thereby enhancing the potential for profitable trades.
1. Long Signals in Stage 2 Uptrends
• Characteristics of Stage 2: Stage 2 is characterized by a strong uptrend, where prices are consistently rising. This stage typically follows a period of accumulation (Stage 1) and is marked by increased investor interest and bullish sentiment in the market.
• Criteria for Long Signal Generation: Long signals are generated during this stage when the technical indicators align with the characteristics of a Stage 2 uptrend.
• Rationale for Stage-Specific Signals: By focusing on Stage 2 for long trades, the strategy seeks to enter positions during the phase of strong upward momentum, thus riding the wave of rising prices and investor optimism. This stage-specific approach minimizes exposure to less predictable market phases, like the consolidation in Stage 1 or the indecision in Stage 3.
2. Short Signals in Stage 4 Downtrends
• Characteristics of Stage 4: Stage 4 is identified by a pronounced downtrend, with declining prices indicating prevailing bearish sentiment. This stage typically follows the distribution phase (Stage 3) and is characterized by increasing selling pressure.
• Criteria for Short Signal Generation: Short signals are generated in this stage when the indicators reflect a strong bearish trend.
• Rationale for Stage-Specific Signals: Targeting Stage 4 for shorting capitalizes on the market's downward momentum. This tactic aligns with the natural market cycle, allowing traders to exploit the downward price movements effectively. By doing so, the strategy avoids the potential pitfalls of shorting during the early or late stages of the market cycle, where trends are less defined and more susceptible to reversals.
In conclusion, the strategy’s emphasis on stage-specific signal generation is a testament to its sophisticated understanding of market dynamics. By tailoring the long and short signals to Stages 2 and 4, respectively, it leverages the most compelling phases of the market cycle, offering traders a clear and structured approach to aligning their trades with dominant market trends.
Strategy Overview
At the heart of this trading strategy is a philosophy centered around capturing market momentum and trend efficiency. The core objective is to identify and capitalize on clear uptrends and downtrends, thereby allowing traders to position themselves in sync with the market's prevailing direction. This approach is grounded in the belief that aligning trades with these dominant market forces can lead to more consistent and profitable outcomes.
The strategy is built on three foundational components, each playing a critical role in the decision-making process:
1. Momentum-RSI (Relative Strength Index): The Momentum-RSI is a pivotal element of this strategy. It's an enhanced version of the traditional RSI, fine-tuned to better capture the strength and velocity of market trends. By measuring the speed and change of price movements, the Momentum-RSI provides invaluable insights into whether a market is potentially overbought or oversold, suggesting possible entry and exit points. This indicator is especially effective in filtering out noise and focusing on substantial market moves.
2. EMA (Exponential Moving Average) Crossover: The EMA Crossover is a crucial component for trend identification. This strategy employs two EMAs with different timeframes to determine the market trend. When the shorter-term EMA crosses above the longer-term EMA, it signals an emerging uptrend, suggesting a potential long entry. Conversely, a crossover below indicates a possible downtrend, hinting at a short entry opportunity. This simple yet powerful tool is key in confirming trend directions and timing market entries.
3. ATR (Average True Range): The ATR is instrumental in assessing market volatility. This indicator helps in understanding the average range of price movements over a given period, thus providing a sense of how much a market might move on a typical day. In this strategy, the ATR is used to adjust stop-loss levels and to gauge the potential risk and reward of trades. It allows for more informed decisions by aligning trade management techniques with the current volatility conditions.
The synergy of these three components – the Momentum-RSI, EMA Crossover, and ATR – creates a robust framework for this trading strategy. By combining momentum analysis, trend identification, and volatility assessment, the strategy offers a comprehensive approach to navigating the markets. Whether it's capturing a strong trend in its early stages or identifying a potential reversal, this strategy aims to provide traders with the tools and insights needed to make well-informed, strategically sound trading decisions.
Detailed Component Analysis
The efficacy of this trading strategy hinges on the synergistic functioning of its three key components: the Momentum-RSI, EMA Crossover, and Average True Range (ATR). Each component brings a unique perspective to the strategy, contributing to a well-rounded approach to market analysis.
1. Momentum-RSI (Relative Strength Index)
• Definition and Function: The Momentum-RSI is a modified version of the classic Relative Strength Index. While the traditional RSI measures the velocity and magnitude of directional price movements, the Momentum-RSI amplifies aspects that reflect trend strength and momentum.
• Significance in Identifying Trend Strength: This indicator excels in identifying the strength behind a market's move. A high Momentum-RSI value typically indicates strong bullish momentum, suggesting the potential continuation of an uptrend. Conversely, a low Momentum-RSI value signals strong bearish momentum, possibly indicative of an ongoing downtrend.
• Application in Strategy: In this strategy, the Momentum-RSI is used to gauge the underlying strength of market trends. It helps in filtering out minor fluctuations and focusing on significant movements, providing a clearer picture of the market's true momentum.
2. EMA (Exponential Moving Average) Crossover
• Definition and Function: The EMA Crossover component utilizes two exponential moving averages of different timeframes. Unlike simple moving averages, EMAs give more weight to recent prices, making them more responsive to new information.
• Contribution to Market Direction: The interaction between the short-term and long-term EMAs is key to determining market direction. A crossover of the shorter EMA above the longer EMA is an indicator of an emerging uptrend, while a crossover below signals a developing downtrend.
• Application in Strategy: The EMA Crossover serves as a trend confirmation tool. It provides a clear, visual representation of the market's direction, aiding in the decision-making process for entering long or short positions. This component ensures that trades are aligned with the prevailing market trend, a crucial factor for the success of the strategy.
3. ATR (Average True Range)
• Definition and Function: The ATR is an indicator that measures market volatility by calculating the average range between the high and low prices over a specified period.
• Role in Assessing Market Volatility: The ATR provides insights into the typical market movement within a given timeframe, offering a measure of the market's volatility. Higher ATR values indicate increased volatility, while lower values suggest a calmer market environment.
• Application in Strategy: Within this strategy, the ATR is instrumental in tailoring risk management techniques, particularly in setting stop-loss levels. By accounting for the market's volatility, the ATR ensures that stop-loss orders are placed at levels that are neither too tight (risking premature exits) nor too loose (exposing to excessive risk).
In summary, the combination of Momentum-RSI, EMA Crossover, and ATR in this trading strategy provides a comprehensive toolkit for market analysis. The Momentum-RSI identifies the strength of market trends, the EMA Crossover confirms the market direction, and the ATR guides in risk management by assessing volatility. Together, these components form the backbone of a strategy designed to navigate the complexities of the financial markets effectively.
1. Signal Generation Process
• Combining Indicators: The strategy operates by synthesizing signals from the Momentum-RSI, EMA Crossover, and ATR indicators. Each indicator serves a specific purpose: the Momentum-RSI gauges trend momentum, the EMA Crossover identifies the trend direction, and the ATR assesses the market’s volatility.
• Criteria for Signal Validation: For a signal to be considered valid, it must meet specific criteria set by each of the three indicators. This multi-layered approach ensures that signals are not only based on one aspect of market behavior but are a result of a comprehensive analysis.
2. Conditions for Long Positions
• Uptrend Confirmation: A long position signal is generated when the shorter-term EMA crosses above the longer-term EMA, indicating an uptrend.
• Momentum-RSI Alignment: Alongside the EMA crossover, the Momentum-RSI should indicate strong bullish momentum. This is typically represented by the Momentum-RSI being at a high level, confirming the strength of the uptrend.
• ATR Consideration: The ATR is used to fine-tune the entry point and set an appropriate stop-loss level. In a low volatility scenario, as indicated by the ATR, the stop-loss can be set tighter, closer to the entry point.
3. Conditions for Short Positions
• Downtrend Confirmation: Conversely, a short position signal is indicated when the shorter-term EMA crosses below the longer-term EMA, signaling a downtrend.
• Momentum-RSI Confirmation: The Momentum-RSI should reflect strong bearish momentum, usually seen when the Momentum-RSI is at a low level. This confirms the bearish strength of the market.
• ATR Application: The ATR again plays a role in determining the stop-loss level for the short position. Higher volatility, as indicated by a higher ATR, would warrant a wider stop-loss to accommodate larger market swings.
By adhering to these mechanics, the strategy aims to ensure that each trade is entered with a high probability of success, aligning with the market’s current momentum and trend. The integration of these indicators allows for a holistic market analysis, providing traders with clear and actionable signals for both entering and exiting trades.
Customizable Parameters in the Strategy
Flexibility and adaptability are key features of this trading strategy, achieved through a range of customizable parameters. These parameters allow traders to tailor the strategy to their individual trading style, risk tolerance, and specific market conditions. By adjusting these parameters, users can fine-tune the strategy to optimize its performance and align it with their unique trading objectives. Below are the primary parameters that can be customized within the strategy:
1. Momentum-RSI Settings
• Period: The lookback period for the Momentum-RSI can be adjusted. A shorter period makes the indicator more sensitive to recent price changes, while a longer period smoothens the RSI line, offering a broader view of the momentum.
• Overbought/Oversold Thresholds: Users can set their own overbought and oversold levels, which can help in identifying extreme market conditions more precisely according to their trading approach.
2. EMA Crossover Settings
• Timeframes for EMAs: The strategy uses two EMAs with different timeframes. Traders can modify these timeframes, choosing shorter periods for a more responsive approach or longer periods for a more conservative one.
• Source Data: The choice of price data (close, open, high, low) used in calculating the EMAs can be varied depending on the trader’s preference.
3. ATR Settings
• Lookback Period: Adjusting the lookback period for the ATR impacts how the indicator measures volatility. A longer period may provide a more stable but less responsive measure, while a shorter period offers quicker but potentially more erratic readings.
• Multiplier for Stop-Loss Calculation: This parameter allows traders to set how aggressively or conservatively they want their stop-loss to be in relation to the ATR value.
Here are the standard settings:

Weighted Oscillator Convergence DivergenceThe Weighted Oscillator Convergence Divergence (WOCD) aims to help traders identify potential trend reversals or momentum shifts in financial markets by calculating and visualizing the difference between a smoothed oscillator (WMA) value and its exponential moving average (EMA) and simple moving average (SMA) counterparts. This indicator is particularly useful for traders who want an alternative perspective on price momentum and divergence.
Key Features:
Inputs:
Length: The user can specify the number of bars to consider for calculations (default is 9).
Smoothing 1: Defines the smoothing factor for the first smoothed value (default is 5).
Smoothing 2: Specifies the smoothing factor for the second smoothed value (default is 7).
Ma Type: There are three types of moving averages you can choose (Wilder, non-lag, Weighted is by default).
Color Settings: Users can customize the indicator's colors for various elements, such as length, smoothing values, and different sections of the histogram.
Calculation:
WOCD calculates the raw oscillator value by subtracting the close price from a 3-period High, Low, Close (HLC3) moving average.
It then applies smoothing to this raw oscillator value using two different methods: exponential moving average (EMA) and simple moving average (SMA) with user-defined smoothing periods.
Histogram Plot:
The indicator plots a histogram based on the difference between the smoothed oscillator and the first smoothed value.
When the histogram is above zero and rising, it is colored according to the "Above Grow" color setting. When it's above zero and falling, it uses the "Fall" color for visualization.
Similarly, when the histogram is below zero and rising, it is colored according to the "Below Grow" color setting, and when it's below zero and falling, it uses the "Fall" color.
Oscillator and Smoothed Values:
The indicator also plots the smoothed oscillator, smoothed value 1 (EMA-based), and smoothed value 2 (SMA-based) on the chart.
Zero Line:
A horizontal line at zero is drawn on the chart for reference.
How to Use the WOCD Indicator:
Trend Identification: Observe the histogram's direction and color. A rising histogram above zero may indicate bullish momentum, while a falling histogram below zero could signal bearish momentum.
Divergence: Look for divergences between price action and the histogram. When the histogram and price move in opposite directions, it can be a potential reversal signal.
Crossovers: Pay attention to crossovers between the smoothed oscillator and its smoothed counterparts (EMA and SMA). These crossovers can indicate changes in trend strength or direction.
Zero Line: The zero line can act as a reference point. Positive histogram values suggest bullish sentiment, while negative values indicate bearish sentiment.
Comparison to MACD Indicator:
The WOCD indicator shares some similarities with the Moving Average Convergence Divergence (MACD) indicator but also has distinct differences:
Similarities:
Both WOCD and MACD are momentum oscillators designed to identify potential trend reversals and divergences.
They use moving averages (EMA in the case of MACD) to smooth the raw oscillator values.
Both indicators provide histogram representations of the difference between the oscillator and its smoothed counterpart.
Differences:
WOCD uses a 3-period High, Low, Close (HLC3) moving average to calculate the raw oscillator value, whereas MACD uses the difference between two exponential moving averages (usually 12-period and 26-period EMAs).
The smoothing in WOCD employs both EMA and SMA, while MACD exclusively uses EMA.
WOCD allows users to customize colors for various elements, enhancing visual clarity.

SuperSmoother MA OscillatorSuperSmoother MA Oscillator - Ehlers-Inspired Lag-Minimized Signal Framework
Overview
The SuperSmoother MA Oscillator is a crossover and momentum detection framework built on the pioneering work of John F. Ehlers, who introduced digital signal processing (DSP) concepts into technical analysis. Traditional moving averages such as SMA and EMA are prone to two persistent flaws: excessive lag, which delays recognition of trend shifts, and high-frequency noise, which produces unreliable whipsaw signals. Ehlers’ SuperSmoother filter was designed to specifically address these flaws by creating a low-pass filter with minimal lag and superior noise suppression, inspired by engineering methods used in communications and radar systems.
This oscillator extends Ehlers’ foundation by combining the SuperSmoother filter with multi-length moving average oscillation, ATR-based normalization, and dynamic color coding. The result is a tool that helps traders identify market momentum, detect reliable crossovers earlier than conventional methods, and contextualize volatility and phase shifts without being distracted by transient price noise.
Unlike conventional oscillators, which either oversimplify price structure or overload the chart with reactive signals, the SuperSmoother MA Oscillator is designed to balance responsiveness and stability. By preprocessing price data with the SuperSmoother filter, traders gain a signal framework that is clean, robust, and adaptable across assets and timeframes.
Theoretical Foundation
Traditional MA oscillators such as MACD or dual-EMA systems react to raw or lightly smoothed price inputs. While effective in some conditions, these signals are often distorted by high-frequency oscillations inherent in market data, leading to false crossovers and poor timing. The SuperSmoother approach modifies this dynamic: by attenuating unwanted frequencies, it preserves structural price movements while eliminating meaningless noise.
This is particularly useful for traders who need to distinguish between genuine market cycles and random short-term price flickers. In practical terms, the oscillator helps identify:
Early trend continuations (when fast averages break cleanly above/below slower averages).
Preemptive breakout setups (when compressed oscillator ranges expand).
Exhaustion phases (when oscillator swings flatten despite continued price movement).
Its multi-purpose design allows traders to apply it flexibly across scalping, day trading, swing setups, and longer-term trend positioning, without needing separate tools for each.
The oscillator’s visual system - fast/slow lines, dynamic coloration, and zero-line crossovers - is structured to provide trend clarity without hiding nuance. Strong green/red momentum confirms directional conviction, while neutral gray phases emphasize uncertainty or low conviction. This ensures traders can quickly gauge the market state without losing access to subtle structural signals.
How It Works
The SuperSmoother MA Oscillator builds signals through a layered process:
SuperSmoother Filtering (Ehlers’ Method)
At its core lies Ehlers’ two-pole recursive filter, mathematically engineered to suppress high-frequency components while introducing minimal lag. Compared to traditional EMA smoothing, the SuperSmoother achieves better spectral separation - it allows meaningful cyclical market structures to pass through, while eliminating erratic spikes and aliasing. This makes it a superior preprocessing stage for oscillator inputs.
Fast and Slow Line Construction
Within the oscillator framework, the filtered price series is used to build two internal moving averages: a fast line (short-term momentum) and a slow line (longer-term directional bias). These are not plotted directly on the chart - instead, their relationship is transformed into the oscillator values you see.
The interaction between these two internal averages - crossovers, separation, and compression - forms the backbone of trend detection:
Uptrend Signal : Fast MA rises above the slow MA with expanding distance, generating a positive oscillator swing.
Downtrend Signal : Fast MA falls below the slow MA with widening divergence, producing a negative oscillator swing.
Neutral/Transition : Lines compress, flattening the oscillator near zero and often preceding volatility expansion.
This design ensures traders receive the information content of dual-MA crossovers while keeping the chart visually clean and focused on the oscillator’s dynamics.
ATR-Based Normalization
Markets vary in volatility. To ensure the oscillator behaves consistently across assets, ATR (Average True Range) normalization scales outputs relative to prevailing volatility conditions. This prevents the oscillator from appearing overly sensitive in calm markets or too flat during high-volatility regimes.
Dynamic Color Coding
Color transitions reflect underlying market states:
Strong Green : Bullish alignment, momentum expanding.
Strong Red : Bearish alignment, momentum expanding.
These visual cues allow traders to quickly gauge trend direction and strength at a glance, with expanding colors indicating increasing conviction in the underlying momentum.
Interpretation
The oscillator offers a multi-dimensional view of price dynamics:
Trend Analysis : Fast/slow line alignment and zero-line interactions reveal trend direction and strength. Expansions indicate momentum building; contractions flag weakening conditions or potential reversals.
Momentum & Volatility : Rapid divergence between lines reflects increasing momentum. Compression highlights periods of reduced volatility and possible upcoming expansion.
Cycle Awareness : Because of Ehlers’ DSP foundation, the oscillator captures market cycles more cleanly than conventional MA systems, allowing traders to anticipate turning points before raw price action confirms them.
Divergence Detection : When oscillator momentum fades while price continues in the same direction, it signals exhaustion - a cue to tighten stops or anticipate reversals.
By focusing on filtered, volatility-adjusted signals, traders avoid overreacting to noise while gaining early access to structural changes in momentum.
Strategy Integration
The SuperSmoother MA Oscillator adapts across multiple trading approaches:
Trend Following
Enter when fast/slow alignment is strong and expanding:
A fast line crossing above the slow line with expanding green signals confirms bullish continuation.
Use ATR-normalized expansion to filter entries in line with prevailing volatility.
Breakout Trading
Periods of compression often precede breakouts:
A breakout occurs when fast lines diverge decisively from slow lines with renewed green/red strength.
Exhaustion and Reversals
Oscillator divergence signals weakening trends:
Flattening momentum while price continues trending may indicate overextension.
Traders can exit or hedge positions in anticipation of corrective phases.
Multi-Timeframe Confluence
Apply the oscillator on higher timeframes to confirm the directional bias.
Use lower timeframes for refined entries during compression → expansion transitions.
Technical Implementation Details
SuperSmoother Algorithm (Ehlers) : Recursive two-pole filter minimizes lag while removing high-frequency noise.
Oscillator Framework : Fast/slow MAs derived from filtered prices.
ATR Normalization : Ensures consistent amplitude across market regimes.
Dynamic Color Engine : Aligns visual cues with structural states (expansion and contraction).
Multi-Factor Analysis : Combines crossover logic, volatility context, and cycle detection for robust outputs.
This layered approach ensures the oscillator is highly responsive without overloading charts with noise.
Optimal Application Parameters
Asset-Specific Guidance:
Forex : Normalize with moderate ATR scaling; focus on slow-line confirmation.
Equities : Balance responsiveness with smoothing; useful for capturing sector rotations.
Cryptocurrency : Higher ATR multipliers recommended due to volatility.
Futures/Indices : Lower frequency settings highlight structural trends.
Timeframe Optimization:
Scalping (1-5min) : Higher sensitivity, prioritize fast-line signals.
Intraday (15m-1h) : Balance between fast/slow expansions.
Swing (4h-Daily) : Focus on slow-line momentum with fast-line timing.
Position (Daily-Weekly) : Slow lines dominate; fast lines highlight cycle shifts.
Performance Characteristics
High Effectiveness:
Trending environments with moderate-to-high volatility.
Assets with steady liquidity and clear cyclical structures.
Reduced Effectiveness:
Flat/choppy conditions with little directional bias.
Ultra-short timeframes (<1m), where noise dominates.
Integration Guidelines
Confluence : Combine with liquidity zones, order blocks, and volume-based indicators for confirmation.
Risk Management : Place stops beyond slow-line thresholds or ATR-defined zones.
Dynamic Trade Management : Use expansions/contractions to scale position sizes or tighten stops.
Multi-Timeframe Confirmation : Filter lower-timeframe entries with higher-timeframe momentum states.
Disclaimer
The SuperSmoother MA Oscillator is an advanced trend and momentum analysis tool, not a guaranteed profit system. Its effectiveness depends on proper parameter settings per asset and disciplined risk management. Traders should use it as part of a broader technical framework and not in isolation.

TRIPLE Moving AveragesThis Pine Script indicator plots three customizable moving averages (MAs) along with an optional composite MA (average of all three). It provides visual cues, alerts, and trend confirmation based on MA crossovers and price positioning relative to the MAs.
🔹 Key Features
1. Multiple Moving Average Types
Supports 7 different MA types for each line:
EMA (Exponential Moving Average)
SMA (Simple Moving Average)
SMMA / RMA (Smoothed / Regular Moving Average)
WMA (Weighted Moving Average)
VWMA (Volume Weighted Moving Average)
HMA (Hull Moving Average)
2. Three Independent MAs
MA1, MA2, MA3 can each be enabled/disabled
Custom lengths (default: 12, 21, 50)
Different price sources (close, open, high, low, etc.)
3. Composite Moving Average (Optional)
Calculates (MA1 + MA2 + MA3) / 3
Acts as a consensus trend filter
4. Visual & Alert Features
✅ Color-Coded Lines (Yellow = Price Above MA, Red = Price Below MA)
✅ Thick Line Width (3) for better visibility
✅ Background Highlights for crossovers/crossunders
✅ Alerts for All Crossover Combinations
🔹 How It Works
📈 MA Crossovers & Trend Signals
Bullish Signal: When a faster MA crosses above a slower MA
Bearish Signal: When a faster MA crosses below a slower MA
Trend Confirmation: All MAs aligned in the same direction (e.g., MA1 > MA2 > MA3 = Strong Uptrend)
🎨 Visual Indicators
Green Background → Bullish crossover detected
Red Background → Bearish crossover detected
Yellow Line → Price is above the MA (bullish)
Red Line → Price is below the MA (bearish)
🔔 Alert Conditions
Alerts are triggered for all possible MA crossover combinations, including:
MA1 crossing MA2
MA1 crossing MA3
MA2 crossing MA3
Any MA crossing the Composite MA

Mean Reversion Cloud (Ornstein-Uhlenbeck) // AlgoFyreThe Mean Reversion Cloud (Ornstein-Uhlenbeck) indicator detects mean-reversion opportunities by applying the Ornstein-Uhlenbeck process. It calculates a dynamic mean using an Exponential Weighted Moving Average, surrounded by volatility bands, signaling potential buy/sell points when prices deviate.
TABLE OF CONTENTS
🔶 ORIGINALITY
🔸Adaptive Mean Calculation
🔸Volatility-Based Cloud
🔸Speed of Reversion (θ)
🔶 FUNCTIONALITY
🔸Dynamic Mean and Volatility Bands
🞘 How it works
🞘 How to calculate
🞘 Code extract
🔸Visualization via Table and Plotshapes
🞘 Table Overview
🞘 Plotshapes Explanation
🞘 Code extract
🔶 INSTRUCTIONS
🔸Step-by-Step Guidelines
🞘 Setting Up the Indicator
🞘 Understanding What to Look For on the Chart
🞘 Possible Entry Signals
🞘 Possible Take Profit Strategies
🞘 Possible Stop-Loss Levels
🞘 Additional Tips
🔸Customize settings
🔶 CONCLUSION
▅▅▅▅▅▅▅▅▅▅▅▅▅▅▅▅▅▅▅▅▅▅▅▅▅▅▅▅▅▅▅▅▅▅▅▅▅▅▅▅▅▅▅▅▅▅
🔶 ORIGINALITY The Mean Reversion Cloud (Ornstein-Uhlenbeck) is a unique indicator that applies the Ornstein-Uhlenbeck stochastic process to identify mean-reverting behavior in asset prices. Unlike traditional moving average-based indicators, this model uses an Exponentially Weighted Moving Average (EWMA) to calculate the long-term mean, dynamically adjusting to recent price movements while still considering all historical data. It also incorporates volatility bands, providing a "cloud" that visually highlights overbought or oversold conditions. By calculating the speed of mean reversion (θ) through the autocorrelation of log returns, this indicator offers traders a more nuanced and mathematically robust tool for identifying mean-reversion opportunities. These innovations make it especially useful for markets that exhibit range-bound characteristics, offering timely buy and sell signals based on statistical deviations from the mean.
🔸Adaptive Mean Calculation Traditional MA indicators use fixed lengths, which can lead to lagging signals or over-sensitivity in volatile markets. The Mean Reversion Cloud uses an Exponentially Weighted Moving Average (EWMA), which adapts to price movements by dynamically adjusting its calculation, offering a more responsive mean.
🔸Volatility-Based Cloud Unlike simple moving averages that only plot a single line, the Mean Reversion Cloud surrounds the dynamic mean with volatility bands. These bands, based on standard deviations, provide traders with a visual cue of when prices are statistically likely to revert, highlighting potential reversal zones.
🔸Speed of Reversion (θ) The indicator goes beyond price averages by calculating the speed at which the price reverts to the mean (θ), using the autocorrelation of log returns. This gives traders an additional tool for estimating the likelihood and timing of mean reversion, making the signals more reliable in practice.
🔶 FUNCTIONALITY The Mean Reversion Cloud (Ornstein-Uhlenbeck) indicator is designed to detect potential mean-reversion opportunities in asset prices by applying the Ornstein-Uhlenbeck stochastic process. It calculates a dynamic mean through the Exponentially Weighted Moving Average (EWMA) and plots volatility bands based on the standard deviation of the asset's price over a specified period. These bands create a "cloud" that represents expected price fluctuations, helping traders to identify overbought or oversold conditions. By calculating the speed of reversion (θ) from the autocorrelation of log returns, the indicator offers a more refined way of assessing how quickly prices may revert to the mean. Additionally, the inclusion of volatility provides a comprehensive view of market conditions, allowing for more accurate buy and sell signals.
Let's dive into the details:
🔸Dynamic Mean and Volatility Bands The dynamic mean (μ) is calculated using the EWMA, giving more weight to recent prices but considering all historical data. This process closely resembles the Ornstein-Uhlenbeck (OU) process, which models the tendency of a stochastic variable (such as price) to revert to its mean over time. Volatility bands are plotted around the mean using standard deviation, forming the "cloud" that signals overbought or oversold conditions. The cloud adapts dynamically to price fluctuations and market volatility, making it a versatile tool for mean-reversion strategies. 🞘 How it works Step one: Calculate the dynamic mean (μ) The Ornstein-Uhlenbeck process describes how a variable, such as an asset's price, tends to revert to a long-term mean while subject to random fluctuations. In this indicator, the EWMA is used to compute the dynamic mean (μ), mimicking the mean-reverting behavior of the OU process. Use the EWMA formula to compute a weighted mean that adjusts to recent price movements. Assign exponentially decreasing weights to older data while giving more emphasis to current prices. Step two: Plot volatility bands Calculate the standard deviation of the price over a user-defined period to determine market volatility. Position the upper and lower bands around the mean by adding and subtracting a multiple of the standard deviation. 🞘 How to calculate Exponential Weighted Moving Average (EWMA)
The EWMA dynamically adjusts to recent price movements:
mu_t = lambda * mu_{t-1} + (1 - lambda) * P_t
Where mu_t is the mean at time t, lambda is the decay factor, and P_t is the price at time t. The higher the decay factor, the more weight is given to recent data.
Autocorrelation (ρ) and Standard Deviation (σ)
To measure mean reversion speed and volatility: rho = correlation(log(close), log(close ), length) Where rho is the autocorrelation of log returns over a specified period.
To calculate volatility:
sigma = stdev(close, length)
Where sigma is the standard deviation of the asset's closing price over a specified length.
Upper and Lower Bands
The upper and lower bands are calculated as follows:
upper_band = mu + (threshold * sigma)
lower_band = mu - (threshold * sigma)
Where threshold is a multiplier for the standard deviation, usually set to 2. These bands represent the range within which the price is expected to fluctuate, based on current volatility and the mean.
🞘 Code extract // Calculate Returns
returns = math.log(close / close )
// Calculate Long-Term Mean (μ) using EWMA over the entire dataset
var float ewma_mu = na // Initialize ewma_mu as 'na'
ewma_mu := na(ewma_mu ) ? close : decay_factor * ewma_mu + (1 - decay_factor) * close
mu = ewma_mu
// Calculate Autocorrelation at Lag 1
rho1 = ta.correlation(returns, returns , corr_length)
// Ensure rho1 is within valid range to avoid errors
rho1 := na(rho1) or rho1 <= 0 ? 0.0001 : rho1
// Calculate Speed of Mean Reversion (θ)
theta = -math.log(rho1)
// Calculate Volatility (σ)
sigma = ta.stdev(close, corr_length)
// Calculate Upper and Lower Bands
upper_band = mu + threshold * sigma
lower_band = mu - threshold * sigma
🔸Visualization via Table and Plotshapes
The table shows key statistics such as the current value of the dynamic mean (μ), the number of times the price has crossed the upper or lower bands, and the consecutive number of bars that the price has remained in an overbought or oversold state.
Plotshapes (diamonds) are used to signal buy and sell opportunities. A green diamond below the price suggests a buy signal when the price crosses below the lower band, and a red diamond above the price indicates a sell signal when the price crosses above the upper band.
The table and plotshapes provide a comprehensive visualization, combining both statistical and actionable information to aid decision-making.
🞘 Code extract // Reset consecutive_bars when price crosses the mean
var consecutive_bars = 0
if (close < mu and close >= mu) or (close > mu and close <= mu)
consecutive_bars := 0
else if math.abs(deviation) > 0
consecutive_bars := math.min(consecutive_bars + 1, dev_length)
transparency = math.max(0, math.min(100, 100 - (consecutive_bars * 100 / dev_length)))
🔶 INSTRUCTIONS
The Mean Reversion Cloud (Ornstein-Uhlenbeck) indicator can be set up by adding it to your TradingView chart and configuring parameters such as the decay factor, autocorrelation length, and volatility threshold to suit current market conditions. Look for price crossovers and deviations from the calculated mean for potential entry signals. Use the upper and lower bands as dynamic support/resistance levels for setting take profit and stop-loss orders. Combining this indicator with additional trend-following or momentum-based indicators can improve signal accuracy. Adjust settings for better mean-reversion detection and risk management.
🔸Step-by-Step Guidelines
🞘 Setting Up the Indicator
Adding the Indicator to the Chart:
Go to your TradingView chart.
Click on the "Indicators" button at the top.
Search for "Mean Reversion Cloud (Ornstein-Uhlenbeck)" in the indicators list.
Click on the indicator to add it to your chart.
Configuring the Indicator:
Open the indicator settings by clicking on the gear icon next to its name on the chart.
Decay Factor: Adjust the decay factor (λ) to control the responsiveness of the mean calculation. A higher value prioritizes recent data.
Autocorrelation Length: Set the autocorrelation length (θ) for calculating the speed of mean reversion. Longer lengths consider more historical data.
Threshold: Define the number of standard deviations for the upper and lower bands to determine how far price must deviate to trigger a signal.
Chart Setup:
Select the appropriate timeframe (e.g., 1-hour, daily) based on your trading strategy.
Consider using other indicators such as RSI or MACD to confirm buy and sell signals.
🞘 Understanding What to Look For on the Chart
Indicator Behavior:
Observe how the price interacts with the dynamic mean and volatility bands. The price staying within the bands suggests mean-reverting behavior, while crossing the bands signals potential entry points.
The indicator calculates overbought/oversold conditions based on deviation from the mean, highlighted by color-coded cloud areas on the chart.
Crossovers and Deviation:
Look for crossovers between the price and the mean (μ) or the bands. A bullish crossover occurs when the price crosses below the lower band, signaling a potential buying opportunity.
A bearish crossover occurs when the price crosses above the upper band, suggesting a potential sell signal.
Deviations from the mean indicate market extremes. A large deviation indicates that the price is far from the mean, suggesting a potential reversal.
Slope and Direction:
Pay attention to the slope of the mean (μ). A rising slope suggests bullish market conditions, while a declining slope signals a bearish market.
The steepness of the slope can indicate the strength of the mean-reversion trend.
🞘 Possible Entry Signals
Bullish Entry:
Crossover Entry: Enter a long position when the price crosses below the lower band with a positive deviation from the mean.
Confirmation Entry: Use additional indicators like RSI (above 50) or increasing volume to confirm the bullish signal.
Bearish Entry:
Crossover Entry: Enter a short position when the price crosses above the upper band with a negative deviation from the mean.
Confirmation Entry: Look for RSI (below 50) or decreasing volume to confirm the bearish signal.
Deviation Confirmation:
Enter trades when the deviation from the mean is significant, indicating that the price has strayed far from its expected value and is likely to revert.
🞘 Possible Take Profit Strategies
Static Take Profit Levels:
Set predefined take profit levels based on historical volatility, using the upper and lower bands as guides.
Place take profit orders near recent support/resistance levels, ensuring you're capitalizing on the mean-reversion behavior.
Trailing Stop Loss:
Use a trailing stop based on a percentage of the price deviation from the mean to lock in profits as the trend progresses.
Adjust the trailing stop dynamically along the calculated bands to protect profits as the price returns to the mean.
Deviation-Based Exits:
Exit when the deviation from the mean starts to decrease, signaling that the price is returning to its equilibrium.
🞘 Possible Stop-Loss Levels
Initial Stop Loss:
Place an initial stop loss outside the lower band (for long positions) or above the upper band (for short positions) to protect against excessive deviations.
Use a volatility-based buffer to avoid getting stopped out during normal price fluctuations.
Dynamic Stop Loss:
Move the stop loss closer to the mean as the price converges back towards equilibrium, reducing risk.
Adjust the stop loss dynamically along the bands to account for sudden market movements.
🞘 Additional Tips
Combine with Other Indicators:
Enhance your strategy by combining the Mean Reversion Cloud with momentum indicators like MACD, RSI, or Bollinger Bands to confirm market conditions.
Backtesting and Practice:
Backtest the indicator on historical data to understand how it performs in various market environments.
Practice using the indicator on a demo account before implementing it in live trading.
Market Awareness:
Keep an eye on market news and events that might cause extreme price movements. The indicator reacts to price data and might not account for news-driven events that can cause large deviations.
🔸Customize settings 🞘 Decay Factor (λ): Defines the weight assigned to recent price data in the calculation of the mean. A value closer to 1 places more emphasis on recent prices, while lower values create a smoother, more lagging mean.
🞘 Autocorrelation Length (θ): Sets the period for calculating the speed of mean reversion and volatility. Longer lengths capture more historical data, providing smoother calculations, while shorter lengths make the indicator more responsive.
🞘 Threshold (σ): Specifies the number of standard deviations used to create the upper and lower bands. Higher thresholds widen the bands, producing fewer signals, while lower thresholds tighten the bands for more frequent signals.
🞘 Max Gradient Length (γ): Determines the maximum number of consecutive bars for calculating the deviation gradient. This setting impacts the transparency of the plotted bands based on the length of deviation from the mean.
🔶 CONCLUSION
The Mean Reversion Cloud (Ornstein-Uhlenbeck) indicator offers a sophisticated approach to identifying mean-reversion opportunities by applying the Ornstein-Uhlenbeck stochastic process. This dynamic indicator calculates a responsive mean using an Exponentially Weighted Moving Average (EWMA) and plots volatility-based bands to highlight overbought and oversold conditions. By incorporating advanced statistical measures like autocorrelation and standard deviation, traders can better assess market extremes and potential reversals. The indicator’s ability to adapt to price behavior makes it a versatile tool for traders focused on both short-term price deviations and longer-term mean-reversion strategies. With its unique blend of statistical rigor and visual clarity, the Mean Reversion Cloud provides an invaluable tool for understanding and capitalizing on market inefficiencies.

Long/Short EMA Premium [NL]1. EMA Calculation :
- The script calculates three Exponential Moving Averages (EMAs): EMA 1, EMA 2, and EMA 50.
- The lengths of EMA 1 and EMA 2 are customizable by the user inputs `ema1Length` and `ema2Length`, respectively.
- EMA 50 is fixed with a length of 50.
2. EMA Crossover Detection :
- The script detects crossovers between EMA 1 and EMA 2 using the `ta.crossover()` and `ta.crossunder()` functions, storing the crossover events in the `cross` variable.
3. Crossover Symbol :
- A triangle-up shape is plotted below the bars when there is a crossover between EMA 1 and EMA 2. This symbol visually indicates the crossover points.
4. Trade Signals :
- Long and short signals are generated based on the crossover events and the relationship between the closing price and EMA 1.
- For a long signal, EMA 1 must cross above EMA 2, and both the current and previous closing prices must be above EMA 1.
- For a short signal, EMA 1 must cross below EMA 2, and both the current and previous closing prices must be below EMA 1.
5. Stop Conditions :
- Stop conditions are used to exit long or short trades.
- If in a long trade, the script checks if the low of the previous candle crossed below EMA 1 and the high of the current candle is below EMA 1. If true, it triggers the "Stop Long" condition.
- If in a short trade, the script checks if the high of the previous candle crossed above EMA 1 and the low of the current candle is above EMA 1. If true, it triggers the "Stop Short" condition.
6. Plotting :
- The script plots EMA 1, EMA 2, and EMA 50 on the chart to visualize their movements.
7. Alerts :
- The script generates alerts for EMA crossovers, long and short signals, as well as stop long and stop short conditions, allowing traders to receive notifications when these events occur.
Overall, the script provides a comprehensive EMA crossover strategy with customizable parameters and clear trade signals and exit conditions.

MACD Normalized [ChartPrime]Overview of MACD Normalized Indicator
The MACD Normalized indicator, serves as an asset for traders seeking to harness the power of the moving average convergence divergence (MACD) combined with the advantages of the stochastic oscillator. This novel indicator introduces a normalized MACD, offering a potentially enhanced flexibility and adaptability to numerous market conditions and trading techniques.
This indicator stands out by normalizing the MACD to its average high and average low, also factoring in the deviation of the high-low position from the mean. This approach incorporates the high and low in the calculations, providing the benefits of stochastic without its common drawbacks, such as clipping problems. As a result, the indicator becomes exceptionally versatile and suitable for various trading strategies, including both faster and slower settings.
The MACD Normalized Indicator boasts a variety of options and settings. The features include:
Enable Ribbon: Toggle the display of the ribbon accompanying the MACD Normalized, as desired.
Fast Length: Determine the movement speed of the fast line to receive advance notice of potential market opportunities.
Slow Length: Control the movement pace of the slow line for smoother signals and a comprehensive outlook on market trends.
Average Length: Specify the length used to calculate the high and low averages, providing greater control over the indicator's granularity.
Upper Deviation: Establish the extent to which the high and low values deviate from the mean, ensuring adaptability to diverse market situations.
Inner Band (Middle Deviation): Adjust the balance between the high and low deviations to create an inner band signal, giving traders a secondary level of market analysis and decision-making support.
Enable Candle Color: Enable the coloring of candles based on the MACD Normalized value for effortless visualization of trading potential.
Use Cases for the MACD Normalized Indicator
In addition to analyzing market trends and identifying potential trading opportunities, ChartPrime's MACD Normalized Indicator offers a range of applications for traders. These use cases encompass distinct trading scenarios and strategies:
Overbought and Oversold Regions
One of the key applications of the MACD Normalized Indicator is identifying overbought and oversold regions. Overbought refers to a situation where an asset's price has risen significantly and is expected to face a downturn, while oversold indicates a price drop that may subsequently lead to a reversal.
By adjusting the indicator's parameters, such as the upper and inner deviation levels, traders can set precise boundaries to determine overbought and oversold areas. When the MACD moves into the upper region, it may signal that the asset is overbought and due for a price correction. Conversely, if the MACD enters the lower region, it possibly indicates an oversold condition with the potential for a price rebound.
Signal Line Crossovers
The MACD Normalized Indicator displays two lines: the fast line and the slow line (inner band). A common trading strategy involves observing the intersection of these two lines, known as a crossover. When the fast line crosses above the slow line, it may signify a bullish trend or a potential buying opportunity. Conversely, a crossover with the fast line moving below the slow line typically indicates a bearish trend or a selling opportunity.
Divergence and Convergence
Divergence occurs when the price movement of an asset does not align with the corresponding MACD values. If the price establishes a new high while the MACD fails to do the same, a bearish divergence emerges, suggesting a potential downtrend. Similarly, a bullish divergence takes place when the price forms a new low but the MACD does not follow suit, hinting at an upcoming uptrend.
Convergence, on the other hand, is represented by the MACD lines moving closer together. This movement signifies a potential change in the trend, providing traders with a timely opportunity to enter or exit the market.
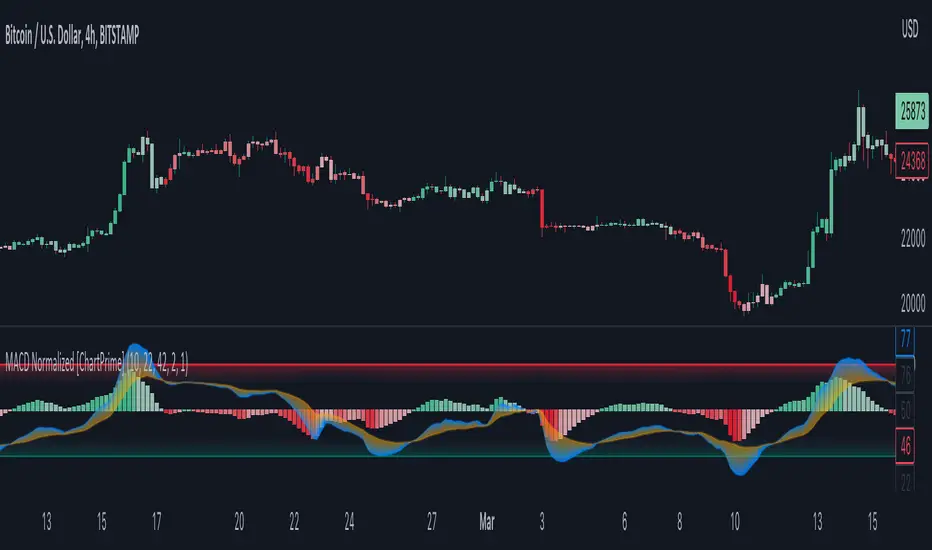
Multiple Colored Moving AveragesMULTIPLE COLORED MOVING AVERAGES - USER GUIDE
DISCLAIMER
----------
Both the code and this documentation were created heavily using artificial intelligence. I'm lazy...
This indicator was inspired by repo32's "Moving Average Colored EMA/SMA" indicator. *
What is this indicator?
-----------------------
This is a TradingView indicator that displays up to 4 different moving averages on your chart simultaneously. Each moving average can be customized with different calculation methods, colors, and filtering options.
Why would I use multiple moving averages?
-----------------------------------------
- See trend direction across different timeframes at once
- Identify support and resistance levels
- Spot crossover signals between fast and slow MAs
- Reduce false signals with filtering options
- Compare how different MA types react to price action
What moving average types are available?
----------------------------------------
11 different types:
- SMA: Simple average, equal weight to all periods
- EMA: Exponential, more weight to recent prices
- WMA: Weighted, linear weighting toward recent data
- RMA: Running average, smooth like EMA
- DEMA: Double exponential, reduced lag
- TEMA: Triple exponential, even less lag
- HMA: Hull, fast and smooth combination
- VWMA: Volume weighted, includes volume data
- LSMA: Least squares, based on linear regression
- TMA: Triangular, double-smoothed
- ZLEMA: Zero lag exponential, compensated for lag
How do I set up the indicator?
------------------------------
Each MA has these settings:
- Enable/Disable: Turn each MA on or off
- Type: Choose from the 11 calculation methods
- Length: Number of periods (21, 50, 100, 200 are common)
- Smoothing: 0-10 levels of extra smoothing
- Noise Filter: 0-5% to ignore small changes
- Colors: Bullish (rising) and bearish (falling) colors
- Line Width: 1-5 pixels thickness
What does the smoothing feature do?
-----------------------------------
Smoothing applies extra calculations to make the moving average line smoother. Higher levels reduce noise but make the MA respond slower to price changes. Use higher smoothing in choppy markets, lower smoothing in trending markets.
What is the noise filter?
--------------------------
The noise filter ignores small percentage changes in the moving average. For example, a 0.3% filter will ignore any MA movement smaller than 0.3%. This helps eliminate false signals from minor price fluctuations.
When should I use this indicator?
---------------------------------
- Trend analysis: See if market is going up, down, or sideways
- Entry timing: Look for price bounces off MA levels
- Exit signals: Watch for MA slope changes or crossovers
- Support/resistance: MAs often act as dynamic levels
- Multi-timeframe analysis: Use different lengths for different perspectives
What are some good settings to start with?
-------------------------------------------
Conservative approach:
- MA 1: EMA 21 (short-term trend)
- MA 2: SMA 50 (medium-term trend)
- MA 3: SMA 200 (long-term trend)
- Low noise filtering (0.1-0.3%)
Active trading:
- MA 1: HMA 9 (very responsive)
- MA 2: EMA 21 (short-term)
- MA 3: EMA 50 (medium-term)
- Minimal or no smoothing
How do I interpret the colors?
------------------------------
Each MA changes color based on its direction:
- Bullish color: MA is rising (upward trend)
- Bearish color: MA is falling (downward trend)
- Gray: MA is flat or unchanged
What should I look for in crossovers?
-------------------------------------
- Golden Cross: Fast MA crosses above slow MA (bullish signal)
- Death Cross: Fast MA crosses below slow MA (bearish signal)
- Multiple crossovers in same direction can confirm trend changes
- Wait for clear separation between MAs after crossover
How do I use MAs for support and resistance?
---------------------------------------------
- In uptrends: MAs often provide support when price pulls back
- In downtrends: MAs may act as resistance on rallies
- Multiple MAs create support/resistance zones
- Stronger levels where multiple MAs cluster together
Can I use this with other indicators?
-------------------------------------
Yes, it works well with:
- Volume indicators for confirmation
- RSI or MACD for timing entries
- Bollinger Bands for volatility context
- Price action patterns for setup confirmation
What if I get too many signals?
-------------------------------
- Increase smoothing levels
- Raise noise filter percentages
- Use longer MA periods
- Focus on major crossovers only
- Wait for multiple MA confirmation
What if signals are too slow?
-----------------------------
- Reduce smoothing to 0
- Lower noise filter values
- Switch to faster MA types (HMA, ZLEMA, DEMA)
- Use shorter periods
- Focus on the fastest MA only
Which MA types work best in different markets?
----------------------------------------------
Trending markets: EMA, DEMA, TEMA (responsive to trends)
Choppy markets: SMA, TMA, HMA with smoothing (less whipsaws)
High volatility: Use higher smoothing and noise filtering
Low volatility: Use minimal filtering for better responsiveness
Do I need all the advanced features?
------------------------------------
No. Start with basic settings:
- Choose MA type and length
- Set colors you prefer
- Leave smoothing at 0
- Leave noise filter at 0
Add complexity only if needed to improve signal quality.
How do I know if my settings are working?
-----------------------------------------
- Backtest on historical data
- Paper trade the signals first
- Adjust based on market conditions
- Keep a trading journal to track performance
- Be willing to modify settings as markets change
Can I save different configurations?
------------------------------------
Yes, save different indicator templates in TradingView for:
- Different trading styles (scalping, swing trading)
- Different market conditions (trending, ranging)
- Different instruments (stocks, forex, crypto)

BornInvestor MA CloudsBornInvestor MA Clouds
The BornInvestor MA Clouds script is a powerful, multi-layered moving average cloud system designed to help traders visualize market trends, momentum shifts, and crossover signals in a clear, intuitive way.
🔑 Features
Up to 5 customizable MA Clouds
Choose between SMA or EMA for each moving average.
Flexible input sources (Close, Open, High, Low, etc.).
Adjustable lengths for full control over short-, medium-, and long-term trend analysis.
Dynamic Cloud Coloring
Clouds automatically change color to reflect bullish or bearish momentum.
Customizable transparency and color schemes for each cloud.
Crossover Signals
Visual triangle markers appear when faster MAs cross above/below slower MAs.
Bullish crossovers are shown below bars, bearish crossovers above bars.
Alerts Ready 🚨
Built-in alert conditions for bullish and bearish crossovers (Cloud 1).
Alerts trigger once per bar for cleaner signals.
Clean Visuals
Option to show/hide individual MA lines.
Lightweight design optimized for clarity on any chart.
📊 How to Use
Clouds act as dynamic support/resistance zones. Price above the cloud signals bullish momentum, while price below the cloud signals bearish conditions.
Crossover signals help identify potential trend reversals or entry points.
Use multiple clouds (short, medium, long-term) for multi-timeframe confluence.
⚠️ Disclaimer
This script is for educational purposes only and not financial advice. Always combine with your own research and risk management before trading.
SyakDan FX (Clear Version)**SyakDan FX (Clear Version) - Indicator Description**
### Overview:
SyakDan FX (Clear Version) is a comprehensive TradingView indicator designed for account management, trend identification, and automated trading signals. This script utilizes multiple moving averages, ATR-based stop-loss calculations, and Fibonacci-based pivot points to assist traders in making informed trading decisions.
### Features:
1. **Account Management Calculation:**
- The indicator dynamically adapts to the current timeframe.
- Customizable moving average (MA) types, including EMA, SMA, WMA, and HMA.
- ATR-based trailing stop and volatility assessment.
2. **Moving Averages & Trend Identification:**
- Configurable EMA lengths for three different moving averages.
- Dynamic selection of MA types (SMA, EMA, WMA, HMA) for flexibility.
- Different EMA lengths for low and high timeframes.
- Automatic detection of EMA crossovers and trend changes.
3. **Entry, Stop-Loss, and Take-Profit Calculation:**
- Enables automatic calculation of entry, stop-loss, and take-profit levels.
- ATR-based stop-loss placement.
- Multi-level take-profit targets (TP1, TP2, TP3, and Max TP).
- Visual representation of SL/TP levels using dynamic lines and labels.
4. **Alerts & Notifications:**
- Alerts for EMA crossovers (Buy & Sell signals).
- Additional alerts when EMA 2 crosses EMA 3, indicating strong signals.
5. **Pivot Point Calculations:**
- Calculates daily and weekly pivot points using Fibonacci and traditional methods.
- Helps traders identify key support and resistance levels.
### How It Works:
- The indicator plots three customizable moving averages on the chart.
- It detects crossovers between these moving averages to identify potential buy and sell signals.
- ATR (Average True Range) is used to set dynamic stop-loss and take-profit levels.
- Traders can enable or disable automatic SL/TP plotting.
- Alerts notify users when key trade signals occur.
- Fibonacci and traditional pivot points provide additional confluence for trading decisions.
### Customization Options:
- **MA Type Selection:** Choose from SMA, EMA, WMA, or HMA for each moving average.
- **EMA Length Adjustments:** Modify the lengths for short-term and long-term trends.
- **SL/TP Settings:** Enable or disable SL/TP plotting and customize their multipliers.
- **Alert Preferences:** Enable or disable alerts for trend crossovers.
### Ideal Usage:
- Traders using trend-following strategies based on moving averages.
- Those who want automated SL/TP placement for risk management.
- Anyone looking to integrate pivot points into their trading decisions.
This indicator provides a clean, structured approach to trading with automated analysis, reducing the need for manual calculations while offering strong risk management tools.