Oscillator ExtremesThe Oscillator Extremes indicator plots the normalized positioning of the selected oscillator versus the Bollinger Bands' upper and lower boundaries. Currently, this indicator has four different oscillators to choose from; RSI, CMO, CCI, and ROC.
When the oscillator pushes towards one extreme, it will bring the value of the prevailing line closer to zero. If the bullish or bearish line crosses the zero line, the oscillator is past the extreme of the Bollinger Band.
Example: If the RSI crosses over the upper boundary of the Bollinger, the bullish(green) line will cross under the zero line.
Crossovers of the bullish and bearish lines can indicate a shift in momentum and are a signal. Where the line crossing under, towards zero, is the prevailing trend. The plotted lines will highlight green(bullish) or red(bearish) to show the prevailing trend. This is similar to a DI+- crossover that is commonly associated with the ADX.
We have included an optional normalized ADX to help validate signals. The ADX will change color based on the slope of the ADX. Purple indicates a positive slope and white for a negative slope.
Cerca negli script per "crossover债券是什么"

GDM Price Power & Under CurrentPrice Power & Under Current.
This is an updated version of the script I had shared earlier namely 'GDM Power Cross'
I have added under current and have removed upper an lower bands.
How to Trade:
Similar to various Moving Average cross over strategies; this indicator can be used to trade crossovers of Price Powers.
Lengths I have used as default are 7, 9 and 21. So when smaller Power Crosses above the Higher Powers; it is a Bullish Crossover and vice versa.
It is observed that most times we do get opportunity to enter in the price range of the candle where cross over has taken place.
Under Current: These are moving averages of above mention Price Powers. it is found that cross overs of Power lines work better when under currents are already in Bullish or Bearish mode. e.g. Bullish Cross Over of Power Lines will work better when Under Current lines are already Bullish or say Smaller Length Under Current is already above the Higher Length Under Current.
Indicator works better for bigger time frames... recommended time frame is 1 day.
Please feel free to Post your views.
Best Regards
Girish Mane
Re-Lions Trading Academy
+91 8080755813

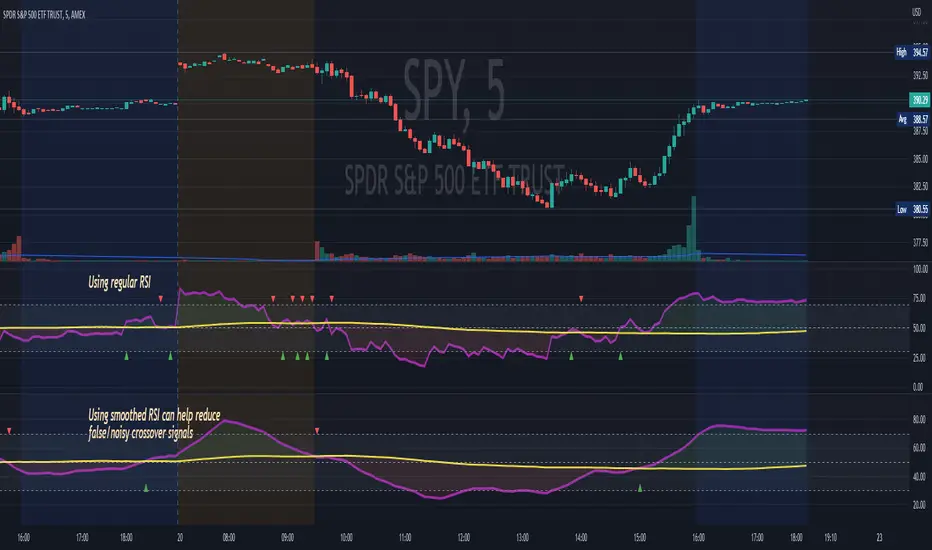
RSI MA CrossBuilding onto the standard RSI indicator, with the following modification and improvements:
- Added signals for RSI moving average crossovers, which usually indicator a bull or bear trend
- Added option to use smoothed RSI line
- Added alert for crossover signals
Enjoy~~~!
S2BU2 Volume Oscillator (Improved)Fair Use:
Please do not take my work and sell it under your own name. This was created to benefit everyone - not one person. Feel free however to use it as part of whatever work you wish to sell (of course i would applaud also giving ideas away for free - your choice though ;)
What it is:
The Basis for this Indicator was the original Volume Oscillator. I added Averages for Highs and Lows to make it easier to see relatively over- or undersupplied zones.
I also modified the oscillator to use a fast and a slow moving average à la MACD on itself to get a cleaner and earlier signal for when to expect a big move.
How it works:
A falling MA-line - especially if beneath the Signal-line indicates weakening Strength. Movements made during this time will barely move the needle.
A rising MA-line - especially if above the Signal-line, indicates increasing strength. Movements made during this time will be relatively considerable.
Crossovers above the average High/ below the average Low are especially relevant.
How to use:
Note this is only a recommendation and not advice. Feel free to experiment and adjust the indicator to fit your tradingstyle. This is only my personal setup. Feel free to share your findings.
Best used in combination with another Indicator that gives impulse direction, like for example my Stochastic Momentum Convergence Divergence (). You may also use any other indicator that works for you for this purpose - i am biased towards my own work though :D
What you want to see is a fresh direction-signal followed by a rising MA-line in the Volume Oscillator. For confirmation you can wait until the Volume Oscillator also has a crossover(up only, do not use the crossdown!) between MA- and Signal-line. Best results should be achieved if the MA-line was well below the averageLow-line. Trenddirection may change even while the Volume continuously goes up. Volume is direction agnostic. Always keep an eye on your direction indicator as changes can and will occur. These will be equally as violent and often longer lived than the previous direction you caught - you will lose a lot more than you gain if you do not keep track of that! This Indicator will help you to identify when not to waste your time on a trade, it will not be a magic pill that you can use to set and forget.

HiLo IndicatorNYSE:SPCE
This is an old and simple concept of mine that I am revisiting. It looks similar to the Vortex Indicator but the formulation is different. I was sick and tired of buying late at the top of the peaks, so I wanted to relate the current price to historic highs and lows (you can change how far you want to go back Time Length = tl). The functions are incredible simple:
lo = close -lowest(close,tl)
hi = highest(close,tl) -close
This generates a weaving pattern that shows bullish (lo>hi) and bearish (lo

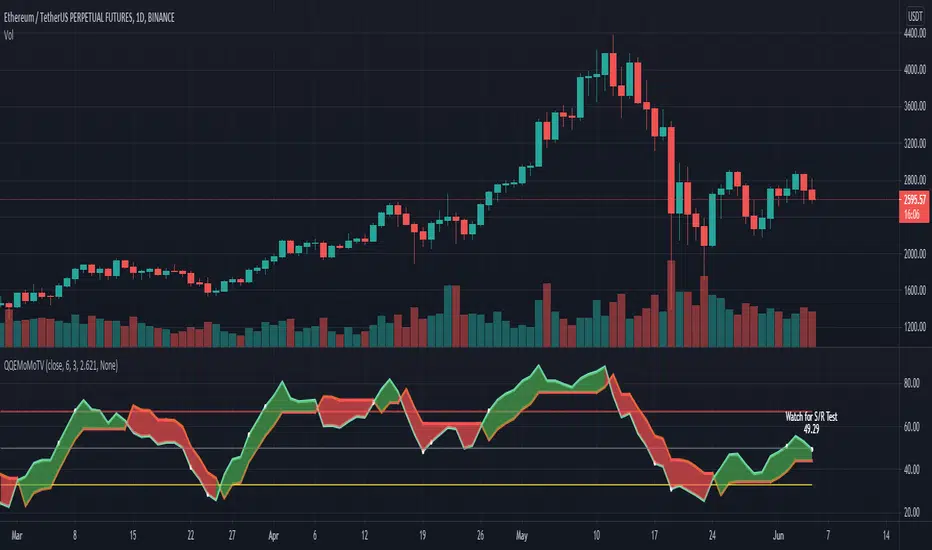
QQEMoMoTV█ OVERVIEW
This plots the QQE (Quantitive Qualitative Estimation)
with the addition of labels to show areas to watch out for and a colored cloud to show Green Upwards or Red Downwards Momentum
The QQE indicator is based on Wilder's RSI, which is based on a smoothed RSI comparing the change (delta Δ) between between bars
to compute the FastTL and SlowTL depending on the RSI Period, Slow Factor and QQE settings selected
As this works similarly to the RSI, it provides areas of overbought and oversold, and a cross at 50 for more bullish or more bearish
The FastTL and SlowTL crossovers works similarly to the crossover of a fast and slow moving average which can indicate bullish or bearish
When the SlowTL crosses above the FastTL a Green cloud indicating upwards momentum is drawn and vice versa when FastTL crosses above SlowTL
Bullish signals generated when Blue line crosses above Orange line, or Green MoMo cloud, Uptrend
Bearish signals generated when Orange line crosses above Blue line, or Red MoMo cloud, Downtrend
QQE Areas of interest:
Oversold: QQE < 33, Overbought: QQE > 67
Cross at 50: QQE crossing 50, this is an area that is between more bullish >50 and more bearish <50 zones
Note: as 50 is the switch between more bullish or more bearish zones , it is common to watch out for Support/Resistance Tests at this level
Tip: when QQE appears to be flat, this indicates a flat trend, this can commonly happen around the 50 zone when direction is relatively undecided, see the image below for an example
Very Overbought: QQE > 90, Careful! Watch out! QQE is showing very overbought and is generally a good area to take profit as others may sell soon too
QQE Fast settings: gives earlier signals, but also gives more shorter term signals
RSI_Period = 6, Slow_Factor = 3, QQE = 2.621
QQE Slow settings: gives more reliable signals, but sometimes a little late, best to use both fast and slow together for confirmation of the trend
RSI_Period = 20, Slow_Factor = 5, QQE = 4.236
You can add the QQEMoMoTV indicator to your chart twice and change one of them to the Fast settings and one of them to the Slow settings.
By comparing the QQEMoMoTV Fast and QQEMoMoTV Slow together you can get a better idea of the overall trend.
To best determine if this is a entry point or a trend reversal, it is recommended to use in conjunction with the MashumeHullTV indicator
█ FEATURES
Calculations
Calculates the change (delta Δ) between between bars based on Wilder's smoothed RSI to compute the FastTL (Orange) and SlowTL (Blue) lines
These are dependent on the QQE Fast settings or QQE Slow settings from the input RSI Period, Slow Factor and QQE selected
Labels are shown when QQE crosses areas of interest on the chart as Label text and shown with white dots on the QQEMoMoTV indicator
Inputs
You can use the script's inputs to configure:
• Calculation Source (default close)
• RSI Period (default 20)
• Slow Factor (default 5)
• QQE (default 4.236)
• Whether to show Green/Red MoMo Cloud
• Whether to show the QQE Label
• Style and Position of the QQELabel (default None)
None is selected as default to take up least space for optimal viewing when on Tradingview mobile, but you are free to change the style however you like
Alerts
Buy Signal alert based on rsi_ma crossing above FastAtrRsiTL, when Blue Line Cross above Orange Line, Green MoMo Cloud, Bullish
Sell Signal alert based on FastAtrRsiTL crossing above rsi_ma, when Orange Line Cross above Blue Line, Red MoMo Cloud, Bearish
█ CREDITS
Original Author: greyghost7
Feature upgrades and usage: Xiuying
Converted to Tradingview by: Machdragon
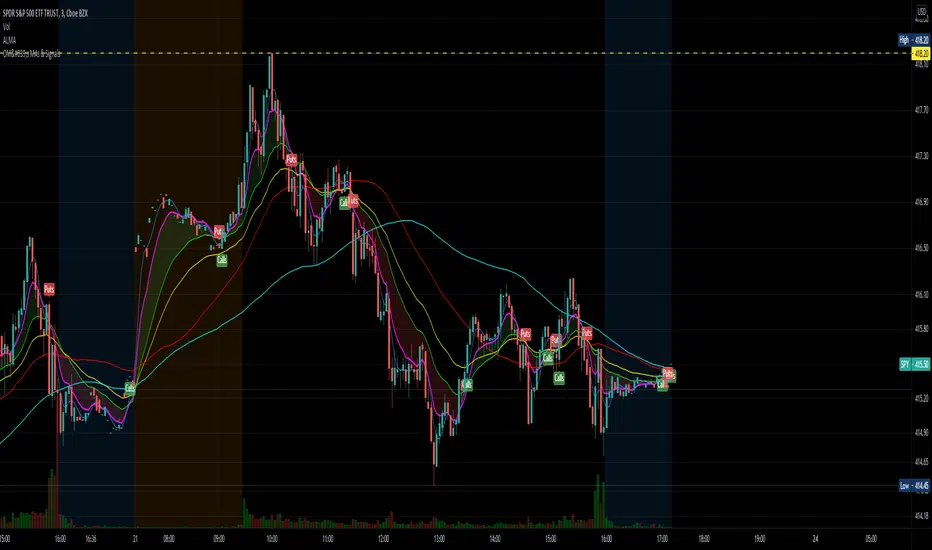
OptionsMillionaire SPY Moving Averages and Signalsby ColeJustice
OptionsMillionaire's SPY Options trading system is based mainly on these indicators:
- 8 EMA*
- 21 EMA*
- 100 SMA*
- 200 SMA*
- MACD
- RSI
- Squeeze Momentum
(*provided by this indicator)
and follows these rules:
|
| 1) I never fight the trend. If its green, i buy calls. If its red, i buy puts. I will only buy puts on a green day if there is a overall change in market trend. Inversely, calls on a red day
| 2) Price action is my #1 indicator. I wait for it to confirm my thesis before i enter a trade
| 3) I only trade SPY Options
| 4) My baseline is to choose a call/put that has a DTE (Date To Expiration) 6-7 days out, with a strike $2-$3 away. I adjust that to fit my current appetite for volatility. i virtually never play same day DTE's.
| 5) I set a 10% stop, but usually exit at 8% before my stop triggers depending on current situation
| 6) I utilize about 10-20% of my Portfolio for one trade. Sometimes more. Rarely less.
| 7) I never hold overnight in these market conditions.
| 8) I shoot for 10-20% for gains. Depending on market conditions.
| 9) Always look for confirmations in your indicators.
| 10) I never force a trade. No trade is a good trade too if the entry just isn't there.
| 11) Patience always pays off. A great set-up can form in minutes or seconds. I never regret being patient to enter. I nearly always regret rushing into a trade.
|
This indicator combines the moving averages into a single unit to simplify one part of the indicator usage rules: the 8 EMA / 21 EMA Cross. . The 8 crossing over the 21 is a Bullish signal, while the 8 crossing under the 21 is a Bearish signal. This indicator places flags at these crossover/under points, as well as shading the area between the 8 and 21 EMAs to help visualize the strength of the trend; green during a Bullish cross, and red during a Bearish cross.
A new addition to this strategy is the Hull Moving Average, or HMA. This script defaults to an HMA of 20 and shows alerts when candles close above or below the plot in the form of green and red candle backgrounds. This alert is best used in conjunction with the main crossovers and should be considered an addition level of confidence rather than providing trade entry/exits directly. This indicator is more flexible and you should feel free to adjust the period if you find a different value works better within your own personal trading style.
Each individual element of this indicator can be modified or toggled, providing maximum customization. While you should strive to become comfortable with the default settings, these options are provided in case you feel the need to adjust for your own style (or if testing on tickers other than SPY, for example).
Goodluch, and happy trading!
Breach v3 BetaThis is a script that allows you to toggle multiple indicators related to support and resistance, CCI, and Breaches (Crossovers based on William's Fractals).
How to use:
Custom Timeframe (Minutes) - To compare to current candles
Crossovers on custom - Crossovers and breaches on custom timeframe (Blue Triangle up)
Crossunders on custom - Crossunders and breaches on custom timeframe (Blue Triangle down)
Crossovers on current candles - Crossovers and breaches on current timeframe/Candlestick (Purple Triangle up)
Crossunder on current candles - Crossunders and breaches on current timeframe/Candlestick (Purple Triangle down)
CCI - CCI Trend indicator (red/green dots)
CCI - window - Input CCI window size in candlesticks (Integer)
Resistance on current candles - Resistance on current candles (Green Line)
Support on current candles - Support on current candles (Red Line)
Resistance - Custom - Resistance line based on Custom Timeframe (Blue Line)
Support - Custom - Support line based on Custom Timeframe (Purple Line)
Price on current support/resistance - Label displaying the price of current (candlestick) support/resistance
Price on custom support/resistance - Label displaying the price of custom (Custom Timeframe) support/resistance

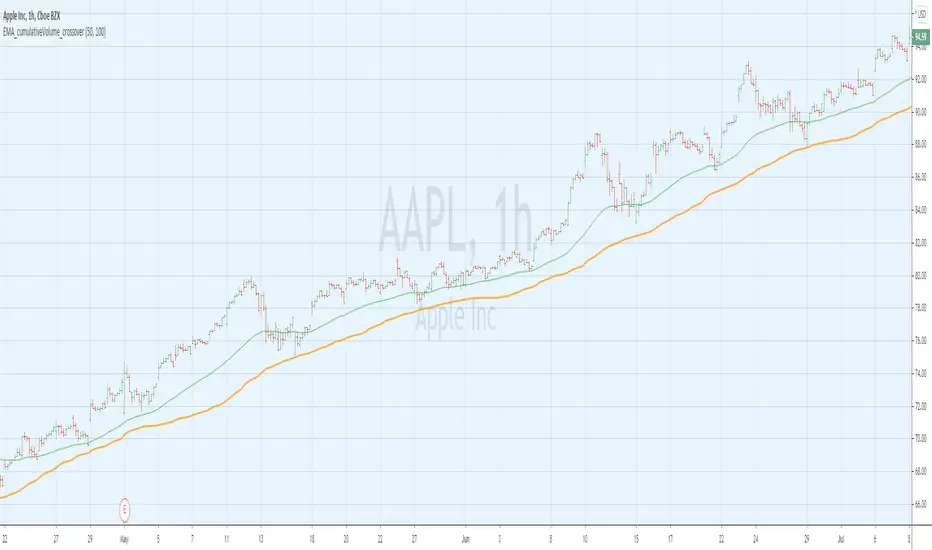
EMA_cumulativeVolume_crossover [indicator]while I was doing some research with exp MA crossovers and volume indicator , I have noticed that when ema 50 is above cumulative volume of 100 period , shows to capture nice profits in that trend. Shorting also (ema50 cross down volume of 100 period) also shows nice results.
BUY
When ema50 crossover cumulative volume of 100 period
Exit
When ema50 cross down cumulative volume of 100 period
Short Selling
Reverse above BUY conditions
Back ground color shows blue when ema50 is above cumulative volume of 100 period, shows purple when ema50 is below cumulative volume of 100 period
I will publish the strategy for back testing later today
Warning
For the use of educational purpose only
Traders Dynamic Index(RSI) w/ Bull&Bear Control ZonesMomentum (RSI) is one of the most commonly used indicators for trading, but the vast majority of traders who use it, simply apply it as an oscillator to measure overbought and oversold conditions. However, momentum is much more complex than that and using a basic RSI fails to highlight these complexities.
What this highlights are some of the areas/zones that many people may not even know about or are unaware what the RSI can actually reveal about a particular trend.
What this indicator is showing:
Fast moving RSI (Green) - 1 period
Slow moving RSI (Red) - 9 period
Bollinger Bands
Relative Strength: 1 - 100
Bearish Control Zone: 30(Below) - 45
Bullish Control Zone: 60 - 70 (Above)
How this identifies trends:
Bear Market(Bearish Control Zone):
-Support: 20(Below) - 30
-Resistance: 55 - 65
-Momentum will test resistance but will fail to hold support at 50
Bull Market(Bullish Control Zone):
-Support: 45 - 50
-Resistance: 80 - 90(Above)
-Momentum will test support but will not continue past the 45 support
How this identifies reversals:
If a market is bullish, but loses support at 45 and tests 30, it has begun reversal. If a market is bearish, but breaks 60 and tests 70, it has begun reversal.
-A bull market reversal is confirmed if it finds resistance at 60 after testing bearish support
-A bear market reversal is confirmed if it finds support at 50 after testing bullish resistance
Slow & Fast RSI w/ Boll Bands:
-The Slow and Fast RSI crossovers will act as Intermediate trends within the Macro trend - Fast crosses slow, bullish. Slow cross fast, bearish.
-Use in confluence with the Macro trend.
-While under Bearish Control, the Slow RSI will act as resistance for the Fast RSI.
-While under Bullish Control, the Slow RSI will act as support for the Fast RSI.
-The two will have an impulsive crossover when the Macro trend reverses.
-The Bollinger Bands will act as a volatility gauge for potential approaching tests of Support & Resistances. (Expansions & Contractions)
This is an analog of TDIGM (GoldMinds)
-Added Bullish/Bearish Control Zones.
-Changed Fast RSI to Green and Slow RSI to Red.

TRIX Ribbon [ChuckBanger]This is a TRIX indicator. You can read more about it here: www.investopedia.com
The trix indicator is usually only trix and a signal line. This indicator has 5 signal lines. The TRIX line has the color blue. The first has the color aqua and then lime, orange, red and the last is the maroon line. The first signal line is an EMA of the TRIX line, the second signal line a double smoothed EMA of the trix line and the third is triple smoothed TRIX line and so on.
Interpretation
TRIX is similar to MACD. As both is a momentum indicators that fluctuate above and below the zero line. Both have signal lines based on some sort of moving average (usually EMA). In this indicator the trader can set what moving average the trader prefer. The biggest difference between TRIX and MACD is that TRIX is the smoother of the two and are less jagged and tend to turn a bit later.
The most common signal is signal line crossover in the same manner as the MACD and its signal line. But this indicator has 5 signal lines. If this was a typical TRIX indicator it should only has the blue and aqua line (the line closest to the blue line). How you trade it is up to you. But for example you go long when the blue line crosses the aqua line. And because the all the is based on the TRIX line you can use the other crossovers as an confirmation signal.

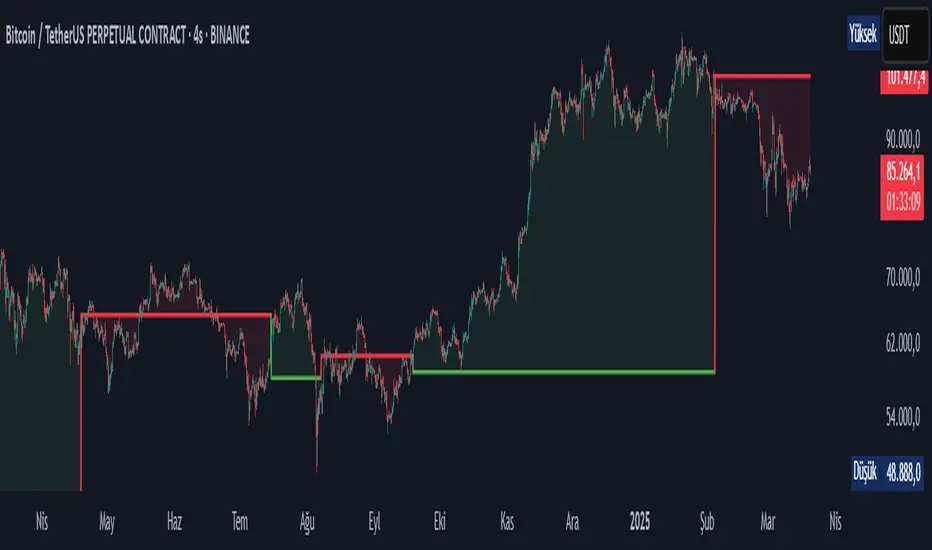
Whale Trading SystemThis script is an advanced version of the distributional blocks script.
In distributional buys and sells:
I used a high - low cloud filter, which makes it more prudent to sell the next sell higher for sells and to buy the next purchase lower for buys.
I also used the Stochastic Money Flow Index function because it also uses volume to separate regions.
The long period is 52 weeks, which is equal to one year,
The short period is one-fourth of its value, which is equal to a financial quarter.
Then the values calculated with these periods are calculated by stochastic - rsi logic within the function, giving us two averages and separating the regions according to crossovers and crossunders .
In buys and sales, the higher your next distributional position size makes your profit more .
In the old system, there was a confusion as it was not divided into zones.
Because we divide into zones here, zone changes are the last stop to free up existing positions, and you must reopen each time you change zones.
And I changed standard distribution days, depending on the price change and the histogram, as StochMFI also took into account the volume.
In this way, there is sustainability.
I am also sharing my educational idea that explains the logic of this system in more detail :
Now that we have been divided into regions, a maximum of 10 pieces will suffice us.
And the regional shifts will allow us to sell and buy all of our position size, and now we will feel much more comfortable.
The most timeframe I find most accurate are the weekly bars.
Even in the example, we see how we have benefited from the sharp drop in bitcoin, while the price is falling, and we have lowered the average with higher-weight purchases than the previous one.
In both buys and sales here, both the histogram intensities and the average of the purchases you have reduced with the transactions, or the earnings you have increased with the sales, guide you.
In areas with high volatility ,if we adjust our positions properly, even if we follow the changes in the region, we will get rid of those situations with few wounds and we will surely catch the trend!
NOTE : Crossover/crossunder and distributional buy/sell alerts added.
Best regards , Noldo.

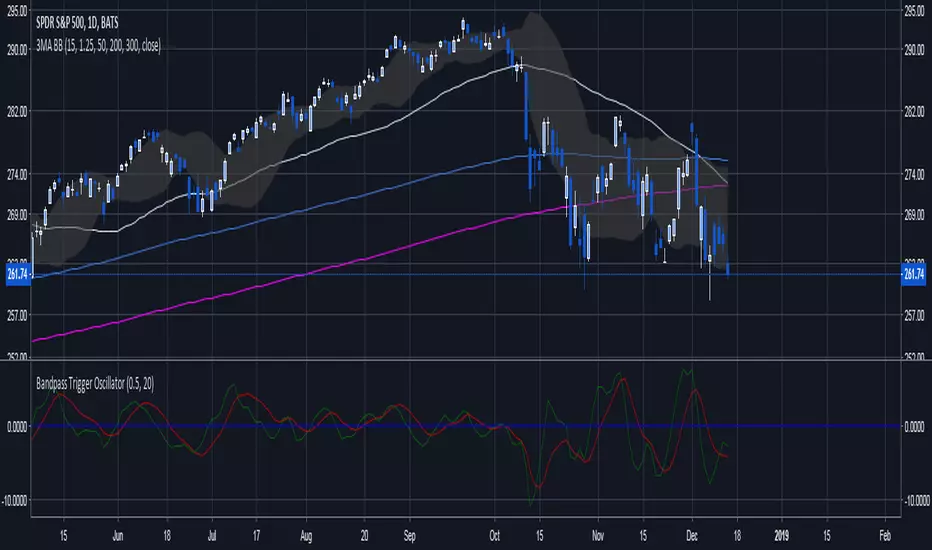
Adaptive Bandpass Trigger Oscillator Ver 3This is an improvement of the Adaptive Bandpass Trigger Oscillator. It adds an option for a multiplier to the dominant cycle to filter out smaller swings.
Feel free to message me if you would like development work or would just like to donate ; )
This is based off of Ehlers' Bandpass Filter system (link below slides 15-17). I then used Ehlers' methods for finding the dominant cycle to automatically input the dominant cycle to the length. Essentially Ehlers runs a band pass with a given period to detrend the price data and highlight a cycle with the given frequency(length). This represents the In phase cycle. Ehlers then creates the trigger line by taking the one bar momentum of the In Phase line, multiplying by 2Pi and then using this to create a 60 degree leading signal. The triggers are crossovers of the In Phase and Lead lines. You can also use conservative signals by waiting for the In Phase line to trend in the direction of the trigger crossover as well.
Delta represents how much to influence the oscillator by the price (Delta 0 is a perfect wave)
Alpha represents how quickly to adapt between the dominant cycle changes in the price.
Thanks to LazyBear for implementing Ehlers' original adaptive code, which I used for this system
Thanks to HPotter for the BandPass Filter code, which I used as a base for implementing the rest of the system

Adaptive Bandpass Trigger Oscillator Ver 2.0This is an improvement of the Adaptive Bandpass Trigger Oscillator. It normalizes the values to 0-100 to allow the addition of overbought and oversold levels. An aggressive trigger would be an inflection point of the trigger line while overbought/oversold and the phase line above/below the midline.
Feel free to message me if you would like development work or would just like to donate ; )
This is based off of Ehlers' Bandpass Filter system (link below slides 15-17). I then used Ehlers' methods for finding the dominant cycle to automatically input the dominant cycle to the length. Essentially Ehlers runs a band pass with a given period to detrend the price data and highlight a cycle with the given frequency(length). This represents the In phase cycle. Ehlers then creates the trigger line by taking the one bar momentum of the In Phase line, multiplying by 2Pi and then using this to create a 60 degree leading signal. The triggers are crossovers of the In Phase and Lead lines. You can also use conservative signals by waiting for the In Phase line to trend in the direction of the trigger crossover as well.
Delta represents how much to influence the oscillator by the price (Delta 0 is a perfect wave)
Alpha represents how quickly to adapt between the dominant cycle changes in the price.
Thanks to LazyBear for implementing Ehlers' original adaptive code, which I used for this system
Thanks to HPotter for the BandPass Filter code, which I used as a base for implementing the rest of the system
www.mesasoftware.com

Adaptive Bandpass Trigger OscillatorThis is based off of Ehler's Bandpass Filter system (link below slides 15-17). I then used Ehler's methods for finding the dominant cycle to automatically input the dominant cycle to the length. Essentially Ehler runs a band pass with a given period to detrend the price data and highlight a cycle with the given frequency(length). This represents the In phase cycle. Ehler then creates the trigger line by taking the one bar momentum of the In Phase line, multiplying by 2Pi and then using this to create a 60 degree leading signal. The triggers are crossovers of the In Phase and Lead lines. You can also use conservative signals by waiting for the In Phase line to trend in the direction of the trigger crossover as well.
Delta represents how much to influence the oscillator by the price (Delta 0 is a perfect wave)
Alpha represents how quickly to adapt between the dominant cycle changes in the price.
Thanks to LazyBear for implementing Ehler's original adaptive code, which I used for this system
Thanks to HPotter for the BandPass Filter code, which I used as a base for implementing the rest of the system
www.mesasoftware.com

Ehler Bandpass Trigger OscillatorThis is based off of Ehler's Bandpass Filter system (link below slides 15-17). Essentially Ehler runs a band pass with a given period to detrend the price data and highlight a cycle with the given frequency(length). This represents the In phase cycle. Ehler then creates the trigger line by taking the one bar momentum of the In Phase line, multiplying by 2Pi and then using this to create a 60 degree leading signal. The triggers are crossovers of the In Phase and Lead lines. You can also use conservative signals by waiting for the In Phase line to trend in the direction of the trigger crossover as well.
Length represent the cycle period you want to highlight.
Delta represents how much to influence the oscillator by the price (Delta 0 is a perfect wave)
Thanks to HPotter for the BandPass Filter code, which I used as a base for implementing the rest of the system
www.mesasoftware.com
Trend Continuation FactorTrend Continuation Factor indicator script.
This indicator was originally developed by M.H. Pee (Stocks & Commodities V. 20:3 (58-64): Trend Continuation Factor).

Ranging EMA SpreadAn attempt at identifying ranging price behavior at EMA crossover points.
I noticed that when price consolidates that the spread between two EMAs at times will sort of fluctuate between a tight range before it breaks out.
Basically this just highlights the bars that are within a predefined EMA spread percentage range for X amount of bars.
Sometimes the crossovers just happen cleanly, but the above example sort of illustrates my idea.

Open Close Cross Strategy R5 revised by JustUncleLThis revision is an open Public release, with just some minor changes. It is a revision of the Strategy "Open Close Cross Strategy R2" originally published by @JayRogers.
*** USE AT YOUR OWN RISK ***
JayRogers : "There are drawing/painting issues in pinescript when working across resolutions/timeframes that I simply cannot fix here.. I will not be putting any further effort into developing this until such a time when workarounds become available."
NOTE: Re-painting has not been observed with the default set up, nor with Alternate resolution multiplier up to 5.
Description:
Strategy based around Open-Close Moving Average Crossovers optionally from a higher time frame.
Setup:
I have generally found that setting the strategy resolution to 3-5x that of the chart you are viewing tends to yield the best results, regardless of which MA option you may choose (if any) BUT can cause a lot of false positives - be aware of this. JustUncleL: using one of the Smoothed MA helps reduce false positives.
Don't aim for perfection. Just aim to get a reasonably snug fit with the O-C band, with good runs of green and red. JustUncleL: using SMMA (8 to 10) gives a good fit.
Option to either use basic open and close series data, or pick your poison with a wide array of MA types.
Optional Stop Loss and Target Profit for damage mitigation if desired (can be toggled on/off)
Positions get taken automatically following a crossover - which is why it's better to set the resolution of the script greater than that of your chart, so that the trades get taken sooner rather than later.
If you make use of the stops/target profit, be sure to take your time tweaking the values. Cutting it too fine will cost you profits but keep you safer, while letting them loose could lead to more draw down than you can handle.
Revsion R5 Changes by JustUncleL
Corrected cross over calculations, sometimes gave false signals.
Corrected Alternate Time calculation to allow for Daily,Weekly and Monthly charts.
Open Public release.
Revision R4 By JustUncleL
Change the way the Alternate resolution in selected, use a Multiplier of the base Time Frame instead, this makes it easy to switch between base time frames.
Added TMA and SSMA moving average options. But DEMA is still giving the best results.
Using "calc_on_every_tick=false" ensures results between back testing and real time are similar.
Added Option to Disable the coloring of the bars.
Updated default settings.
R3 Changes by JustUncleL:
Returned a simplified version of the open/close channel, it shows strength of current trend.
Added Target Profit Option.
Added option to reduce the number of historical bars, overcomes the too many trades limit error.
Simplified the strategy code.
Removed Trailing Stop option, not required and in my option does not work well in Trading View, it also gives false and unrealistic performance results in back testing.
R2 Changes by @JayRogers:
Simplified and cleaned up plotting, now just shows a Moving Average derived from the average of open/close.
Tried very hard to alleviate painting issues caused by referencing alternate resolution.

Ehlers Cyber Cycle Indicator [LazyBear]The Cyber Cycle Indicator, developed by John Ehlers, is used for isolating the cycle component of the market from its trend counterpart. Unlike other oscillators like RSI, Cyber Cycle Indicator's wave has a variable amplitude.
Use the osc/signal crossover for entry/exit points. You can enable highlighting the crossovers by using region fills (via options page). I have also added an option to color the bars based on this.
Actually I have lot of Ehlers indicators in my to-publish backlog, will try to prioritize them over the others in the pipeline. Lets have an Ehlers week for indicators :)
More info:
Cybernetic Analysis for Stocks and Futures
List of my public indicators: bit.ly
List of my app-store indicators: blog.tradingview.com

Trend Detection
#### *Description:*
This *Trend Detection* indicator is designed to help traders identify and confirm trends in the market using a combination of moving averages, volume analysis, and MACD filters. It provides clear visual signals for uptrends and downtrends, along with customizable settings to adapt to different trading styles and timeframes. The indicator is suitable for both beginners and advanced traders who want to improve their trend-following strategies.
---
#### *Key Features:*
1. *Trend Detection:*
- Uses *Moving Averages (MA)* to determine the overall trend direction.
- Supports multiple MA types: *SMA (Simple), **EMA (Exponential), **WMA (Weighted), and **HMA (Hull)*.
2. *Advanced Filters:*
- *MACD Filter:* Confirms trends using MACD crossovers.
- *Volume Filter:* Ensures trends are supported by above-average volume.
- *Multi-Timeframe Filter:* Validates trends using a higher timeframe (e.g., Daily or Weekly).
3. *Visual Signals:*
- Plots a *trend line* on the chart to indicate the current trend direction.
- Fills the background with *green* for uptrends and *red* for downtrends.
4. *Customizable Settings:*
- Adjust the *MA lengths, **MACD parameters, and **confirmation thresholds* to suit your trading strategy.
- Control the transparency of the background fill for better chart readability.
5. *Alerts:*
- Generates *buy/sell signals* when a trend is confirmed.
- Alerts can be set to trigger at the close of a candle for precise entry/exit points.
---
#### *How to Use:*
1. *Adding the Indicator:*
- Copy and paste the Pine Script code into the TradingView Pine Script editor.
- Add the indicator to your chart.
2. *Configuring the Settings:*
- *Trend Settings:*
- Choose the *MA type* (e.g., EMA for faster response, HMA for smoother trends).
- Set the *Trend MA Period* (e.g., 200 for long-term trends) and *Filter MA Period* (e.g., 100 for medium-term trends).
- *Advanced Filters:*
- Enable/disable the *MACD Filter* and adjust its parameters (Fast, Slow, Signal).
- Enable/disable the *Volume Filter* to ensure trends are supported by volume.
- *Multi-Timeframe Filter:*
- Enable this filter to validate trends using a higher timeframe (e.g., Daily or Weekly).
3. *Interpreting the Signals:*
- *Uptrend:* The trend line turns *green*, and the background is filled with a transparent green color.
- *Downtrend:* The trend line turns *red*, and the background is filled with a transparent red color.
- *Alerts:* Buy/sell signals are generated when the trend is confirmed.
4. *Using Alerts:*
- Set up alerts for *Buy Signal* (bullish reversal) and *Sell Signal* (bearish reversal).
- Alerts can be configured to trigger at the close of a candle for precise execution.
---
#### *Settings and Their Effects:*
1. *MA Type:*
- *SMA:* Smooth but lagging. Best for long-term trends.
- *EMA:* Faster response to price changes. Suitable for medium-term trends.
- *WMA:* Gives more weight to recent prices. Useful for short-term trends.
- *HMA:* Combines speed and smoothness. Ideal for all timeframes.
2. *Trend MA Period:*
- A longer period (e.g., 200) identifies long-term trends but may lag.
- A shorter period (e.g., 50) reacts faster but may produce false signals.
3. *Filter MA Period:*
- Acts as a secondary filter to confirm the trend.
- A shorter period (e.g., 50) provides tighter confirmation but may increase noise.
4. *MACD Filter:*
- Ensures trends are confirmed by MACD crossovers.
- Adjust the *Fast, **Slow, and **Signal* lengths to match your trading style.
5. *Volume Filter:*
- Ensures trends are supported by above-average volume.
- Reduces false signals during low-volume periods.
6. *Multi-Timeframe Filter:*
- Validates trends using a higher timeframe (e.g., Daily or Weekly).
- Increases reliability but may delay signals.
7. *Confirmation Value:*
- Sets the minimum percentage deviation from the trend MA required to confirm a trend.
- A higher value (e.g., 2.0%) reduces false signals but may delay trend detection.
8. *Confirmation Bars:*
- Sets the number of bars required to confirm a trend.
- A higher value (e.g., 5 bars) ensures sustained trends but may delay signals.
---
#### *Who Should Use This Indicator?*
1. *Trend Followers:*
- Traders who focus on identifying and riding long-term trends.
- Suitable for *swing traders* and *position traders*.
2. *Day Traders:*
- Can use shorter MA periods and faster filters (e.g., EMA, HMA) for intraday trends.
3. *Volume-Based Traders:*
- Traders who rely on volume confirmation to validate trends.
4. *Multi-Timeframe Traders:*
- Traders who use higher timeframes to confirm trends on lower timeframes.
5. *Beginners:*
- Easy-to-understand visual signals and alerts make it beginner-friendly.
6. *Advanced Traders:*
- Customizable settings allow for fine-tuning to match specific strategies.
---
#### *Example Use Cases:*
1. *Long-Term Investing:*
- Use a *200-period SMA* with a *Daily* higher timeframe filter to identify long-term trends.
- Enable the *Volume Filter* to ensure trends are supported by strong volume.
2. *Swing Trading:*
- Use a *50-period EMA* with a *4-hour* higher timeframe filter for medium-term trends.
- Enable the *MACD Filter* to confirm trend reversals.
3. *Day Trading:*
- Use a *20-period HMA* with a *1-hour* higher timeframe filter for short-term trends.
- Disable the *Volume Filter* for faster signals.
---
#### *Conclusion:*
The *Trend Detection* indicator is a versatile tool for traders of all levels. Its customizable settings and advanced filters make it suitable for various trading styles and timeframes. By combining moving averages, volume analysis, and MACD filters, it provides reliable trend signals with minimal lag. Whether you're a beginner or an advanced trader, this indicator can help you make better trading decisions by identifying and confirming trends in the market.
---
#### *Publishing on TradingView:*
- *Title:* Trend Detection with Advanced Filters
- *Description:* A powerful trend detection tool using moving averages, volume analysis, and MACD filters. Suitable for all trading styles and timeframes.
- *Tags:* Trend, Moving Averages, MACD, Volume, Multi-Timeframe
- *Category:* Trend-Following
- *Access:* Public or Private (depending on your preference).
---
Let me know if you need further assistance or additional features!
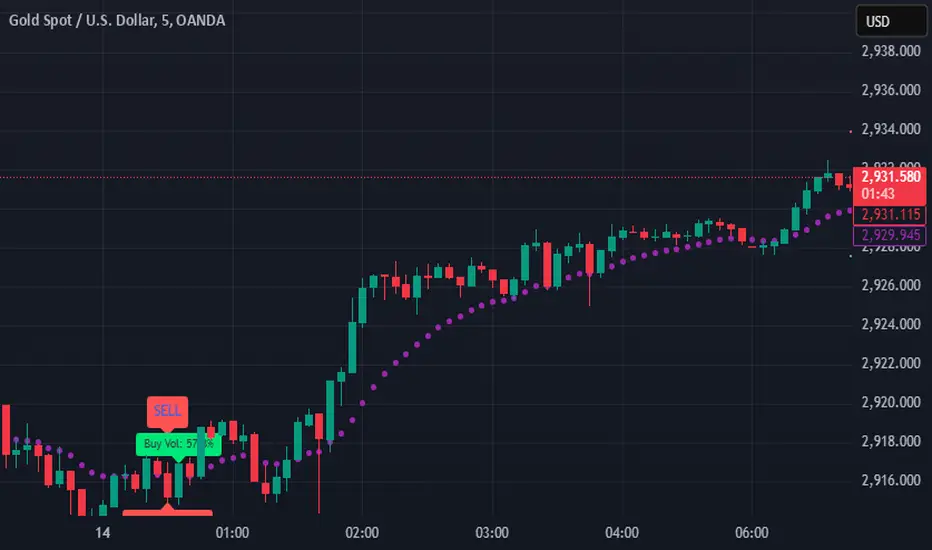
SIOVERSE EMA 15 with Buy/Sell Signals, Support & ResistanceThis Pine Script indicator is designed for TradingView and combines Exponential Moving Averages (EMAs), support and resistance levels, buy/sell signals, and volume percentage labels filtered by buy/sell conditions. It is a comprehensive tool for traders who want to analyze price trends, identify key levels, and make informed decisions based on volume and EMA crossovers.
Key Features of the Indicator
EMA 15 (Purple Dashed Line):
A 15-period Exponential Moving Average (EMA) is plotted on the chart as a dashed purple line.
This EMA helps traders identify short-term trends and potential entry/exit points.
Hidden EMA 21 and EMA 34:
The 21-period and 34-period EMAs are calculated but not displayed on the chart.
These EMAs are used to generate buy and sell signals based on crossovers.
Buy/Sell Signals:
Buy Signal: Occurs when the EMA 21 crosses above the EMA 34. A green "BUY" label is displayed below the candle.
Sell Signal: Occurs when the EMA 21 crosses below the EMA 34. A red "SELL" label is displayed above the candle.
These signals help traders identify potential trend reversals or continuations.
Support and Resistance Levels:
Support: The lowest price level over the last lookback_period candles, plotted as a green dashed horizontal line.
Resistance: The highest price level over the last lookback_period candles, plotted as a red dashed horizontal line.
These levels help traders identify key price zones for potential breakouts or reversals.
Volume Percentage Labels (Filtered by Buy/Sell Signals):
The volume percentage is calculated relative to the average volume over the last volume_lookback candles.
Buy Volume Label: When a buy signal occurs, a green label is displayed above the candle with the text "Buy Vol: X.XX%", where X.XX is the volume percentage.
Sell Volume Label: When a sell signal occurs, a red label is displayed below the candle with the text "Sell Vol: X.XX%", where X.XX is the volume percentage.
These labels help traders assess the strength of the buy/sell signals based on volume.
Alerts:
Alerts are triggered when buy or sell signals occur, notifying traders of potential trading opportunities.
CVD OscillatorCVD Delta Oscillator
A momentum oscillator that measures buying and selling pressure through volume analysis, based on the principle that volume precedes price (cause and effect).
How It Works
Volume Analysis
Measures the force of buying and selling by analyzing how volume interacts with price movement within each bar
When price closes higher in a bar's range with strong volume, this indicates stronger buying pressure
When price closes lower in a bar's range with strong volume, this indicates stronger selling pressure
Momentum Measurement
Uses two EMAs (fast and slow) to smooth the volume delta
The difference between these EMAs creates an oscillator that shows:
Rising values = Buying pressure increasing
Falling values = Selling pressure increasing
Zero line crossovers = Potential shift in control between buyers and sellers
Signal Generation
Divergences
Bullish: Price falls to new lows while buying pressure increases (potential reversal up)
Bearish: Price rises to new highs while selling pressure increases (potential reversal down)
Zero-Line Crossovers
Bullish: Buying pressure overtakes selling pressure
Bearish: Selling pressure overtakes buying pressure
Practical Application
Reading the Indicator
Green columns above zero = Net buying pressure
Red columns below zero = Net selling pressure
Larger columns = Stronger pressure
Divergences and crossovers = Potential turning points
Trading Context
Helps identify when price movement has strong or weak volume support
Shows potential exhaustion points through divergences
Confirms trend changes through zero-line crossovers
Customization
Adjustable EMA periods for different trading styles
Toggle-able visual signals
Automatic alerts for all signals
