MA Crossover BIFTY BNF with Broker Inputs//@version=6
strategy("MA Crossover with Broker Inputs", overlay=true, margin_long=100, margin_short=100, process_orders_on_close=true)
// === BROKER & ORDER SETTINGS ===
broker = input.string("Dhan", title="Broker", options= )
orderType = input.string("MKT", title="Order Type", options= )
clientID = input.string("", title="Client ID (Optional)")
secretKey = input.string("", title="Secret Key (from JSON)")
// === INSTRUMENT SELECTION ===
instrument = input.string("BANKNIFTY", title="Select Instrument", options= )
expiryMode = input.string("Auto", title="Expiry Mode", options= )
manualExpiry = input.string("17Dec2025", title="Manual Expiry Date (if Manual Mode)")
optionType = input.string("CE", title="Option Type", options= )
strikeSel = input.string("ATM", title="Strike Selection", options= )
// === RISK MANAGEMENT ===
stopLossPts = input.int(50, title="Stop Loss (points)")
takeProfitPts = input.int(100, title="Take Profit (points)")
// === STRATEGY LOGIC: Moving Average Crossover ===
fastLength = input.int(9, title="Fast MA Length")
slowLength = input.int(18, title="Slow MA Length")
price = close
maFast = ta.sma(price, fastLength)
maSlow = ta.sma(price, slowLength)
// Crossover Long
if (ta.crossover(maFast, maSlow))
strategy.entry("Long", strategy.long, comment="MA Crossover Long")
// Crossunder Short
if (ta.crossunder(maFast, maSlow))
strategy.entry("Short", strategy.short, comment="MA Crossover Short")
// Apply SL and TP
strategy.exit("Exit Long", from_entry="Long", stop=close - stopLossPts, limit=close + takeProfitPts)
strategy.exit("Exit Short", from_entry="Short", stop=close + stopLossPts, limit=close - takeProfitPts)
// === PLOTS ===
plot(maFast, color=color.green, title="Fast MA")
plot(maSlow, color=color.red, title="Slow MA")
Cerca negli script per "crossover债券是什么"

MAxRSI Signals [KedArc Quant]Description:
MAxRSI Indicator Marks LONG/SHORT signals from a Moving Average crossover and (optionally) confirms them with RSI. Includes repaint-safe confirmation, optional higher-timeframe (HTF) smoothing, bar coloring, and alert conditions.
Why combine MA + RSI
* The MA crossover is the primary trend signal (fast trend vs slow trend).
* RSI is a gate, not a second, separate signal. A crossover only becomes a trade signal if momentum agrees (e.g., RSI ≥ level for LONG, ≤ level for SHORT). This reduces weak crosses in ranging markets.
* The parts are integrated in one rule: *Crossover AND RSI condition (if enabled)* → plot signal/alert. No duplicated outputs or unrelated indicators.
How it works (logic)
* MA types: SMA / EMA / WMA / HMA (HMA is built via WMA of `len/2` and `len`, then WMA with `sqrt(len)`).
* Signals:
* LONG when *Fast MA crosses above Slow MA* and (if enabled) *RSI ≥ Long Min*.
* SHORT when *Fast MA crosses below Slow MA* and (if enabled) *RSI ≤ Short Max*.
* Repaint-safe (optional): confirms crosses on closed bars to avoid intrabar repaint.
* HTF (optional): computes MA/RSI on a higher timeframe to smooth noise on lower charts.
* Alerts: crossover alerts + state-flip (bull↔bear) alerts.
How to use (step-by-step)
1. Add to chart. Set MA Type, Fast and Slow (keep Fast < Slow).
2. Turn Use RSI Filter ON for confirmation (default: RSI 14 with 50/50 levels).
3. (Optional) Turn Repaint-Safe ON for close-confirmed signals.
4. (Optional) Turn HTF ON (e.g., 60 = 1h) for smoother signals on low TFs.
5. Enable alerts: pick “MAxRSI Long/Short” or “Bullish/Bearish State”.
Timeframe guidance
* Intraday (1–15m): EMA 9–20 fast vs EMA 50 slow, RSI filter at 50/50.
* Swing (1h–D): EMA 20 fast vs EMA 200 slow, RSI 50/50 (55/45 for stricter).
What makes it original
* Repaint-safe cross confirmation (previous-bar check) for reliable signals/alerts.
* HTF gating (doesn’t compute both branches) for speed and clarity.
* Warning-free MA helper (precomputes SMA/EMA/WMA/HMA each bar), HMA built from built-ins only.
* State-flip alerts and optional RSI overlay on price pane.
Built-ins used
`ta.sma`, `ta.ema`, `ta.wma`, (HMA built from these), `ta.rsi`, `ta.crossover`, `ta.crossunder`, `request.security`, `plot`, `plotshape`, `barcolor`, `alertcondition`, `input.*`, `math.*`.
Note: Indicator only (no orders). Test settings per symbol. Not financial advice.
⚠️ Disclaimer
This script is provided for educational purposes only.
Past performance does not guarantee future results.
Trading involves risk, and users should exercise caution and use proper risk management when applying this strategy.

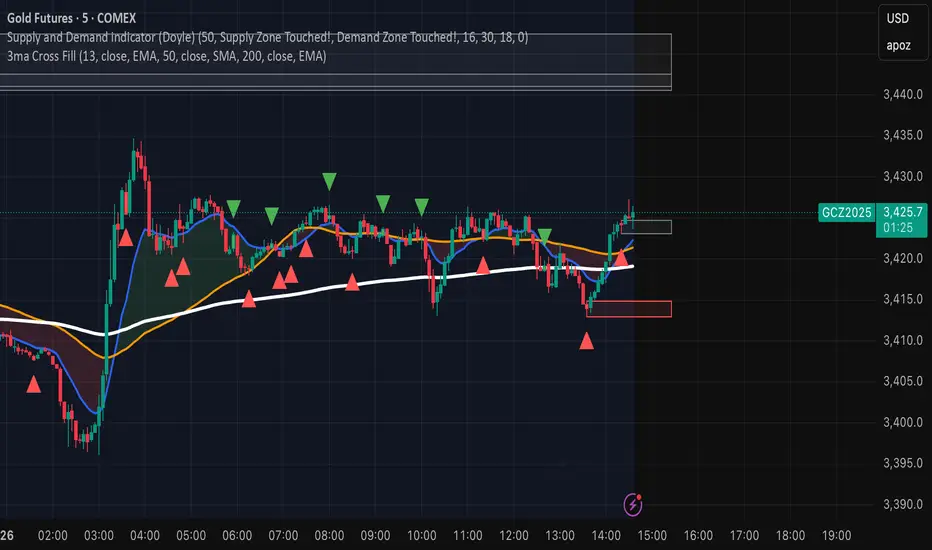
Configurable 3MA with Crossover CloudThis script is a versatile and powerful enhancement of the classic triple moving average setup, designed to provide clear, at-a-glance insights into market trends and momentum shifts. It plots three moving averages on your chart and colors the area between the two shorter-term MAs, creating a visual "cloud" that instantly signals bullish or bearish sentiment.
The core of this indicator is its complete customizability, allowing you to tailor it precisely to your trading strategy and the asset you are analyzing.
Key Features:
Dynamic Crossover Cloud: The space between the first two moving averages is colored to represent momentum:
Green Cloud: Indicates a bullish crossover, where the shorter-term MA is above the medium-term MA.
Red Cloud: Indicates a bearish crossover, where the shorter-term MA is below the medium-term MA.
Complete Customization: Unlike standard MA indicators, every aspect of the three moving averages can be configured independently:
Length: Set the period for each MA.
Type: Choose between a Simple Moving Average (SMA) or an Exponential Moving Average (EMA) for each line.
Source: Base the calculation on any price source (close, open, high, low, hl2, etc.).
Individual Visibility Toggles: Clean up your chart by hiding any of the three moving averages directly from the settings panel.
How to Use:
This indicator is ideal for trend-following and crossover strategies.
Identify Momentum: Use the color of the cloud to quickly gauge short-term momentum. A green cloud suggests bullish strength, while a red cloud suggests bearish pressure.
Confirm the Trend: Use the third, long-term moving average (e.g., a 200-period MA) as a macro trend filter. For a higher probability trade, only consider long positions when the price is above the long-term MA and the cloud is green. Conversely, only consider short positions when the price is below the long-term MA and the cloud is red.
Customize for Your Style: Adjust the default settings (13 EMA, 50 SMA, 200 EMA) to fit your preferred timeframes and trading style, whether you're a scalper, day trader, or swing trader.
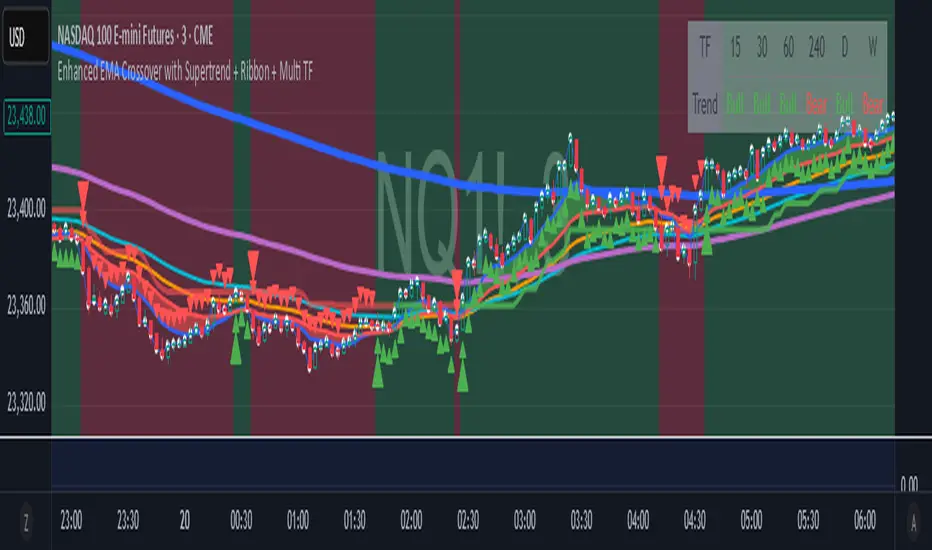
Enhanced EMA Crossover with Supertrend + Ribbon + Multi TFThe indicator has 4 core indicators in 1, the supertrend, the 2ema crossover, the moving average ribbon and a multi-timeframe trend indicator. I have modified the code for better visuals, all the indicators are fully customizable for better visuals and trend identification. Specially the 2 ema crossover indicator ribbon should guide you in the direction of the overall trend in different timeframes. The white dots were added to the real price close on everu candle , it is very usefull visually to see exactly where the price is closing specially when using heiken ashi candles. The small arrows on every candle should guide you in the direction of the overall trend when adjusting the 2 ema crossover lengths, the bigger arrow plots on the first candle only when the 2 ema crossover happens to either direction, using the supertrend indicator with the moving averages will also help you keep in the right trend direction.
Buy/sell EMA Crossover with 5 ema RibbonThe indicator has 2 indicators in 1, based all on customizable ema's. The main ema signal indicator is customizable for the length , at the ema crossover the indicator will plot the main (biggerarrow )buy or sell signal when the crossover happens and plot(smaller) directional arrows on all the following candles after the crossover, this helps with the visuals for the main trend. The 2nd indicator is a also customizable ema ribbon that will help in the trend direction.(ex: you can plot larger length ema's for better visual of the main on any timeframe. The indicator is designed for easy ema visuals with background trend color change, and color change on the main 2 ema crossover for easy detection of the price trend.

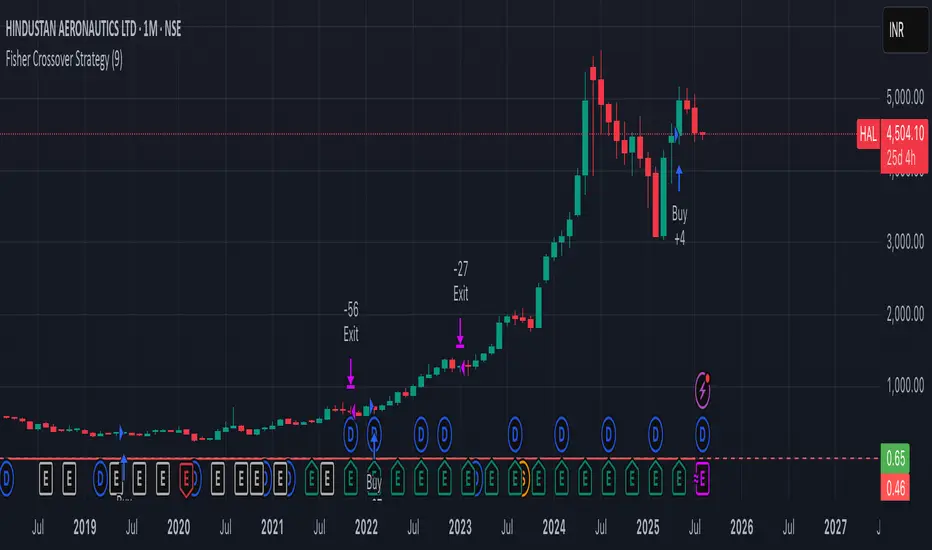
Fisher Crossover StrategyThe Fisher Crossover Strategy is a popular technical trading method that uses the Fisher Transform indicator developed by John Ehlers. This indicator mathematically converts price data into a normal Gaussian distribution, making market turning points sharper and easier to identify. The strategy is based on two lines: the Fisher line, which is the main transformed price value, and the Trigger line, which is a one-period lag of the Fisher line. Traders use the crossover of these lines to determine buy and sell opportunities.
A buy signal is generated when the Fisher line crosses above the Trigger line, indicating that bullish momentum may be starting, while a sell signal occurs when the Fisher line crosses below the Trigger line, suggesting a possible bearish reversal. Signals that occur relative to the zero line are often considered stronger; for example, a buy signal below the zero line may indicate a deeper market reversal. The strategy is simple to follow and can be applied to various markets including stocks, forex, commodities, and cryptocurrencies.
However, like all crossover strategies, it can produce false signals during sideways or ranging markets. To reduce whipsaws, traders often combine the Fisher Crossover Strategy with other tools such as support and resistance levels, volume analysis, or moving averages. Proper risk management with stop-loss and take-profit levels is also essential. Overall, the Fisher Crossover Strategy is valued for its clear entry and exit rules and its ability to highlight potential market reversals earlier than many other indicators.
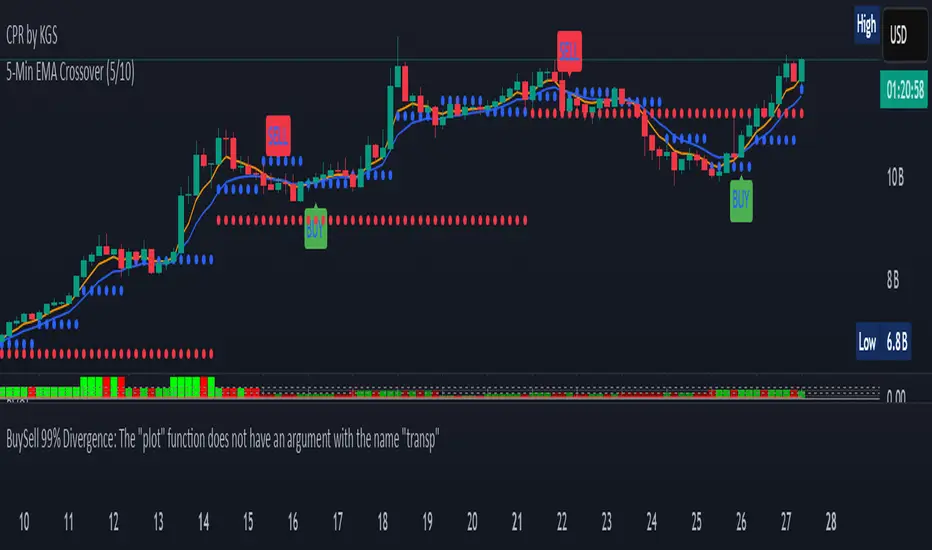
5-Min EMA Crossover (5/10)The 5-Minute EMA Crossover (5/10) strategy is a technical trading approach that uses two Exponential Moving Averages (EMAs) on a 5-minute chart to identify potential buy and sell signals based on trend shifts. Here's a description:
EMAs Used:
Fast EMA: 5-period EMA calculated on 5-minute candles. This EMA reacts quickly to recent price changes since it gives more weight to the latest data.
Slow EMA: 10-period EMA calculated on 5-minute candles. It responds more slowly, smoothing out short-term fluctuations.
How the Crossover Works:
A buy signal (long entry) occurs when the 5-period EMA crosses above the 10-period EMA. This suggests that recent price momentum is gaining strength upward, potentially indicating a bullish trend beginning or resuming.
A sell signal (short entry) happens when the 5-period EMA crosses below the 10-period EMA, signaling weakening recent price momentum and a possible bearish trend.
Purpose:
This crossover method helps traders catch short-term trends on a 5-minute timeframe by signaling moments when momentum shifts.
Because EMAs weight recent prices more heavily, the signals tend to be more responsive to fast market moves compared to simple moving averages.
Typical Usage:
Traders apply this to intraday charts (5-minute candles) looking for quick entries and exits.
It is common to use this crossover in combination with other indicators or price action context to reduce false signals.
Example of Signal Application:
When the 5 EMA crosses above the 10 EMA, consider entering a long position.
When the 5 EMA crosses below the 10 EMA, consider exiting longs or entering shorts.
This method leverages short-term momentum shifts visible on the 5-minute timeframe to help take advantage of intraday trends or reversals.
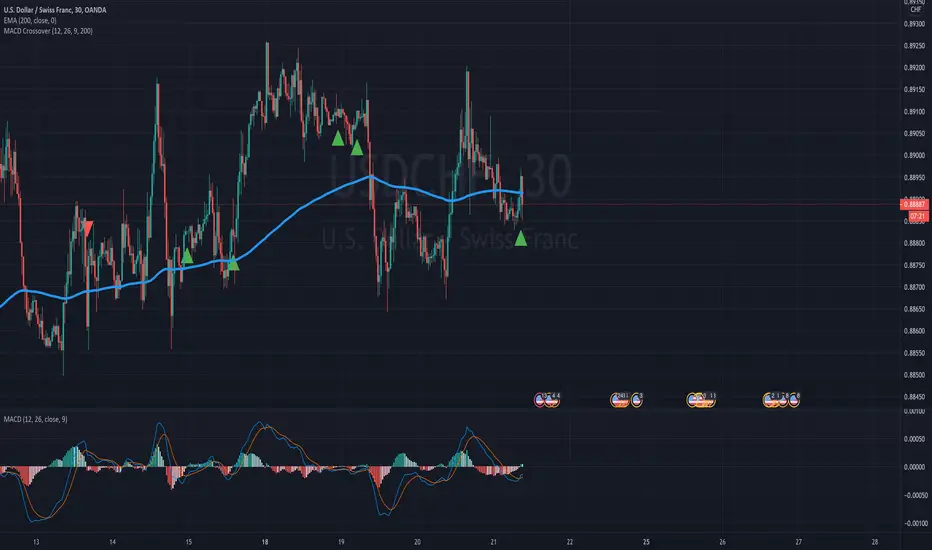
MACD Liquidity Tracker Strategy [Quant Trading]MACD Liquidity Tracker Strategy
Overview
The MACD Liquidity Tracker Strategy is an enhanced trading system that transforms the traditional MACD indicator into a comprehensive momentum-based strategy with advanced visual signals and risk management. This strategy builds upon the original MACD Liquidity Tracker System indicator by TheNeWSystemLqtyTrckr , converting it into a fully automated trading strategy with improved parameters and additional features.
What Makes This Strategy Original
This strategy significantly enhances the basic MACD approach by introducing:
Four distinct system types for different market conditions and trading styles
Advanced color-coded histogram visualization with four dynamic colors showing momentum strength and direction
Integrated trend filtering using 9 different moving average types
Comprehensive risk management with customizable stop-loss and take-profit levels
Multiple alert systems for entry signals, exits, and trend conditions
Flexible signal display options with customizable entry markers
How It Works
Core MACD Calculation
The strategy uses a fully customizable MACD configuration with traditional default parameters:
Fast MA : 12 periods (customizable, minimum 1, no maximum limit)
Slow MA : 26 periods (customizable, minimum 1, no maximum limit)
Signal Line : 9 periods (customizable, now properly implemented and used)
Cryptocurrency Optimization : The strategy's flexible parameter system allows for significant optimization across different crypto assets. Traditional MACD settings (12/26/9) often generate excessive noise and false signals in volatile crypto markets. By using slower, more smoothed parameters, traders can capture meaningful momentum shifts while filtering out market noise.
Example - DOGE Optimization (45/80/290 settings) :
• Performance : Optimized parameters yielding exceptional backtesting results with 29,800% PnL
• Why it works : DOGE's high volatility and social sentiment-driven price action benefits from heavily smoothed indicators
• Timeframes : Particularly effective on 30-minute and 4-hour charts for swing trading
• Logic : The very slow parameters filter out noise and capture only the most significant trend changes
Other Optimizable Cryptocurrencies : This parameter flexibility makes the strategy highly effective for major altcoins including SUI, SEI, LINK, Solana (SOL) , and many others. Each crypto asset can benefit from custom parameter tuning based on its unique volatility profile and trading characteristics.
Four Trading System Types
1. Normal System (Default)
Long signals : When MACD line is above the signal line
Short signals : When MACD line is below the signal line
Best for : Swing trading and capturing longer-term trends in stable markets
Logic : Traditional MACD crossover approach using the signal line
2. Fast System
Long signals : Bright Blue OR Dark Magenta (transparent) histogram colors
Short signals : Dark Blue (transparent) OR Bright Magenta histogram colors
Best for : Scalping and high-volatility markets (crypto, forex)
Logic : Leverages early momentum shifts based on histogram color changes
3. Safe System
Long signals : Only Bright Blue histogram color (strongest bullish momentum)
Short signals : All other colors (Dark Blue, Bright Magenta, Dark Magenta)
Best for : Risk-averse traders and choppy markets
Logic : Prioritizes only the strongest bullish signals while treating everything else as bearish
4. Crossover System
Long signals : MACD line crosses above signal line
Short signals : MACD line crosses below signal line
Best for : Precise timing entries with traditional MACD methodology
Logic : Pure crossover signals for more precise entry timing
Color-Coded Histogram Logic
The strategy uses four distinct colors to visualize momentum:
🔹 Bright Blue : MACD > 0 and rising (strong bullish momentum)
🔹 Dark Blue (Transparent) : MACD > 0 but falling (weakening bullish momentum)
🔹 Bright Magenta : MACD < 0 and falling (strong bearish momentum)
🔹 Dark Magenta (Transparent) : MACD < 0 but rising (weakening bearish momentum)
Trend Filter Integration
The strategy includes an advanced trend filter using 9 different moving average types:
SMA (Simple Moving Average)
EMA (Exponential Moving Average) - Default
WMA (Weighted Moving Average)
HMA (Hull Moving Average)
RMA (Running Moving Average)
LSMA (Least Squares Moving Average)
DEMA (Double Exponential Moving Average)
TEMA (Triple Exponential Moving Average)
VIDYA (Variable Index Dynamic Average)
Default Settings : 50-period EMA for trend identification
Visual Signal System
Entry Markers : Blue triangles (▲) below candles for long entries, Magenta triangles (▼) above candles for short entries
Candle Coloring : Price candles change color based on active signals (Blue = Long, Magenta = Short)
Signal Text : Optional "Long" or "Short" text inside entry triangles (toggleable)
Trend MA : Gray line plotted on main chart for trend reference
Parameter Optimization Examples
DOGE Trading Success (Optimized Parameters) :
Using 45/80/290 MACD settings with 50-period EMA trend filter has shown exceptional results on DOGE:
Performance : Backtesting results showing 29,800% PnL demonstrate the power of proper parameter optimization
Reasoning : DOGE's meme-driven volatility and social sentiment spikes create significant noise with traditional MACD settings
Solution : Very slow parameters (45/80/290) filter out social media-driven price spikes while capturing only major momentum shifts
Optimal Timeframes : 30-minute and 4-hour charts for swing trading opportunities
Result : Exceptionally clean signals with minimal false entries during DOGE's characteristic pump-and-dump cycles
Multi-Crypto Adaptability :
The same optimization principles apply to other major cryptocurrencies:
SUI : Benefits from smoothed parameters due to newer coin volatility patterns
SEI : Requires adjustment for its unique DeFi-related price movements
LINK : Oracle news events create price spikes that benefit from noise filtering
Solana (SOL) : Network congestion events and ecosystem developments need smoothed detection
General Rule : Higher volatility coins typically benefit from very slow MACD parameters (40-50 / 70-90 / 250-300 ranges)
Key Input Parameters
System Type : Choose between Fast, Normal, Safe, or Crossover (Default: Normal)
MACD Fast MA : 12 periods default (no maximum limit, consider 40-50 for crypto optimization)
MACD Slow MA : 26 periods default (no maximum limit, consider 70-90 for crypto optimization)
MACD Signal MA : 9 periods default (now properly utilized, consider 250-300 for crypto optimization)
Trend MA Type : EMA default (9 options available)
Trend MA Length : 50 periods default (no maximum limit)
Signal Display : Both, Long Only, Short Only, or None
Show Signal Text : True/False toggle for entry marker text
Trading Applications
Recommended Use Cases
Momentum Trading : Capitalize on strong directional moves using the color-coded system
Trend Following : Combine MACD signals with trend MA filter for higher probability trades
Scalping : Use "Fast" system type for quick entries in volatile markets
Swing Trading : Use "Normal" or "Safe" system types for longer-term positions
Cryptocurrency Trading : Optimize parameters for individual crypto assets (e.g., 45/80/290 for DOGE, custom settings for SUI, SEI, LINK, SOL)
Market Suitability
Volatile Markets : Forex, crypto, indices (recommend "Fast" system or smoothed parameters)
Stable Markets : Stocks, ETFs (recommend "Normal" or "Safe" system)
All Timeframes : Effective from 1-minute charts to daily charts
Crypto Optimization : Each major cryptocurrency (DOGE, SUI, SEI, LINK, SOL, etc.) can benefit from custom parameter tuning. Consider slower MACD parameters for noise reduction in volatile crypto markets
Alert System
The strategy provides comprehensive alerts for:
Entry Signals : Long and short entry triangle appearances
Exit Signals : Position exit notifications
Color Changes : Individual histogram color alerts
Trend Conditions : Price above/below trend MA alerts
Strategy Parameters
Default Settings
Initial Capital : $1,000
Position Size : 100% of equity
Commission : 0.1%
Slippage : 3 points
Date Range : January 1, 2018 to December 31, 2069
Risk Management (Optional)
Stop Loss : Disabled by default (customizable percentage-based)
Take Profit : Disabled by default (customizable percentage-based)
Short Trades : Disabled by default (can be enabled)
Important Notes and Limitations
Backtesting Considerations
Uses realistic commission (0.1%) and slippage (3 points)
Default position sizing uses 100% equity - adjust based on risk tolerance
Stop-loss and take-profit are disabled by default to show raw strategy performance
Strategy does not use lookahead bias or future data
Risk Warnings
Past performance does not guarantee future results
MACD-based strategies may produce false signals in ranging markets
Consider combining with additional confluences like support/resistance levels
Test thoroughly on demo accounts before live trading
Adjust position sizing based on your risk management requirements
Technical Limitations
Strategy does not work on non-standard chart types (Heikin Ashi, Renko, etc.)
Signals are based on close prices and may not reflect intraday price action
Multiple rapid signals in volatile conditions may result in overtrading
Credits and Attribution
This strategy is based on the original "MACD Liquidity Tracker System" indicator created by TheNeWSystemLqtyTrckr . This strategy version includes significant enhancements:
Complete strategy implementation with entry/exit logic
Addition of the "Crossover" system type
Proper implementation and utilization of the MACD signal line
Enhanced risk management features
Improved parameter flexibility with no artificial maximum limits
Additional alert systems for comprehensive trade management
The original indicator's core color logic and visual system have been preserved while expanding functionality for automated trading applications.

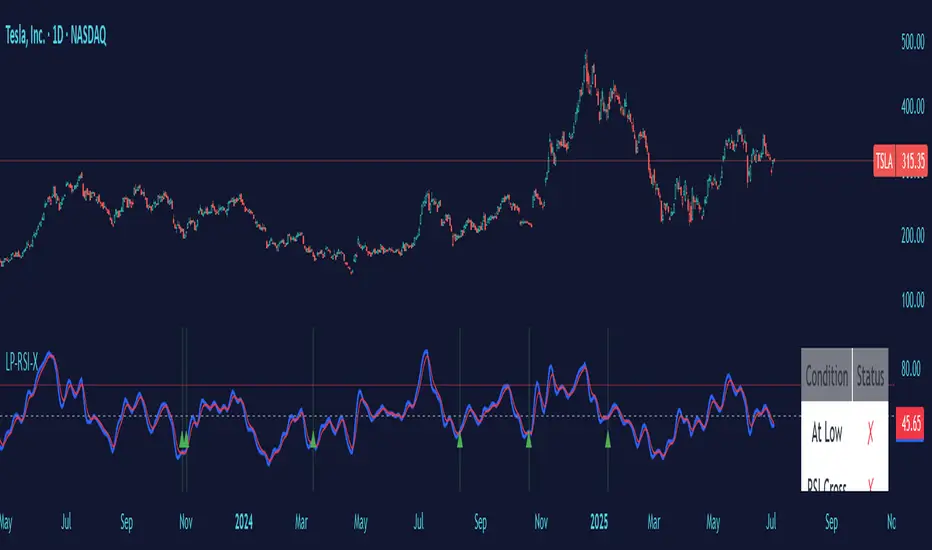
Low Price RSI CrossoverThis Pine Script indicator is a Multi-Timeframe Low RSI Crossover system that combines three key filtering criteria to identify high-probability buy signals. Here's what it does:
Core Concept
The indicator only generates buy signals when all three conditions are met simultaneously:
Price at Multi-Period Low: Current price must be at or near the lowest point within your selected timeframe (1 week to 5 years, or custom)
RSI Momentum Shift: The smoothed RSI must cross above its signal line (EMA), indicating upward momentum
Below Threshold Entry: Both the RSI and its signal line must be below your threshold level (default 50) when the crossover occurs
Key Features
RSI Smoothing: Uses Hull Moving Average (HMA) to smooth the raw RSI, reducing noise and false signals while maintaining responsiveness.
Flexible Timeframes: Choose from predefined periods (1W, 2W, 3W, 1M, 2M, 3M, 6M, 9M, 1Y, 2Y, 3Y, 5Y) or set a custom number of bars.
Visual Feedback:
Plots the smoothed RSI (blue line) and its signal line (red line)
Shows threshold and overbought levels
Highlights signal bars with green background
Displays tiny green triangles at signal points
Real-time status table showing all conditions
Trading Logic
This is essentially a mean-reversion strategy that waits for:
Price to reach significant lows (value zone)
Momentum to start shifting upward (RSI crossover)
Entry from oversold/neutral territory (below 50 RSI)
Why This Works
By requiring price to be at multi-period lows, you avoid buying during downtrends or sideways chop. The RSI crossover confirms that selling pressure is starting to ease, while the threshold filter ensures you're not buying into overbought conditions.
The combination of these filters should significantly reduce false signals compared to using any single indicator alone.
Smart MA Crossover BacktesterSmart MA Crossover Backtester - Strategy Overview
Strategy Name: Smart MA Crossover Backtester
Published on: TradingView
Applicable Markets: Works well on crypto (tested profitably on ETH)
Strategy Concept
The Smart MA Crossover Backtester is an improved Moving Average (MA) crossover strategy that incorporates a trend filter and an ATR-based stop loss & take profit mechanism for better risk management. It aims to capture trends efficiently while reducing false signals by only trading in the direction of the long-term trend.
Core Components & Logic
Moving Averages (MA) for Entry Signals
Fast Moving Average (9-period SMA)
Slow Moving Average (21-period SMA)
A trade signal is generated when the fast MA crosses the slow MA.
Trend Filter (200-period SMA)
Only enters long positions if price is above the 200-period SMA (bullish trend).
Only enters short positions if price is below the 200-period SMA (bearish trend).
This helps in avoiding counter-trend trades, reducing whipsaws.
ATR-Based Stop Loss & Take Profit
Uses the Average True Range (ATR) with a multiplier of 2 to calculate stop loss.
Risk-Reward Ratio = 1:2 (Take profit is set at 2x ATR).
This ensures dynamic stop loss and take profit levels based on market volatility.
Trading Rules
✅ Long Entry (Buy Signal):
Fast MA (9) crosses above Slow MA (21)
Price is above the 200 MA (bullish trend filter active)
Stop Loss: Below entry price by 2× ATR
Take Profit: Above entry price by 4× ATR
✅ Short Entry (Sell Signal):
Fast MA (9) crosses below Slow MA (21)
Price is below the 200 MA (bearish trend filter active)
Stop Loss: Above entry price by 2× ATR
Take Profit: Below entry price by 4× ATR
Why This Strategy Works Well for Crypto (ETH)?
🔹 Crypto markets are highly volatile – ATR-based stop loss adapts dynamically to market conditions.
🔹 Long-term trend filter (200 MA) ensures trading in the dominant direction, reducing false signals.
🔹 Risk-reward ratio of 1:2 allows for profitable trades even with a lower win rate.
This strategy has been tested on Ethereum (ETH) and has shown profitable performance, making it a strong choice for crypto traders looking for trend-following setups with solid risk management. 🚀

Moving Average Crossover Strategy with Take Profit and Stop LossThe Moving Average Crossover Strategy is a popular trading technique that utilizes two moving averages (MAs) of different periods to identify potential buy and sell signals. By incorporating take profit and stop loss levels, traders can effectively manage their risk while maximizing potential returns. Here’s a detailed explanation of how this strategy works:
Overview of the Moving Average Crossover Strategy
Moving Averages:
A short-term moving average (e.g., 50-day MA) reacts more quickly to price changes, while a long-term moving average (e.g., 200-day MA) smooths out price fluctuations over a longer period.
The strategy generates trading signals based on the crossover of these two averages:
Buy Signal: When the short-term MA crosses above the long-term MA (often referred to as a "Golden Cross").
Sell Signal: When the short-term MA crosses below the long-term MA (known as a "Death Cross").
Implementing Take Profit and Stop Loss
1. Setting Take Profit Levels
Definition: A take profit order automatically closes a trade when it reaches a specified profit level.
Strategy:
Determine a realistic profit target based on historical price action, support and resistance levels, or a fixed risk-reward ratio (e.g., 2:1).
For instance, if you enter a buy position at $100, you might set a take profit at $110 if you anticipate that level will act as resistance.
2. Setting Stop Loss Levels
Definition: A stop loss order limits potential losses by closing a trade when the price reaches a specified level.
Strategy:
Place the stop loss just below the most recent swing low for buy orders or above the recent swing high for sell orders.
Alternatively, you can use a percentage-based method (e.g., 2-3% below the entry point) to define your stop loss.
For example, if you enter a buy position at $100 with a stop loss set at $95, your maximum loss would be limited to $5 per share.
Example of Using Moving Average Crossover with Take Profit and Stop Loss
Entry Signal:
You observe that the 50-day MA crosses above the 200-day MA at $100. You enter a buy position.
Setting Take Profit and Stop Loss:
You analyze historical price levels and set your take profit at $110.
You place your stop loss at $95 based on recent swing lows.
Trade Management:
If the price rises to $110, your take profit order is executed, securing your profit.
If the price falls to $95, your stop loss is triggered, limiting your losses.

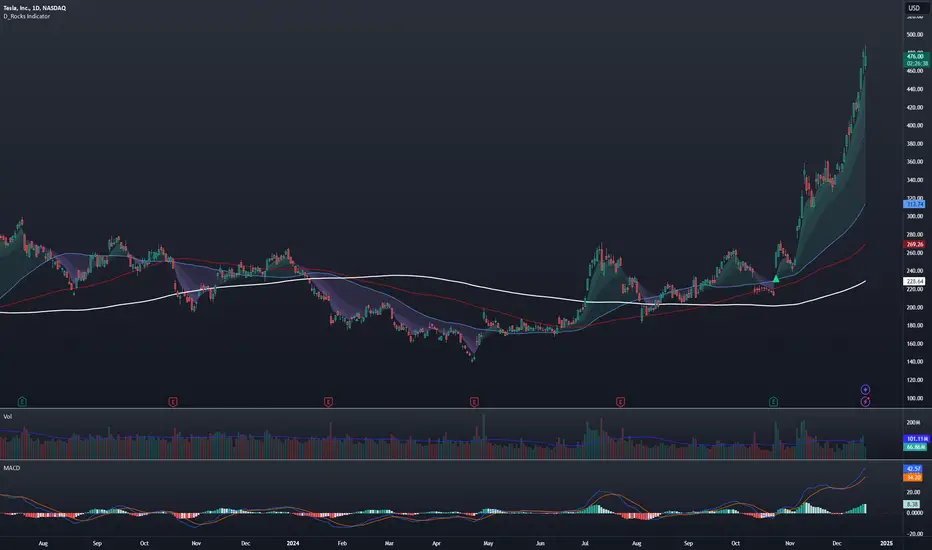
D_Rock's MA IndicatorD_Rock's Moving Average Indicator
This is an indicator version of my strategy linked here
**Overview:**
The basic concept of this indicator is to generate a signal when a faster/shorter length moving average crosses over (for Longs) or crosses under (for Shorts) a medium/longer length moving average. All of which are customizable. This indicator can work on any timeframe, however the daily is the timeframe used for the default settings and screenshots, as it was designed to be a multi-day swing strategy. Once a signal has been confirmed with a candle close, based on user options, the strategy is to enter the trade on the open of the next candle.
The crossover strategy is nothing new to trading, but what can make this strategy unique and helpful, is the addition of further confirmation points before a signal is generated along with the ability to show multiple moving averages on the chart if you choose. Each moving average pair can also be turned into a "cloud" instead of the traditional lines, for additional viewing preferences. Just about everything visual can be toggled on/off as well.
This indicator is a Trend (MA) indicator with optional confirmation points using a Momentum (MACD) indicator. While a Volume-based indicator is not shown here, one could consider using their favorite from that category to further compliment the signal idea.
If you would like to see the backtesting results for your favorite moving average crossover/under, please see my strategy version linked here .
Shoutout given to Ripster's Clouds Indicator as pieces of that code were taken and modified to create both the Cloud visualization effects, and the Moving Average Pair Plots that are implemented in this strategy.
MOVING AVERAGE OPTIONS
Select between and change the length & type of up to 5 pairs (10 total) of moving averages
The "Show Cloud-x" option will display a fill color between the "a" and "b" pairs
All moving averages lines can be toggled on/off in the "Style" tab, as well as adjusting their colors.
Visualization features do not affect calculations, meaning you could have all or nothing on the chart and the strategy will still produce results
SIGNAL CHOICES
Choose the fast/shorter length MA and the medium/longer length MA to determine the entry signal
CONFIRMATION OPTIONS
Both of these have customizable values and can be toggled on/off
A candle close over a slower/much longer length moving average
An additional cross-over (cross-under for Shorts) on the MACD indicator using default MACD values. While the MACD indicator is not necessary to have on the chart, it can help to add that for visualization. The calculations will perform whether the indicator is on the chart or not.
ADDITIONAL PLOTS
MACD (Moving Average Convergence/Divergence):
- The MACD is an optional confirmation indicator for this strategy.
- Plotting the indicator is not necessary for the strategy to work, but it can be helpful to visually see the status and position of the MACD if this feature is enabled in the strategy
- This helps to identify if there is also momentum behind the entry signal
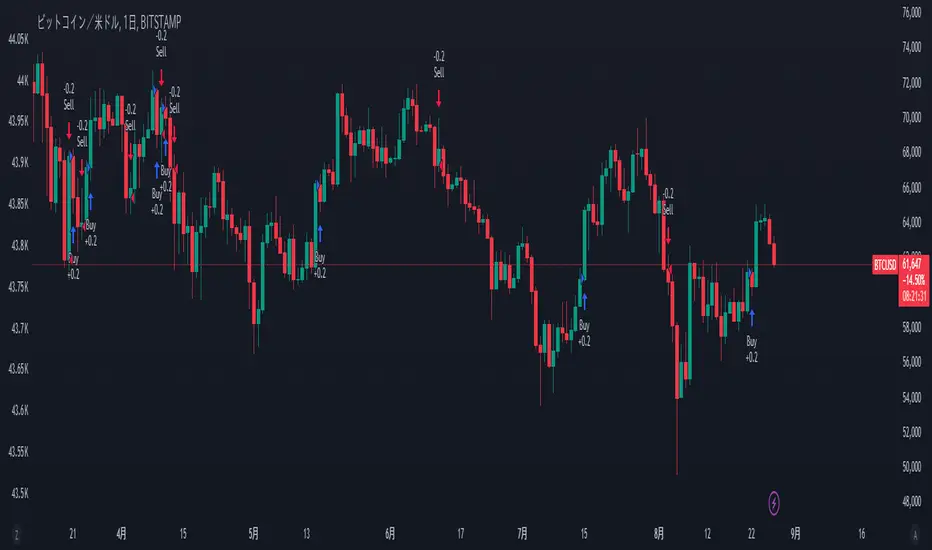
PVT Crossover Strategy**Release Notes**
**Strategy Name**: PVT Crossover Strategy
**Purpose**: This strategy aims to capture entry and exit points in the market using the Price-Volume Trend (PVT) and its Exponential Moving Average (EMA). It specifically uses the crossover of PVT with its EMA as signals to identify changes in market trends.
**Uniqueness and Usefulness**
**Uniqueness**: This strategy is unique in its use of the PVT indicator, which combines price changes with trading volume to track trends. The filtering with EMA reduces noise and provides more accurate signals compared to other indicators.
**Usefulness**: This strategy is effective for traders looking to detect trend changes early. The signals based on PVT and its EMA crossover work particularly well in markets where volume fluctuations are significant.
**Entry Conditions**
**Long Entry**:
- **Condition**: A crossover occurs where PVT crosses above its EMA.
- **Signal**: A buy signal is generated, indicating a potential uptrend.
**Short Entry**:
- **Condition**: A crossunder occurs where PVT crosses below its EMA.
- **Signal**: A sell signal is generated, indicating a potential downtrend.
**Exit Conditions**
**Exit Strategy**:
- The strategy does not explicitly program exit conditions beyond the entry signals, but traders are encouraged to close positions manually based on signals or apply their own risk management strategy.
**Risk Management**
This strategy does not include default risk management rules, so traders should implement their own. Consider using trailing stops or fixed stop losses to manage risk.
**Account Size**: ¥100,000
**Commissions and Slippage**: 94 pips per trade for commissions and 1 pip for slippage
**Risk per Trade**: 10% of account equity
**Configurable Options**
**Configurable Options**:
- **EMA Length**: The length of the EMA used to calculate the EMA of PVT (default is 20).
- **Signal Display Control**: The option to turn the display of signals on or off.
**Adequate Sample Size**
To ensure the robustness and reliability of this strategy, it is recommended to backtest it with a sufficiently long period of historical data, especially across different market conditions.
**Credits**
**Acknowledgments**:
This strategy is based on the concept of the PVT indicator and its application in strategy design, drawing on contributions from technical analysis and the trading community.
**Clean Chart Description**
**Chart Appearance**:
This strategy is designed to maintain a clean and simple chart by turning off the plot of PVT, its EMA, and entry signals. This reduces clutter and allows for more effective trend analysis.
**Addressing the House Rule Violations**
**Omissions and Unrealistic Claims**
**Clarification**:
This strategy does not make unrealistic or unsupported claims about its performance, and all signals are for educational purposes only, not guaranteeing future results. It is important to understand that past performance does not guarantee future outcomes.
MACD crossover while RSI Oversold/OverboughtThis indicator draws signals on the chart when a Bullish MACD Crossover occurs at the same time RSI is "oversold", and also when Bearish MACD Crossover occurs at the same time RSI is "overbought"
Indicators are drawn on the chart in the following scenarios:
1. Bullish signal
a. MACD bullish crossover occurs on a single bar
b. RSI was below the Oversold threshold (29 by default) within the prior 5 bars
2. Bearish signal
a. MACD bearish crossover occurs on a singnle bar
b. RSI was above the Overbought threshold (71 by default) within the prior 5 bars

Triple EMA Crossover StrategyTriple EMA Crossover Strategy
Overview
The Triple EMA Crossover Strategy is a trend-following trading system that utilizes three Exponential Moving Averages (EMAs) to identify potential entry and exit points in the market. This strategy is based on the principle that when shorter-term prices cross above longer-term prices, it can indicate a bullish trend, and conversely when they cross below, it can signal a bearish trend.
Components
Exponential Moving Averages (EMAs):
Short EMA: A fast-moving average that reacts quickly to price changes (commonly set to 9 periods).
Medium EMA: A medium-term average that smooths out price data and helps confirm trends (commonly set to 21 periods).
Long EMA: A slow-moving average that helps identify the overall trend direction (commonly set to 55 periods).
Trading Signals:
Buy Signal: A long entry is triggered when:
The Short EMA (9) crosses above the Medium EMA (21).
The Medium EMA (21) is above the Long EMA (55).
Sell Signal: A short entry is signaled when:
The Short EMA (9) crosses below the Medium EMA (21).
The Medium EMA (21) is below the Long EMA (55).
Stop Loss and Take Profit:
Stop Loss: Implement a predefined percentage or ATR-based stop loss to limit potential losses.
Take Profit: Set a target based on a risk-to-reward ratio that reflects your trading strategy's goals.
Advantages
Trend Identification: The EMA crossover system allows traders to identify the current trend dynamically, focusing on upward or downward price movements.
Simplicity: The strategy is straightforward, making it accessible for both new and experienced traders.
Flexibility: This method can be applied across multiple timeframes and asset classes, making it versatile for various trading styles.
Disadvantages
Lagging Indicator: Moving averages are lagging indicators, meaning signals may come later than the actual price movement, which can lead to missed opportunities.
Whipsaw Effect: In ranging markets, the strategy may produce false signals leading to potential losses.

Moving Average Crossover MonitorMoving Average Crossover Monitor: Gain Insight into Market Trends
The Moving Average Crossover Monitor is a specialized tool crafted for traders seeking to understand and predict market trends more effectively. This indicator's primary focus lies in analyzing consecutive candle movements above or below specified moving averages and providing predictive estimates based on historical data.
Key Features:
1. Consecutive Candle Tracking: The indicator meticulously counts and tracks the number of consecutive candles that close above or below a selected moving average (MA1). This tracking offers a tangible measure of trend persistence over time.
2. Historical Analysis for Future Prediction: By analyzing past trends, the indicator provides insights into potential future movements. It estimates the likelihood of upcoming candles continuing above or below the moving average based on historical patterns.
3. Dynamic Visualization: Moving averages (SMA, WMA, EMA) are dynamically plotted on the chart, clearly displaying crossover points and trend transitions.
How It Works:
1. Moving Average Calculation: Select your preferred moving average type (SMA, WMA, EMA) and define short and long periods. The indicator computes two moving averages (MA1 and MA2) based on these parameters.
2. Consecutive Candle Analysis:
- Above MA1: Tracks and counts consecutive candles closing above MA1, indicating potential bullish momentum.
- Below MA1: Tracks and counts consecutive candles closing below MA1, suggesting potential bearish sentiment.
3. Future Trend Prediction: Based on historical data of consecutive candle movements, the indicator estimates the likelihood of the next candle continuing in the same direction (above or below MA1).
Advantages for Traders:
1. Quantitative Insights: Use numerical data on consecutive candles to gauge trend strength and durability.
2. Predictive Analytics: Leverage historical patterns to anticipate future market movements and adjust trading strategies accordingly.
3. Decision Support Tool: Gain clarity on trend transitions, empowering timely and informed trading decisions.
Disclaimer:
This indicator is provided for educational purposes only and should not be considered as financial advice. Trading involves risks, and past performance is not indicative of future results. Traders should conduct their own analysis and exercise caution when making trading decisions based on any indicator or tool. Always consider risk management strategies and consult with a qualified financial advisor if needed.

Simple Moving Average CrossoverThis Pine Script is a TradingView script for creating a technical analysis indicator known as a Simple Moving Average Crossover (SMAC). The script visualizes two moving averages on a chart and provides buy and sell signals based on the crossover of these moving averages.
Here's a breakdown of the script:
Input Parameters:
fastLength: The length of the fast/simple moving average.
slowLength: The length of the slow/simple moving average.
Moving Averages Calculation:
fastMA: Calculates the simple moving average with a length of fastLength using the closing prices.
slowMA: Calculates the simple moving average with a length of slowLength using the closing prices.
Plotting:
Plots the fast and slow moving averages on the chart using different colors.
Buy and Sell Signals:
buySignal: Generates a boolean series indicating a buy signal when the fast moving average crosses above the slow moving average.
sellSignal: Generates a boolean series indicating a sell signal when the fast moving average crosses below the slow moving average.
Plotting Signals:
Plots green triangle-up shapes below price bars for buy signals.
Plots red triangle-down shapes above price bars for sell signals.
In summary, this script helps traders visualize potential trend reversals by identifying points where a shorter-term moving average crosses above (buy signal) or below (sell signal) a longer-term moving average. These crossover signals are often used in trend-following strategies to capture potential changes in market direction. Traders can customize the script by adjusting the input parameters to suit their trading preferences.
Price Cross Time Custom Range Interactive█ OVERVIEW
This indicator was a time-based indicator and intended as educational purpose only based on pine script v5 functions for ta.cross() , ta.crossover() and ta.crossunder() .
I realised that there is some overlap price with the cross functions, hence I integrate them into Custom Range Interactive with value variance and overlap displayed into table.
This was my submission for Pinefest #1 , I decided to share this as public, I may accidentally delete this as long as i keep as private.
█ INSPIRATION
Inspired by design, code and usage of CAGR. Basic usage of custom range / interactive, pretty much explained here . Credits to TradingView.
█ FEATURES
1. Custom Range Interactive
2. Label can be resize and change color.
3. Label show tooltip for price and time.
4. Label can be offset to improve readability.
5. Table can show price variance when any cross is true.
6. Table can show overlap if found crosss is overlap either with crossover and crossunder.
7. Table text color automatically change based on chart background (light / dark mode).
8. Source 2 is drawn as straight line, while Source 1 will draw as label either above line for crossover, below line for crossunder and marked 'X' if crossing with Source 2's line.
9. Cross 'X' label can be offset to improve readability.
10. Both Source 1 and Source 2 can select Open, Close, High and Low, which can be displayed into table.
█ LIMITATIONS
1. Table is limited to intraday timeframe only as time format is not accurate for daily timeframe and above. Example daily timeframe will give result less 1 day from actual date.
2. I did not include other sources such external source or any built in sources such as hl2, hlc3, ohlc4 and hlcc4.
█ CODE EXPLAINATION
I pretty much create custom function with method which returns tuple value.
method crossVariant(float price = na, chart.point ref = na) =>
cross = ta.cross( price, ref.price)
over = ta.crossover( price, ref.price)
under = ta.crossunder(price, ref.price)
Unfortunately, I unable make the labels into array which i plan to return string value by getting the text value from array label, hence i use label.all and add incremental int value as reference.
series label labelCross = na, labelCross.delete()
var int num = 0
if over
num += 1
labelCross := label.new()
if under
num += 1
labelCross := label.new()
if cross
num += 1
labelCross := label.new()
I realised cross value can be overlap with crossover and crossunder, hence I add bool to enable force overlap and add additional bools.
series label labelCross = na, labelCross.delete()
var int num = 0
if forceOverlap
if over
num += 1
labelCross := label.new()
if under
num += 1
labelCross := label.new()
if cross
num += 1
labelCross := label.new()
else
if cross and over
num += 1
labelCross := label.new()
if cross and under
num += 1
labelCross := label.new()
if cross and not over and not under
num += 1
labelCross := label.new()
█ USAGE / EXAMPLES

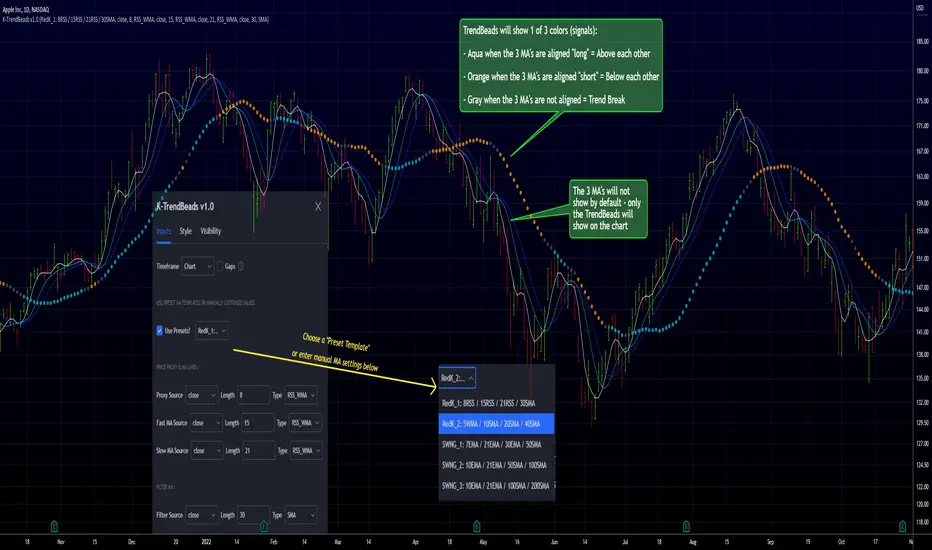
RedK TrendBeads: 3 x MA Crossover Signal with Preset TemplatesRedK TrendBeads is a super simple 3 x Moving Average Crossover Signal (Long/Short/Break) script that provides a simple and effective way for traders to identify potential trading opportunities. By combining three moving averages and only exposing a simple signal, the script helps filter out noise and focus on the trend and the trade execution.
Background
===========
A 3 x Moving Average Crossover strategy is a popular trading method in technical analysis . It uses the relationship between a fast, medium, and slow moving averages to generate buy or sell signals.
The approach usually utilizes three moving averages to track the average price of a financial instrument over different time periods. By comparing the fast, medium, and slow moving averages, we can generates a signal to trade long or short
If the fast moving average crosses above the medium moving average and the medium moving average is above the slow moving average, we have a probability of an up-trend forming, and we generate a signal to go long. Conversely, if the fast moving average crosses below the medium moving average and the medium moving average is below the slow moving average, we have a probability of a down-trend forming, and we generate a signal to go short. When the moving averages are not in the right order (above or below each other), we have a trend break, usually on consolidation or base forming.
in TrendBeads, the fastest MA is called "Price Proxy MA" and will be used with a relatively short length to represent the price itself - then there are the Fast MA, Slow MA and a Filter MA (usually with the longest/slowest length) which is the main line that will be used to plot the TrendBeads - So the TrendBeads will represent the state of the other 3 Moving Average lines (Proxy, Fast and Slow) and how they are aligned - and it will also be common to use the Filter / Beads line itself as a main filter, i.e., take long positions *only* when the price action is above the Filter MA, and short positions *only* when the price is below the Filter MA.
So what is different with TrendBeads:
=====================================
Simplicity, No Clutter: I put this together to provide a super simple mechanism to track trend on the price chart without so much noise as i also wanted to have other top-chart indicators (like LadderTrader) - so TrendBeads only shows the "beads" on the chart - they act like "traffic lights" with little distracting information - Simplicity here was deliberately part if the idea
Presets, What others are Watching: The other feature I needed was the ability to track price action against "different sets" of Moving Averages quickly - for example, when executing short-term trades, I needed to use Moving Averages with shorter length and want to utilize my RSS_WMA MA type - but when assessing big breakout opportunities, I need to analyze price action against a different set of MA's with (usually) longer length and mainly SMA's (hint, The Minervini template) - This is where the built-in Preset Templates become very useful.
Having these preset templates quickly available (thru the dropdown in indicator settings) provides time saving, convenience and the confidence that we're looking at what other traders are using in their analysis - so not missing out on key-level breakouts or reversals
TrendBeads v1.0 includes the following 5 preset MA templates
======================================================
Preset 1 : RedK_1: 8RSS / 15RSS / 21RSS / 30SMA
Preset 2 : RedK_2: 5WMA / 10SMA / 20SMA / 40SMA
Preset 3 : SWNG_1: 7EMA / 21EMA / 30EMA / 50SMA
Preset 4 : SWNG_2: 10EMA / 21EMA / 50SMA / 100SMA
Preset 5 : SWNG_3: 10EMA / 21EMA / 100SMA / 200SMA
The above presets represent some of the most common sets of MA's traders use in various scenarios (Short-term/day trading, Swing, Long term / growth). Well, except for the first one since it utilizes my own RSS_WMA :) which I use in many charts
I may add some more presets in future.
below chart shows an example of different presets against AAPL for the same time range / window
There's also the ability to manually set different MA source price, MA type and length for each of the 4 MA lines. Supported MA types are SMA , EMA , WMA , HMA and my RSS_WMA
TrendBeads Usage Tips:
=====================
*If you have used any MA crossover (2 lines or 3 lines) on your chart, your should find TradeBeads very easy to use. TrendBeads works the same way except that the signal will show as colored beads on the Filter MA line instead of showing multiple crossing lines .. and that is by design.
* Feel free to expose any or all of the individual MA lines - for example, i find that exposing the Proxy Line helps in quickly finding famous chart patterns ( cup & handle , H&S ..etc)
* Experiment with the different presets depending on the type of trade you're working on (swing, long term growth candidates, day trades..etc)
* Note that in a long trend up (Aqua Beads), usually the first gray + orange sequence will usually act as a "reversal sign" - and are usually not actionable - always look for the "second" color sequence to action/trade .. Same thing for a long trend down -- get used to how the beads change color against the trend changes and play with various timeframes.
* As usual - we should have other indicators that track strength, volume , etc and ensure proper confirmation before trade execution - A good signal is only a small part of a trade - risk management and good trade execution are key to winning.
Hope some fellow traders will find this useful - feel free to leave me any comments or feedback - Good luck!
Renko Stop and GoSimilar to crossover systems, this indicator uses the renko calculation of the brick open position instead of the slow average in a crossover system, it also generates a signal marker on the crossover of the price and renko lines, both can be smoothed in the optional parameters.
update version to V5 for this script:

Dynamic Fibonacci Pivot Points & EMA CrossoversI have created this script for those who face difficulties drawing Fibonacci levels as this script is Dynamic so it automatically calculates the ranges based on current High and Lows. I have also added Standard Fibonacci Pivot Points so that we can easily see the confluences between Dynamic and Standard pivot points. Apart from this I have also added EMA Crossovers so that we can easily identify trend changes. You can modify this script as per your own.

Hull MA TimeFrame CrossOverHello traders,
Although this strategy is configured on BTCUSDT , with a changing of settings, it can be used on any trading instrument.
Here it is seen, on the 2 hour chart. With Trading Fees included in result (adjust to suit your exchange fees).
The candle crossover is set to Daily timeframe.
That means that the Candle crossover is going to see if todays price is higher than yesterdays price.
If user sets this to 4 hour timeframe, the candle crossover would be when price is higher than the the price 4 hours ago...
The rest is simple, a moving average to detect direction, and an ATR StopLoss (if activated).
There is StopLoss and Take Profit settings which work by percentage.
The periods of the moving average and the ATR can be adjusted, as can the TP % and SL %.
The price is taken from the CLOSE or the OPEN or OHLC4 etc... which can be changed in the settings. OPEN is recommended to avoid repainting.
The moving average also has selectable types (ALMA,SMA,EMA,WMA,HMA)
So if the Price is above the Moving average, and the moving average is above the alternate timeframe value, then a buy is activated
if the Price is below the Moving average, and the moving average is below the alternate timeframe value, then a sell is activated
if OPEN is selected as Price source, then the alternate timeframe value would be the OPEN of the alternate timeframes candle.
the values are all plotted on chart so user can see what is happening when what crosses over what, and then what changes when settings are adjusted.
Have FuN!
if this strategy brings you the epik win......
.... dont forget about me
seaside420 ❤️

MACD Crossover Strategy with EMA200 Trend DetectionSimple MACD Strategy Indicator.
Rules:
- MACD Crossover with Signal Line
If
- MACD Crossover above zero line
- Price is below EMA200
=> Sell
If
- MACD Crossover below zero line (buy)
- Price is above EMA200
=> Buy