ETH Dynamic Risk Strategy# ETH Dynamic Risk Strategy - Publication Description
## Overview
The ETH Dynamic Risk Strategy is a systematic approach to accumulating Ethereum during bear markets and distributing during bull markets. It combines multiple risk indicators into a single composite metric (0-1 scale) that identifies optimal buying and selling zones based on market conditions.
## Key Features
• **Multi-Component Risk Metric**: Combines 4 weighted indicators to assess market conditions
• **Tiered Buy/Sell System**: 3 levels of buy signals (L1, L2, L3) and 3 levels of sell signals based on risk thresholds
• **Configurable Filters**: Optional buy filters to reduce signal frequency by 30-50%
• **Visual Risk Zones**: Color-coded risk metric plot with clear threshold lines
• **Comprehensive Dashboard**: Real-time statistics including position size, P/L, and component scores
## How It Works
### Risk Components (Configurable Weights)
1. **Log Return from ATH** (Default: 35%)
- Tracks drawdown from all-time high over lookback period
- Deep drawdowns (-70% to -90%) = low risk / buying opportunity
- Near ATH (0% to -20%) = high risk / selling opportunity
2. **ETH/BTC Ratio** (Default: 25%)
- Measures ETH strength relative to Bitcoin
- Below historical average = ETH undervalued = low risk
- Above historical average = ETH overvalued = high risk
3. **Volatility Regime** (Default: 20%)
- Compares current volatility to long-term average
- Compressed volatility at lows = opportunity
- Expanded volatility at highs = danger
4. **Trend Strength** (Default: 20%)
- Uses multiple EMA alignment and slope analysis
- Strong downtrends = low risk scores
- Strong uptrends = high risk scores
### Trading Logic
**Buy Signals:**
- L1: Risk ≤ 0.30 → Buy $100 (default)
- L2: Risk ≤ 0.20 → Buy $250 total
- L3: Risk ≤ 0.10 → Buy $450 total
**Sell Signals (Sequential):**
- L1: Risk ≥ 0.75 → Sell 25% of position
- L2: Risk ≥ 0.85 → Sell 35% of remaining
- L3: Risk ≥ 0.95 → Sell 40% of remaining
**Buy Filters (Optional):**
- Minimum days between buys (prevents clustering)
- Minimum risk drop required (ensures falling risk)
- Toggle on/off to compare performance
## Settings Guide
### Risk Components
Toggle individual components on/off and adjust their weights. Total weight is automatically normalized. Experiment with different combinations to match your market view.
### Advanced Settings
- ATH Lookback: How far back to look for all-time highs (500-2000 recommended)
- Volatility Period: Window for volatility calculations (40-100 recommended)
- ETH/BTC MA Period: Moving average for ratio comparison (100-300 recommended)
- Trend Period: Base period for trend calculations (50-150 recommended)
### Trading Thresholds
Customize buy/sell trigger points and position sizes. Lower buy thresholds = more aggressive accumulation. Higher sell thresholds = holding longer into bull markets.
### Buy Filters
- Enable/disable filtering system
- Min Days Between Buys: Spacing between purchases (1-3 recommended)
- Min Risk Drop: How much risk must fall (-0.001 to -0.01 range)
## Best Practices
• **Timeframe**: Works best on daily (1D) and 3-day (3D) charts
• **Initial Capital**: Set based on your DCA budget (default $10,000)
• **Backtest First**: Test different parameter combinations on historical data
• **Position Sizing**: Adjust buy amounts to match your risk tolerance
• **Monitor Filters**: Check "Filtered Buys" stat to ensure filter isn't too strict
## Use Cases
- Long-term ETH accumulation strategy
- Systematic DCA with market-adaptive buying
- Risk-based portfolio rebalancing
- Educational tool for understanding crypto market cycles
## Disclaimer
This strategy is for educational purposes only. Past performance does not guarantee future results. Cryptocurrency trading involves substantial risk. The strategy uses historical price action and technical indicators which may not predict future movements. Always do your own research and never invest more than you can afford to lose.
## Credits
Strategy concept and development by nakphanan with assistance from Claude AI (Anthropic). Built using Pine Script v5....Mostly from Claude AI!!!
## Version History
v7.0 - Initial release with 4-component risk metric, tiered trading system, and optional buy filters
Cerca negli script per "crypto"

Multiple Time Frame Stoch-RSIThis indicator is designed to show users the values for default stochastic RSI and default RSI settings across multiple time frames.
I have made many bad trades focusing too closely on one particular time frame and indicators that suggest the price will move one way, to be superseded by a higher timeframe pushing price in another direction.
The timeframes are customisable so you can select your own timeframes, but the default timeframes chosen here are part of the BareNaked Crypto or Naked Nation strategy, looking at timeframes in multiples of 3 for lower timeframes.
The idea in its simplest form is that when timeframes like the 3/6/9m are all over sold or over bought (coloured red or green) then it could be a suitable time to place an order. Or at least be more favourable for your trade.
This indicator as with all indicators is designed as a tool to add to whatever arsenal of strategy or tools you are already using and does not constitute financial advice, just be cause 3/6/9m is in red or green does not guarantee that the trade will go your way.
The orange on the timeframes are generally designed to show users where price can reverse so for example if the stochastic 3m is at 10 and in green, but the 9m is at 65 in orange, it could be that a push up is not finished and the 9m drop from oversold to 65 could be reversed due to a low 3m stochastic number and then 9m goes from 65 back up to 100, and vice versa.
The arrows for direction also allow you to quickly deduce the direction of the stochastic RSI, ^ up, V down, and stable -. this should allow you to see if the stochastic has been rising and is beginning to turn around or not.

Arbitrage Detector [LuxAlgo]The Arbitrage Detector unveils hidden spreads in the crypto and forex markets. It compares the same asset on the main crypto exchanges and forex brokers and displays both prices and volumes on a dashboard, as well as the maximum spread detected on a histogram divided by four user-selected percentiles. This allows traders to detect unusual, high, typical, or low spreads.
This highly customizable tool features automatic source selection (crypto or forex) based on the asset in the chart, as well as current and historical spread detection. It also features a dashboard with sortable columns and a historical histogram with percentiles and different smoothing options.
🔶 USAGE
Arbitrage is the practice of taking advantage of price differences for the same asset across different markets. Arbitrage traders look for these discrepancies to profit from buying where it’s cheaper and selling where it’s more expensive to capture the spread.
For begginers this tool is an easy way to understand how prices can vary between markets, helping you avoid trading at a disadvantage.
For advanced traders it is a fast tool to spot arbitrage opportunities or inefficiencies that can be exploited for profit.
Arbitrage opportunities are often short‑lived, but they can be highly profitable. By showing you where spreads exist, this tool helps traders:
Understand market inefficiencies
Avoid trading at unfavorable prices
Identify potential profit opportunities across exchanges
As we can see in the image, the tool consists of two main graphics: a dashboard on the main chart and a histogram in the pane below.
Both are useful for understanding the behavior of the same asset on different crypto exchanges or forex brokers.
The tool's main goal is to detect and categorize spread activity across the major crypto and forex sources. The comparison uses data from up to 19 crypto exchanges and 13 forex brokers.
🔹 Forex or Crypto
The tool selects the appropriate sources (crypto exchanges or forex brokers) based on the asset in the chart. Traders can choose which one to use.
The image shows the prices and volumes for Bitcoin and the euro across the main sources, sorted by descending average price over the last 20 days.
🔹 Dashboard
The dashboard displays a list of all sources with four main columns: last price, average price, volume, and total volume.
All four columns can be sorted in ascending or descending order, or left unsorted. A background gradient color is displayed for the sorted column.
Price and volume delta information between the chart asset and each exchange can be enabled or disabled from the settings panel.
🔹 Histogram
The histogram is excellent for visualizing historical values and comparing them with the asset price.
In this case, we have the Euro/U.S. Dollar daily chart. As we can see, the unusual spread activity detected since 2016, with values at or above 98%, is usually a good indication of increased trader activity, which may result in a key price area where the market could turn around.
By default, the histogram has the gradient and smoothing auto features enabled.
The differences are visible in the chart above. On top is an adaptive moving average with higher values for unusual activity. At the bottom is an exponential moving average with a length of 9.
The differences between the gradient and solid colors are evident. In the first case, the colors are in sync with the data values, becoming more yellow with higher values and more green with lower values. In the second case, the colors are solid and only distinguish data above or below the defined percentiles.
🔶 SETTINGS
Sources: Choose between crypto exchanges, forex brokers, or automatic selection based on the asset in the chart.
Average Length: Select the length for the price and volume averages.
🔹 Percentiles
Percentile Length: Select the length for the percentile calculation, or enable the use of the full dataset. Enabling this option may result in runtime errors due to exceeding the allotted resources.
Unusual % >: Select the unusual percentile.
High % >: Select the high percentile.
Typical % >: Select the typical percentile.
🔹 Dashboard
Dashboard: Enable or disable the dashboard.
Sorting: Select the sorting column and direction.
Position: Select the dashboard location.
Size: Select the dashboard size.
Price Delta: Show the price difference between each exchange and the asset on the chart.
Volume Delta: Show the volume difference between each exchange and the asset on the chart.
🔹 Style
Unusual: Enable the plot of the unusual percentile and select its color.
High: Enable the plot of the high percentile and select its color.
Typical: Enable the plot of the typical percentile and select its color.
Low: Select the color for the low percentile.
Percentiles Auto Color: Enable auto color for all plotted percentiles.
Histogram Gradient: Enable the gradient color for the histogram.
Histogram Smoothing: Select the length of the EMA smoothing for the histogram or enable the Auto feature. The Auto feature uses an adaptive moving average with the data percent rank as the efficiency ratio.

Mutanabby_AI | ONEUSDT_MR1
ONEUSDT Mean-Reversion Strategy | 74.68% Win Rate | 417% Net Profit
This is a long-only mean-reversion strategy designed specifically for ONEUSDT on the 1-hour timeframe. The core logic identifies oversold conditions following sharp declines and enters positions when selling pressure exhausts, capturing the subsequent recovery bounce.
Backtested Period: June 2019 – December 2025 (~6 years)
Performance Summary
| Metric | Value |
|--------|-------|
| Net Profit | +417.68% |
| Win Rate | 74.68% |
| Profit Factor | 4.019 |
| Total Trades | 237 |
| Sharpe Ratio | 0.364 |
| Sortino Ratio | 1.917 |
| Max Drawdown | 51.08% |
| Avg Win | +3.14% |
| Avg Loss | -2.30% |
| Buy & Hold Return | -80.44% |
Strategy Logic :
Entry Conditions (Long Only):
The strategy seeks confluence of three conditions that identify exhausted selling:
1. Prior Move Filter:*The price change from 5 bars ago to 3 bars ago must be ≥ -7% (ensures we're not entering during freefall)
2. Current Move Filter: The price change over the last 2 bars must be ≤ 0% (confirms momentum is stalling or reversing)
3. Three-Bar Decline: The price change from 5 bars ago to 3 bars ago must be ≤ -5% (confirms a significant recent drop occurred)
When all three conditions align, the strategy identifies a potential reversal point where sellers are exhausted.
Exit Conditions:
- Primary Exit: Close above the previous bar's high while the open of the previous bar is at or below the close from 9 bars ago (profit-taking on strength)
- Trailing Stop: 11x ATR trailing stop that locks in profits as price rises
Risk Management
- Position Sizing:Fixed position based on account equity divided by entry price
- Trailing Stop:11× ATR (14-period) provides wide enough room for crypto volatility while protecting gains
- Pyramiding:Up to 4 orders allowed (can scale into winning positions)
- **Commission:** 0.1% per trade (realistic exchange fees included)
Important Disclaimers
⚠️ This is NOT financial advice.
- Past performance does not guarantee future results
- Backtest results may contain look-ahead bias or curve-fitting
- Real trading involves slippage, liquidity issues, and execution delays
- This strategy is optimized for ONEUSDT specifically — results may differ on other pairs
- Always test before risking real capital
Recommended Usage
- Timeframe:*1H (as designed)
- Pair: ONEUSDT (Binance)
- Account Size: Ensure sufficient capital to survive max drawdown
Source Code
Feedback Welcome
I'm sharing this strategy freely for educational purposes. Please:
- Drop a comment with your backtesting results any you analysis
- Share any modifications that improve performance
- Let me know if you spot any issues in the logic
Happy trading
As a quant trader, do you think this strategy will survive in live trading?
Yes or No? And why?
I want to hear from you guys

Volume Threshold Levels - Crypto LidyaVolume Threshold Levels – Crypto Lidya
Understanding volume behavior is one of the most effective ways to detect trend changes, manipulation candles, aggressive entries, and institutional activity.
Volume Threshold Levels (VTL) not only displays raw volume but also calculates dynamic volume thresholds (2x – 3x – 4x) based on the moving average, allowing you to identify statistically meaningful volume anomalies with precision.
📌 1. Volume Columns
The indicator plots each bar’s volume using traditional column-style visualization.
Green: Bullish candle
Red: Bearish candle
Gray: Neutral candle
This helps traders clearly understand the relationship between price and volume.
📌 2. Average Volume Area
VTL offers two types of moving averages for volume:
SMA (Simple Moving Average)
EMA (Exponential Moving Average)
The average volume is drawn as a soft yellow area across the chart.
This area acts as the baseline for normal volume levels.
📌 3. Dynamic Threshold Lines (2x / 3x / 4x)
The script calculates and displays multipliers of the average volume:
2x Average
3x Average
4x Average
These levels appear as bright yellow lines.
They are extremely useful for identifying breakouts, traps, and aggressive institutional entries.
📌 4. Volume Spike Detection (Alerts)
VTL identifies upward crossovers where volume breaks above key levels:
1x Volume Signal
2x Volume Signal
3x Volume Signal
4x Volume Signal
These can be used directly as TradingView alerts.
This allows you to automate detection of high-impact volume spikes.
📌 5. Use Cases
The indicator performs exceptionally well in:
Breakout confirmation
Liquidity sweep analysis
Detecting manipulation candles
Combining with OB, FVG, or other SMC structures
Scalping and low-timeframe aggressive volume interpretation
Algorithmic filters for volume-based strategies
📌 6. Summary
VTL delivers:
✔ Dynamic average volume baseline
✔ Clear 2x–3x–4x volume thresholds
✔ Accurate detection of upside volume explosions
✔ A strong tool for traders who rely on volume confirmation
Completely open-source and ready to be extended.

Dumb Money Flow - Retail Panic & FOMO# Dumb Money Flow (DMF) - Retail Panic & FOMO
## 🌊 Overview
**Dumb Money Flow (DMF)** is a powerful **contrarian indicator** designed to track the emotional state of the retail "herd." It identifies moments of extreme **Panic** (irrational selling) and **FOMO** (irrational buying) by analyzing on-chain data, volume anomalies, and price velocity.
In crypto markets, retail traders often buy the top (FOMO) and sell the bottom (Panic). This indicator helps you do the opposite: **Buy when the herd is fearful, and Sell when the herd is greedy.**
---
## 🧠 How It Works
The indicator combines multiple data points into a single **Sentiment Index** (0-100), normalized over a 90-day period to ensure it always uses the full range of the chart.
### 1. Panic Index (Bearish Sentiment)
Tracks signs of capitulation and fear. High values contribute to the **Panic Zone**.
* **Exchange Inflows:** Spikes in funds moving to exchanges (preparing to sell).
* **Volume Spikes:** High volume during price drops (panic selling).
* **Price Crash (ROC):** Rapid, emotional price drops over 3 days.
* **Volatility (ATR):** High market nervousness and instability.
### 2. FOMO Index (Bullish Sentiment)
Tracks signs of euphoria and greed. High values contribute to the **FOMO Zone**.
* **Exchange Outflows:** Funds moving to cold storage (HODLing/Greed).
* **Profitable Addresses:** When >90% of holders are in profit, tops often form.
* **Parabolic Rise:** Rapid, unsustainable price increases.
---
## 🎨 Visual Guide
The indicator uses a distinct color scheme to highlight extremes:
* **🟢 Dark Green Zone (> 80): Extreme FOMO**
* **Meaning:** The crowd is euphoric. Risk of a correction is high.
* **Action:** Consider taking profits or looking for short entries.
* **🔴 Dark Burgundy Zone (< 20): Extreme Panic**
* **Meaning:** The crowd is capitulating. Prices may be oversold.
* **Action:** Look for buying opportunities (catching the knife with confirmation).
* **🔵 Light Blue Line:**
* The smoothed moving average of the sentiment, helpful for seeing the trend direction.
---
## 🛠️ How to Use (Trading Strategies)
### 1. Contrarian Reversals (The Primary Strategy)
* **Buy Signal:** Wait for the line to drop deep into the **Burgundy Panic Zone (< 20)** and then start curling up. This indicates that the worst of the selling pressure is over.
* **Sell Signal:** Wait for the line to spike into the **Green FOMO Zone (> 80)** and then start curling down. This suggests buying exhaustion.
### 2. Divergences
* **Bullish Divergence:** Price makes a **Lower Low**, but the DMF Indicator makes a **Higher Low** (less panic on the second drop). This is a strong reversal signal.
* **Bearish Divergence:** Price makes a **Higher High**, but the DMF Indicator makes a **Lower High** (less FOMO/buying power on the second peak).
### 3. Trend Confirmation (Midline Cross)
* **Crossing 50 Up:** Sentiment is shifting from Fear to Greed (Bullish).
* **Crossing 50 Down:** Sentiment is shifting from Greed to Fear (Bearish).
---
## ⚙️ Settings
* **Data Source:** Defaults to `INTOTHEBLOCK` for on-chain data.
* **Crypto Asset:** Auto-detects BTC/ETH, but can be forced.
* **Normalization Period:** Default 90 days. Determines the "window" for defining what is considered "Extreme" relative to recent history.
* **Weights:** You can customize how much each factor (Volume, Inflows, Price) contributes to the index.
---
**Disclaimer:** This indicator is for educational purposes only. "Dumb Money" analysis is a probability tool, not a crystal ball. Always manage your risk.
**Indicator by:** @iCD_creator
**Version:** 1.0
**Pine Script™ Version:** 6
---
## Updates & Support
For questions, suggestions, or bug reports, please comment below or message the author.
**Like this indicator? Leave a 👍 and share your feedback!**

Smart Money Flow - Exchange & TVL Composite# Smart Money Flow - Exchange & TVL Composite Indicator
## Overview
The **Smart Money Flow (SMF)** indicator combines two powerful on-chain metrics - **Exchange Flows** and **Total Value Locked (TVL)** - to create a composite index that tracks institutional and "smart money" movement in the cryptocurrency market. This indicator helps traders identify accumulation and distribution phases by analyzing where capital is flowing.
## What It Does
This indicator normalizes and combines:
- **Exchange Net Flow** (from IntoTheBlock): Tracks Bitcoin/Ethereum movement to and from exchanges
- **Total Value Locked** (from DefiLlama): Measures capital locked in DeFi protocols
The composite index is displayed on a 0-100 scale with clear zones for overbought/oversold conditions.
## Core Concept
### Exchange Flows
- **Negative Flow (Outflows)** = Bullish Signal
- Coins moving OFF exchanges → Long-term holding/accumulation
- Indicates reduced selling pressure
- **Positive Flow (Inflows)** = Bearish Signal
- Coins moving TO exchanges → Preparation for selling
- Indicates potential distribution phase
### Total Value Locked (TVL)
- **Rising TVL** = Bullish Signal
- Capital flowing into DeFi protocols
- Increased ecosystem confidence
- **Falling TVL** = Bearish Signal
- Capital exiting DeFi protocols
- Decreased ecosystem confidence
### Combined Signals
**🟢 Strong Bullish (70-100):**
- Exchange outflows + Rising TVL
- Smart money accumulating and deploying capital
**🔴 Strong Bearish (0-30):**
- Exchange inflows + Falling TVL
- Smart money preparing to sell and exiting positions
**⚪ Neutral (40-60):**
- Mixed or balanced flows
## Key Features
### ✅ Auto-Detection
- Automatically detects chart symbol (BTC/ETH)
- Uses appropriate exchange flow data for each asset
### ✅ Weighted Composite
- Customizable weights for Exchange Flow and TVL components
- Default: 50/50 balance
### ✅ Normalized Scale
- 0-100 index scale
- Configurable lookback period for normalization (default: 90 days)
### ✅ Signal Zones
- **Overbought**: 70+ (Strong bullish pressure)
- **Oversold**: 30- (Strong bearish pressure)
- **Extreme**: 85+ / 15- (Very strong signals)
### ✅ Clean Interface
- Minimal visual clutter by default
- Only main index line and MA visible
- Optional elements can be enabled:
- Background color zones
- Divergence signals
- Trend change markers
- Info table with detailed metrics
### ✅ Divergence Detection
- Identifies when price diverges from smart money flows
- Potential reversal warning signals
### ✅ Alerts
- Extreme overbought/oversold conditions
- Trend changes (crossing 50 line)
- Bullish/bearish divergences
## How to Use
### 1. Trend Confirmation
- Index above 50 = Bullish trend
- Index below 50 = Bearish trend
- Use with price action for confirmation
### 2. Reversal Signals
- **Extreme readings** (>85 or <15) suggest potential reversal
- Look for divergences between price and indicator
### 3. Accumulation/Distribution
- **70+**: Accumulation phase - smart money buying/holding
- **30-**: Distribution phase - smart money selling
### 4. DeFi Health
- Monitor TVL component for DeFi ecosystem strength
- Combine with exchange flows for complete picture
## Settings
### Data Sources
- **Exchange Flow**: IntoTheBlock real-time data
- **TVL**: DefiLlama aggregated DeFi TVL
- **Manual Mode**: For testing or custom data
### Indicator Settings
- **Smoothing Period (MA)**: Default 14 periods
- **Normalization Lookback**: Default 90 days
- **Exchange Flow Weight**: Adjustable 0-100%
- **Overbought/Oversold Levels**: Customizable thresholds
### Visual Options
- Show/Hide Moving Average
- Show/Hide Zone Lines
- Show/Hide Background Colors
- Show/Hide Divergence Signals
- Show/Hide Trend Markers
- Show/Hide Info Table
## Data Requirements
⚠️ **Important Notes:**
- Uses **daily data** from IntoTheBlock and DefiLlama
- Works on any chart timeframe (data updates daily)
- Auto-switches between BTC and ETH based on chart
- All other crypto charts default to BTC exchange flow data
## Best Practices
1. **Use on Daily+ Timeframes**
- On-chain data is daily, most effective on D/W/M charts
2. **Combine with Price Action**
- Use as confirmation, not standalone signals
3. **Watch for Divergences**
- Price making new highs while indicator falling = warning
4. **Monitor Extreme Zones**
- Sustained readings >85 or <15 indicate strong conviction
5. **Context Matters**
- Consider broader market conditions and fundamentals
## Calculation
1. **Exchange Net Flow** = Inflows - Outflows (inverted for index)
2. **TVL Rate of Change** = % change over smoothing period
3. **Normalize** both metrics to 0-100 scale
4. **Composite Index** = (ExchangeFlow × Weight) + (TVL × Weight)
5. **Smooth** with moving average
## Disclaimer
This indicator uses on-chain data for analysis. While valuable, it should not be used as the sole basis for trading decisions. Always combine with other technical analysis tools, fundamental analysis, and proper risk management.
On-chain data reflects blockchain activity but may lag price action. Use this indicator as part of a comprehensive trading strategy.
---
## Credits
**Data Sources:**
- IntoTheBlock: Exchange flow metrics
- DefiLlama: Total Value Locked data
**Indicator by:** @iCD_creator
**Version:** 1.0
**Pine Script™ Version:** 6
---
## Updates & Support
For questions, suggestions, or bug reports, please comment below or message the author.
**Like this indicator? Leave a 👍 and share your feedback!**

Ichimoku Cloud (Auto Crypto/Non-Crypto settings)Save the hassle of switching back and forth between crypto and non-crypto settings by using the `syminfo.type` value under the hood.
If it's crypto it uses the 20, 60, 120, 30 settings, otherwise it uses 18, 52, 104, 26 defaults.
You can always override it using the Market Mode input in the settings.
The settings type is displayed in the top right of the chart as either "Crypto Cloud" or "Legacy Cloud" so you know which settings are being applied.

[CASH] Crypto And Stocks Helper (MultiPack w. Alerts)ATTENTION! I'm not a good scripter. I have just learned a little basics for this project, stolen code from other public scripts and modified it, and gotten help from AI LLM's.
If you want recognition from stolen code please tell me to give you the credit you deserve.
The script is not completely finished yet and contains alot of errors but my friends and family wants access so I made it public.
_________________________________________________________________________________
CASH has multiple indicators (a true all-in-one multipack), guides and alerts to help you make better trades/investments. It has:
- Bitcoin Bull Market Support Band
- Dollar Volume
- 5 SMA and 5 EMA
- HODL Trend (a.k.a SuperTrend) indicator
- RSI, Volume and Divergence indicators w. alerts
More to come as well, like Backburner and a POC line from Volume Profile.
Everything is fully customizable, appearance and off/on etc.
More information and explainations along with my guides you can find in settings under "Input" and "Style".

Hidden Zone Detector AI - Crypto/Forex/StockHidden Zone Detector AI - Crypto Forex Stock
Hidden Zone Detector AI is a professional TradingView indicator designed to find hidden supply and demand zones across markets — crypto, forex and stocks — and surface high-probability areas earlier than classical pivot-only methods. It combines price structure analysis, volatility/ATR sizing, volume profiling and multi-mode AI heuristics (Fast / Balanced / Accurate) to generate prediction zones, highlight tested areas, and visually mark zone breakouts. Built with practical trader workflow in mind: configurable anti-repaint options, adaptable Light/Dark UI, clear labels, and candle-coloring for immediate visual context.
How it works
• Detects hidden zones by scanning pivot formations and finding internal “hidden” bars that represent real institutional activity (not just visible swing points).
• Scores zones by size (ATR-relative), volume, and touch characteristics to produce a strength percentage (Weak/Medium/Strong).
• AI heuristics aggregate price, momentum, moving averages, RSI/MACD signals and volume patterns to propose prediction zones — adjustable for speed vs. accuracy.
• Zones are drawn as persistent boxes with optional midlines, labels, and tailored styling when broken or tested.
Main advantages
• Early edge: finds hidden zones that often act before obvious pivots.
• Actionable visuals: labeled zones, color-coded candles, and breakout styling speed decision-making.
• Flexible AI modes: choose Fast for responsiveness, Balanced for day-to-day use, or Accurate for stricter signals.
• Anti-repaint controls: require confirmed bars for predictions to improve signal reliability.
• Multi-market ready: tuned for crypto, forex and stock chart behavior.
• Light/Dark friendly: UI color handling ensures labels remain readable on any chart background.
• Open & reusable: released under Mozilla Public License 2.0 (MPL-2.0) — use and adapt freely with attribution.
Best practices & tips
• Start with Balanced mode and sensitivity ~5; increase sensitivity for earlier but noisier predictions.
• Use prediction confirmation (Require AI Prediction Confirmation) for lower repaint risk.
• Combine zone reads with higher-timeframe context and orderflow/volume tools for stronger entries.
• Adjust max active zones and opacity to keep charts clean on lower timeframes.
License & author
Mozilla Public License 2.0 (MPL-2.0).
Author: a_jabbaroff — created with care for the TradingView community and fellow traders.

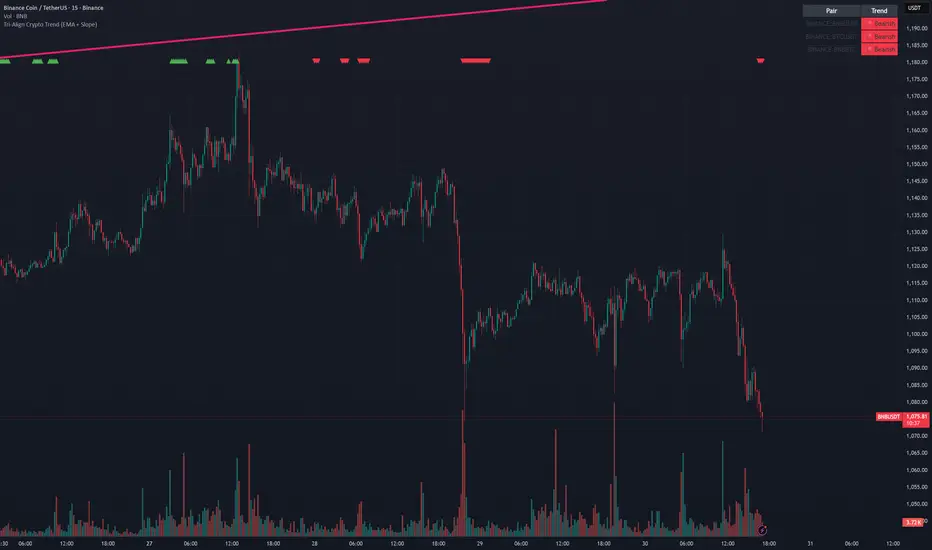
Tri-Align Crypto Trend (EMA + Slope)**Tri-Align Crypto Trend (EMA + Slope)**
Quickly see whether your coin is trending *with* Bitcoin. The indicator evaluates three pairs—**COIN/USDT**, **BTC/USDT**, and **COIN/BTC**—using a fast/slow EMA crossover plus the fast EMA’s slope. Each pair is tagged **Bullish / Bearish / Neutral** in a compact, color-coded table. Alerts fire when **all three** trends align (all bullish or all bearish).
**How to use**
1. Add the indicator to any crypto chart.
2. Set the three symbols (defaults: BNB/USDT, BTC/USDT, BNB/BTC) and optionally choose a signal timeframe.
3. Tune **Fast EMA**, **Slow EMA**, **Slope Lookback**, and **Min |Slope| %** to filter noise and require stronger momentum.
4. Create alerts: *Add alert →* choose the indicator and select **All Three Bullish**, **All Three Bearish**, or **All Three Aligned**.
**Logic**
* Bullish: `EMA_fast > EMA_slow` **and** fast EMA slope ≥ threshold
* Bearish: `EMA_fast < EMA_slow` **and** fast EMA slope ≤ −threshold
* Otherwise: Neutral
Tip: The **COIN/BTC** row reflects relative strength vs BTC—use it to avoid chasing coins that lag the benchmark. (For educational purposes; not financial advice.)
CHAN CRYPTO RS🩷 ATR RS (Crypto / High-based 2.1x, Decimal Safe v2)
This indicator is designed for crypto position sizing and stop calculation using ATR-based risk management. It helps traders automatically determine the stop price, per-unit risk, and optimal position size based on a fixed risk amount in USDT.
🔧 Core Logic
ATR Length (Daily RMA) — calculates the daily Average True Range (ATR) using RMA smoothing.
ATR Multiplier (2.1× default) — defines how far the stop is placed from the daily high.
Stop Price (for Longs) = Daily High − ATR × Multiplier
Per-Unit Risk = (Entry − Stop) × Point Value
Position Size = Risk Amount ÷ Per-Unit Risk
Automatically handles decimal precision for micro-priced crypto assets (e.g., PEPE, SHIB).
Includes safeguards for minimum size and maximum position caps.
💡 Features
Uses Daily ATR without lookahead (no repainting).
Dynamically switches between current and previous ATR for stable results when the daily bar isn’t yet confirmed.
“Snap to tick” ensures stop prices align with the symbol’s tick size.
Table display summarizes ATR, stop price, per-unit risk, total risk, size, and bet amount.
Optional stop label on the chart for visual clarity.
🧮 Output Table
Metric Description
ATR(10) Daily RMA-based ATR
ATR used Chosen ATR (current or previous)
Stop Calculated stop price
Per-unit Risk per coin/unit
Risk Total risk in USDT
Size Optimal position size
Bet Total position value (Entry × Size)
🧠 Ideal For
Crypto traders who use fixed-risk ATR strategies and need precise, decimal-safe position sizing even for ultra-low-priced tokens.

QZ Trend (Crypto Edition) v1.1a: Donchian, EMA, ATR, Liquidity/FThe "QZ Trend (Crypto Edition)" is a rules-based trend-following breakout strategy for crypto spot or perpetual contracts, focusing on following trends, prioritizing risk control, seeking small losses and big wins, and trading only when advantageous.
Key mechanisms include:
- Market filters: Screen favorable conditions via ADX (trend strength), dollar volume (liquidity), funding fee windows, session/weekend restrictions, and spot-long-only settings.
- Signals & entries: Based on price position relative to EMA and EMA trends, combined with breaking Donchian channel extremes (with ATR ratio confirmation), plus single-position rules and post-exit cooldowns.
- Position sizing: Calculate positions by fixed risk percentage; initial stop-loss is ATR-based, complying with exchange min/max lot requirements.
- Exits & risk management: Include initial stop-loss, trailing stop (tightens only), break-even rule (stop moves to entry when target floating profit is hit), time-based exit, and post-exit cooldowns.
- Pyramiding: Add positions only when profitable with favorable momentum, requiring ATR-based spacing; add size is a fraction of the base position, with layers sharing stop logic but having unique order IDs.
Charts display EMA, Donchian channels, current stop lines, and highlight low ADX, avoidable funding windows, and low-liquidity periods.
Recommend starting with 4H or 1D timeframes, with typical parameters varying by cycle. Liquidity settings differ by token; perpetuals should enable funding window filters, while spot requires "long-only" and matching fees. The strategy performs well in trends with quick stop-losses but faces whipsaws in ranges (filters mitigate but don’t eliminate noise). Share your symbol and timeframe for tailored parameters.

Hilly 2.0 Advanced Crypto Scalping Strategy - 1 & 5 Min ChartsHow to Use
Copy the Code: Copy the script above.
Paste in TradingView: Open TradingView, go to the Pine Editor (bottom of the chart), paste the code, and click “Add to Chart.”
Check for Errors: Verify no errors appear in the Pine Editor console. The script uses Pine Script v5 (@version=5).
Select Timeframe:
1-Minute Chart: Use defaults (emaFastLen=7, emaSlowLen=14, rsiLen=10, rsiOverbought=80, rsiOversold=20, slPerc=0.5, tpPerc=1.0, useCandlePatterns=false).
5-Minute Chart: Adjust to emaFastLen=9, emaSlowLen=21, rsiLen=14, rsiOverbought=75, rsiOversold=25, slPerc=0.8, tpPerc=1.5, useCandlePatterns=true.
Apply to Chart: Use a liquid crypto pair (e.g., BTC/USDT, ETH/USDT on Binance or Coinbase).
Verify Signals:
Green “BUY” or “EMA BUY” labels and triangle-up arrows below candles.
Red “SELL” or “EMA SELL” labels and triangle-down arrows above candles.
Green/red background highlights for signal candles.
Arrows use size.normal for consistent visibility.
Backtest: Use TradingView’s Strategy Tester to evaluate performance over 1–3 months, checking Net Profit, Win Rate, and Drawdown.
Demo Test: Run on a demo account to confirm signal visibility and performance before trading with real funds.

Intrabar Volume Delta — RealTime + History (Stocks/Crypto/Forex)Intrabar Volume Delta Grid — RealTime + History (Stocks/Crypto/Forex)
# Short Description
Shows intrabar Up/Down volume, Delta (absolute/relative) and UpShare% in a compact grid for both real-time and historical bars. Includes an MTF (M1…D1) dashboard, contextual coloring, density controls, and alerts on Δ and UpShare%. Smart historical splitting (“History Mode”) for Crypto/Futures/FX.
---
# What it does (Quick)
* **UpVol / DownVol / Δ / UpShare%** — visualizes order-flow inside each candle.
* **Real-time** — accumulates intrabar volume live by tick-direction.
* **History Mode** — splits Up/Down on closed bars via simple or range-aware logic.
* **MTF Dashboard** — one table view across M1, M5, M15, M30, H1, H4, D1 (Vol, Up/Down, Δ%, Share, Trend).
* **Contextual opacity** — stronger signals appear bolder.
* **Label density** — draw every N-th bar and limit to last X bars for performance.
* **Alerts** — thresholds for |Δ|, Δ%, and UpShare%.
---
# How it works (Real-Time vs History)
* **Real-time (open bar):** volume increments into **UpVolRT** or **DownVolRT** depending on last price move (↑ goes to Up, ↓ to Down). This approximates live order-flow even when full tick history isn’t available.
* **History (closed bars):**
* **None** — no split (Up/Down = 0/0). Safest for equities/indices with unreliable tick history.
* **Approx (Close vs Open)** — all volume goes to candle direction (green → Up 100%, red → Down 100%). Fast but yields many 0/100% bars.
* **Price Action Based** — splits by Close position within High-Low range; strength = |Close−mid|/(High−Low). Above mid → more Up; below mid → more Down. Falls back to direction if High==Low.
* **Auto** — **Stocks/Index → None**, **Crypto/Futures/FX → Approx**. If you see too many 0/100 bars, switch to **Price Action Based**.
---
# Rows & Meaning
* **Volume** — total bar volume (no split).
* **UpVol / DownVol** — directional intrabar volume.
* **Delta (Δ)** — UpVol − DownVol.
* **Absolute**: raw units
* **Relative (Δ%)**: Δ / (Up+Down) × 100
* **Both**: shows both formats
* **UpShare%** — UpVol / (Up+Down) × 100. >50% bullish, <50% bearish.
* Helpful icons: ▲ (>65%), ▼ (<35%).
---
# MTF Dashboard (🔧 Enable Dashboard)
A single table with **Vol, Up, Down, Δ%, Share, Trend (🔼/🔽/⏭️)** for selected timeframes (M1…D1). Great for a fast “panorama” read of flow alignment across horizons.
---
# Inputs (Grouped)
## Display
* Toggle rows: **Volume / Up / Down / Delta / UpShare**
* **Delta Display**: Absolute / Relative / Both
## Realtime & History
* **History Mode**: Auto / None / Approx / Price Action Based
* **Compact Numbers**: 1.2k, 1.25M, 3.4B…
## Theme & UI
* **Theme Mode**: Auto / Light / Dark
* **Row Spacing**: vertical spacing between rows
* **Top Row Y**: moves the whole grid vertically
* **Draw Guide Lines**: faint dotted guides
* **Text Size**: Tiny / Small / Normal / Large
## 🔧 Dashboard Settings
* **Enable Dashboard**
* **📏 Table Text Size**: Tiny…Huge
* **🦓 Zebra Rows**
* **🔲 Table Border**
## ⏰ Timeframes (for Dashboard)
* **M1…D1** toggles
## Contextual Coloring
* **Enable Contextual Coloring**: opacity by signal strength
* **Δ% cap / Share offset cap**: saturation caps
* **Min/Max transparency**: solid vs faint extremes
## Label Density & Size
* **Show every N-th bar**: draw labels only every Nth bar
* **Limit to last X bars**: keep labels only in the most recent X bars
## Colors
* Up / Down / Text / Guide
## Alerts
* **Delta Threshold (abs)** — |Δ| in volume units
* **UpShare > / <** — bullish/bearish thresholds
* **Enable Δ% Alert**, **Δ% > +**, **Δ% < −** — relative delta levels
---
# How to use (Quick Start)
1. Add the indicator to your chart (overlay=false → separate pane).
2. **History Mode**:
* Crypto/Futures/FX → keep **Auto** or switch to **Price Action Based** for richer history.
* Stocks/Index → prefer **None** or **Price Action Based** for safer splits.
3. **Label Density**: start with **Limit to last X bars = 30–150** and **Show every N-th bar = 2–4**.
4. **Contextual Coloring**: keep on to emphasize strong Δ% / Share moves.
5. **Dashboard**: enable and pick only the TFs you actually use.
6. **Alerts**: set thresholds (ideas below).
---
# Alerts (in TradingView)
Add alert → pick this indicator → choose any of:
* **Delta exceeds threshold** (|Δ| > X)
* **UpShare above threshold** (UpShare% > X)
* **UpShare below threshold** (UpShare% < X)
* **Relative Delta above +X%**
* **Relative Delta below −X%**
**Starter thresholds (tune per symbol & TF):**
* **Crypto M1/M5**: Δ% > +25…35 (bullish), Δ% < −25…−35 (bearish)
* **FX (tick volume)**: UpShare > 60–65% or < 40–35%
* **Stocks (liquid)**: set **Absolute Δ** by typical volume scale (e.g., 50k / 100k / 500k)
---
# Notes by Market Type
* **Crypto/Futures**: 24/7 and high liquidity — **Price Action Based** often gives nicer history splits than Approx.
* **Forex (FX)**: TradingView volume is typically **tick volume** (not true exchange volume). Treat Δ/Share as tick-based flow, still very useful intraday.
* **Stocks/Index**: historical tick detail can be limited. **None** or **Price Action Based** is a safer default. If you see too many 0/100% shares, switch away from Approx.
---
# “All Timeframes” accuracy
* Works on **any TF** (M1 → D1/W1).
* **Real-time accuracy** is strong for the open bar (live accumulation).
* **Historical accuracy** depends on your **History Mode** (None = safest, Approx = fastest/simplest, Price Action Based = more nuanced).
* The MTF dashboard uses `request.security` and therefore follows the same logic per TF.
---
# Trade Ideas (Use-Cases)
* **Scalping (M1–M5)**: a spike in Δ% + UpShare>65% + rising total Vol → momentum entries.
* **Intraday (M5–M30–H1)**: when multiple TFs show aligned Δ%/Share (e.g., M5 & M15 bullish), join the trend.
* **Swing (H4–D1)**: persistent Δ% > 0 and UpShare > 55–60% → structural accumulation bias.
---
# Advantages
* **True-feeling live flow** on the open bar.
* **Adaptable history** (three modes) to match data quality.
* **Clean visual layout** with guides, compact numbers, contextual opacity.
* **MTF snapshot** for quick bias read.
* **Performance controls** (last X bars, every N-th bar).
---
# Limitations & Care
* **FX uses tick volume** — interpret Δ/Share accordingly.
* **History Mode is an approximation** — confirm with trend/structure/liquidity context.
* **Illiquid symbols** can produce noisy or contradictory signals.
* **Too many labels** can slow charts → raise N, lower X, or disable guides.
---
# Best Practices (Checklist)
* Crypto/Futures: prefer **Price Action Based** for history.
* Stocks: **None** or **Price Action Based**; be cautious with **Approx**.
* FX: pair Δ% & UpShare% with session context (London/NY) and volatility.
* If labels overlap: tweak **Row Spacing** and **Text Size**.
* In the dashboard, keep only the TFs you actually act on.
* Alerts: start around **Δ% 25–35** for “punchy” moves, then refine per asset.
---
# FAQ
**1) Why do some closed bars show 0%/100% UpShare?**
You’re on **Approx** history mode. Switch to **Price Action Based** for smoother splits.
**2) Δ% looks strong but price doesn’t move — why?**
Δ% is an **order-flow** measure. Price also depends on liquidity pockets, sessions, news, higher-timeframe structure. Use confirmations.
**3) Performance slowdown — what to do?**
Lower **Limit to last X bars** (e.g., 30–100), increase **Show every N-th bar** (2–6), or disable **Draw Guide Lines**.
**4) Dashboard values don’t “match” the grid exactly?**
Dashboard is multi-TF via `request.security` and follows the history logic per TF. Differences are normal.
---
# Short “Store” Marketing Blurb
Intrabar Volume Delta Grid reveals the order-flow inside every candle (Up/Down, Δ, UpShare%) — live and on history. With smart history splitting, an MTF dashboard, contextual emphasis, and flexible alerts, it helps you spot momentum and bias across Crypto, Forex (tick volume), and Stocks. Tidy labels and compact numbers keep the panel readable and fast.

Lunar calendar day Crypto Trading StrategyLunar calendar day Crypto Trading Strategy
This strategy explores the potential impact of the lunar calendar on cryptocurrency price cycles.
It implements a simple but unconventional rule:
Buy on the 5th day of each lunar month
Sell on the 26th day of the lunar month
No trades between January 1 (solar) and Lunar New Year’s Day (holiday buffer period)
Research background
Several academic studies have investigated the influence of lunar cycles on financial markets. Their findings suggest:
Returns tend to be higher around the full moon compared to the new moon.
Periods between the full moon and the waning phase often show stronger average returns than the waxing phase.
This strategy combines those observations into a practical implementation by testing fixed entry (lunar day 5) and exit (lunar day 26) points, while excluding the transition period from solar New Year to Lunar New Year, effectively capturing mid-month lunar effects.
How it works
The script includes a custom lunar date calculation function, reconstructing lunar months and days for each year (2020–2026).
On lunar day 5, the strategy opens a long position with 100% of equity.
On lunar day 26, the strategy closes the position.
No trades are executed between Jan 1 and Lunar New Year’s Day.
All trades include:
Commission: 0.1%
Slippage: 3 ticks
Position sizing uses the entire equity (100%) for simplicity, but this is not recommended for live trading.
Why this is original
Unlike mashups of built-in indicators, this script:
Implements a full lunar calendar system inside Pine Script.
Translates academic findings on lunar effects into an applied backtest.
Adds a realistic trading filter (holiday gap) based on cultural/seasonal calendar rules.
Provides researchers and traders with a framework to explore non-traditional, time-based signals.
Notes
This is an experimental, research-oriented strategy, not financial advice.
Results are highly dependent on the chosen period (2020–2026).
Using 100% equity per trade is for simplification only and is not a viable money management practice.
The purpose is to investigate whether cyclical patterns linked to lunar time can provide any statistical edge in ETHUSDT.

TCP | Market Session | Session Analyzer📌 TCP | Market Session Indicator | Crypto Version
A powerful, real-time market session visualization tool tailored for crypto traders. Track the heartbeat of Asia, Europe, and US trading hours directly on your chart with live session boxes, behavioral analysis, liquidity grab detection, and countdown timers. Know when the action starts, how the market behaves, and where the traps lie.
🔰 Introduction:
Trade the Right Hours with the Right Tools
Time matters in trading. Most significant moves happen during key sessions—and knowing when and how each session unfolds can give you a sharp edge. The TCP Market Session Indicator, developed by Trade City Pro (TCP), puts professional session tracking and behavioral insights at your fingertips.
Whether you're a scalper or swing trader, this indicator gives you the timing context to enter and exit trades with greater confidence and clarity.
🕒 Core Features
• Live Session Boxes :
Highlight active ranges during Asia, Europe, and US sessions with dynamic high/low updates.
• Session Start/End Labels :
Know exactly when each session begins and ends plotted clearly on your chart with context.
• Session Behavior Analysis :
At the end of each session, the indicator classifies the price action as:
- Trend Up
- Trend Down
- Consolidation
- Manipulation
• Liquidity Grab Detection: Automatically detects possible stop hunts (fake breakouts) and marks them on the chart with precision filters (volume, ATR, reversal).
• Session Countdown Table: A live dashboard showing:
- Current active session
- Time left in session
- Upcoming session and how many minutes until it starts
- Utility time converter (e.g. 90 min = 01:30)
• Vertical Session Lines: Visualize past and upcoming session boundaries with customizable history and future range.
• Multi-Day Support: Draw session ranges for previous, current, and future days for better backtesting and forecasting.
⚙️ Settings Panel
Customize everything to fit your trading style and schedule:
• Session Time Settings:
Set the opening and closing time for each session manually using UTC-based minute inputs.
→ For example, enter Asia Start: 0, Asia End: 480 for 00:00–08:00 UTC.
This gives full flexibility to adjust session hours to match your preferred market behavior.
• Enable or Disable Elements:
Toggle the visibility of each session (Asia, Europe, US), as well as:
- Session Boxes
- Countdown Table
- Session Lines
- Liquidity Grab Labels
• Timezone Selection:
Choose between using UTC or your chart’s local timezone for session calculations.
• Customization Options:
Select number of past and future days to draw session data
Adjust vertical line transparency
Fine-tune label offset and spacing for clean layout
📊 Smart Session Boxes
Each session box tracks high, low, open, and close in real time, providing visual clarity on market structure. Once a session ends, the box closes, and the behavior type is saved and labeled ideal for spotting patterns across sessions.
• Asia: Green Box
• Europe: Orange Box
• US: Blue Box
💡 Why Use This Tool?
• Perfect Timing: Don’t get chopped in low-liquidity hours. Focus on sessions where volume and volatility align.
• Pattern Recognition: Study how price behaves session-to-session to build better strategies.
• Trap Detection: Spot manipulation moves (liquidity grabs) early and avoid common retail pitfalls.
• Macro Session Mapping: Use as a foundational layer to align trades with market structure and news cycles.
🔍 Example Use Case
You're watching BTC at 12:45 UTC. The indicator tells you:
The Asia session just ended (label shows “Asia Session End: Trend Up”)
Europe session starts in 15 minutes
A liquidity grab just triggered at the previous high—label confirmed
Now you know who’s active, what the market just did, and what’s about to start—all in one glance.
✅ Why Traders Trust It
• Visual & Intuitive: Fully chart-based, no clutter, no guessing
• Crypto-Focused: Designed specifically for 24/7 crypto markets (not outdated forex models)
• Non-Repainting: All labels and boxes stay as printed—no tricks
• Reliable: Tested across multiple exchanges, pairs, and timeframes
🧩 Built by Trade City Pro (TCP)
The TCP Market Session Indicator is part of a suite of professional tools used by over 150,000 traders. It’s coded in Pine Script v6 for full compatibility with TradingView’s latest capabilities.
🔗 Resources
• Tutorial: Learn how to analyze sessions like a pro in our TradingView guide:
"TradeCityPro Academy: Session Mapping & Liquidity Traps"
• More Tools: Explore our full library of indicators on

HF Crypto Scalping BotHigh-Frequency Crypto Scalping Bot for ETHUSDT
This bot is designed for scalping ETHUSDT on a 1-minute chart using a blend of technical indicators and market structure logic.
🔍 Strategy Highlights:
Range Mode: Uses RSI and MFI to identify overbought/oversold zones near support/resistance.
Trend Mode: Detects MACD momentum combined with confirmed S/R breakouts.
Smart Risk Management: Dynamic stop loss and take profit based on risk:reward ratio.
Adaptive Market Logic: Automatically switches between trend and range conditions.
Real-Time Table: Displays RSI, MFI, MACD trend, market mode, entry/exit prices, and stop/target levels.
Visual Cues: Buy/Sell/Exit signals plotted directly on the chart with color-coded levels.
Alerts: Integrated long/short entry and exit alerts with live price and indicator values.
Customize the input parameters to fit your risk profile and asset volatility. Ideal for fast-paced scalping with dynamic conditions.

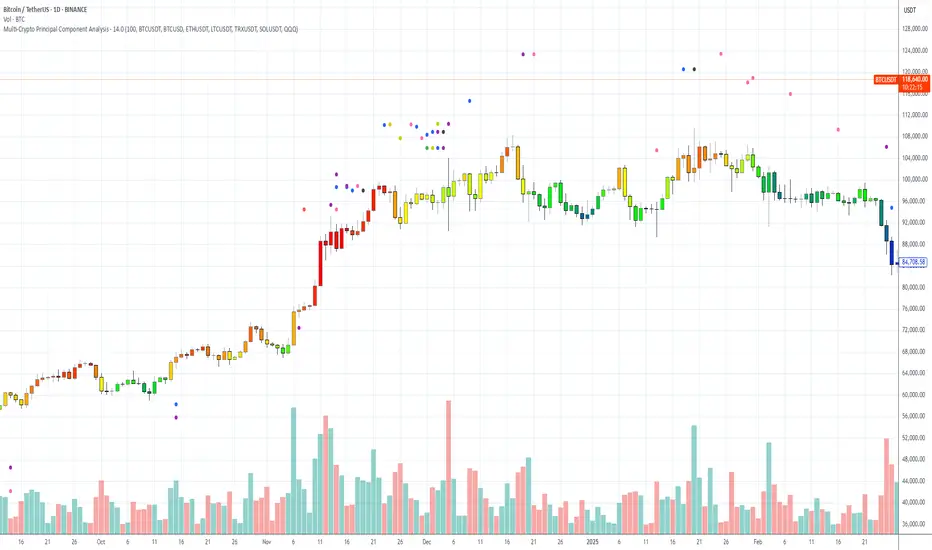
Multi-Crypto Principal Component AnalysisVersion 0.2
## 📌 Multi-Crypto Principal Component Analysis (PCA) — Indicator Summary
### 🎯 Purpose
This indicator identifies **cryptocurrency assets that are behaving differently** from the rest of the market, using a simplified approach inspired by Principal Component Analysis (PCA). It’s designed to help traders spot **cross-market divergences**, detect outliers, and improve asset selection and correlation-based strategies.
### ⚙️ How It Works
The indicator analyzes the **log returns** of up to 7 user-defined assets over a configurable lookback period (default: 100 bars). It computes the **z-score** (standardized deviation) for each asset’s return series and compares it against the average behavior of the group.
If an asset’s behavior deviates significantly (beyond a threshold of 1.5 standard deviations), it’s flagged as an **outlier**.
- Each outlier is plotted as a **colored dot horizontally spaced** above the price bar
- Up to **3 dots per bar** are shown for visual clarity
This PCA-style detection works in real time, directly on the chart, and gives you a quick overview of which assets are breaking correlation.
### 🔧 Inputs
- 🕒 **Lookback Period**: Number of bars to analyze (default: 100)
- 🔢 **Assets 1–7**: Choose any 7 crypto symbols from any exchange
- 🎨 **Colors**: Predefined per asset (e.g. BTCUSDT = red, ETHUSDT = yellow)
- 📈 **Threshold**: Internal (1.5 std dev); adjustable in code if needed
### 📊 Outputs
- 🟢 Dots above candles representing assets that are acting as outliers
- 🧠 Real-time clustering insight based on statistical deviation
- 🧭 Spatially spaced dots to avoid visual overlap when multiple outliers appear
### ⚠️ Limitations
- This is a **PCA-inspired approximation**, not true matrix-based PCA
- It does **not compute principal components or eigenvectors**
- Sensitivity may vary with asset volatility or sparse trading data
- Real PCA requires external tools like Python or R for full dimensional analysis
This tool is ideal for traders who want real-time crypto correlation insights without needing external data science platforms. It’s lightweight, fast, and highly visual — and gives you a powerful lens into market dislocations across multiple assets.
Williams VIX For Bottoms [DCD]Williams VIX Original - Authentic Volatility Fear Gauge
What This Indicator Does
The Williams VIX Fix measures market fear by calculating how far current lows deviate from recent highs, identifying potential market bottoms during high volatility periods. This implementation provides Larry Williams' original formula in its purest form.
How It Works
Core Formula:
VIX Fix = ((Highest High over 22 periods - Current Low) / Highest High over 22 periods) × 100
The calculation process:
Measures Relative Distance: Compares current low to highest high over lookback period
Converts to Percentage: Normalizes values for cross-market comparison
Applies Statistical Analysis: Uses Bollinger Bands (2 std dev) around VIX Fix values
Filters with Percentiles: 85th percentile threshold removes noise
Signal Generation
Green Flash Signals trigger when either condition is met:
VIX Fix exceeds upper Bollinger Band (2 standard deviations above 20-period MA)
VIX Fix exceeds Range High (85th percentile of recent values)
This dual-condition approach reduces false signals while capturing genuine volatility spikes.
What Makes This Original
Pure Formula Implementation: Uses Williams' exact original calculation without modifications
Dual Confirmation System: Combines Bollinger Bands with percentile analysis
Professional Visualization: Histogram display, background highlighting, and live value table
Comprehensive Alerts: Signal start/end notifications plus Green Flash alerts
How to Use
Primary Purpose: Spot high-probability reversal zones during market fear climaxes
Signal Interpretation:
Green triangle + background highlight = High volatility reversal zone
Higher VIX Fix values = Stronger fear/better reversal potential
Use with price action confirmation for best results
Optimal Settings:
Timeframes: 4H, Daily, Weekly
Markets: All (stocks, crypto, forex, commodities)
Combine with support levels and candlestick patterns
Key Parameters:
VIX Fix Length (22): Lookback period for highest high
Std Dev Multiplier (2.0): Bollinger Band sensitivity
Percentile High (0.85): Only top 15% of readings trigger signals
The VIX Fix excels at identifying market fear climaxes that coincide with significant price bottoms, making it valuable for swing traders seeking high-probability entries during market stress.

MestreDoFOMO Future Projection BoxMestreDoFOMO Future Projection Box - Description & How to Use
Description
The "MestreDoFOMO Future Projection Box" is a TradingView indicator tailored for crypto traders (e.g., BTC/USDT on 1H, 4H, or 1D timeframes). It visualizes current price ranges, projects future levels, and confirms trends using semi-transparent boxes. With labeled price levels and built-in alerts, it’s a simple yet powerful tool for identifying support, resistance, and potential price targets.
How It Works
Blue Box (Current Channel): Shows the recent price range over the last 10 bars (adjustable). The top is the highest high plus an ATR buffer, and the bottom is the lowest low minus the buffer. Labels display exact levels (e.g., "Top: 114000", "Bottom: 102600").
Green Box (Future Projection): Projects the price range 10 bars ahead (adjustable) based on the trend slope of the moving average. Labels show "Proj Top" and "Proj Bottom" for future targets.
Orange Box (Moving Average): Traces a 50-period EMA (adjustable) to confirm the trend. An upward slope signals a bullish trend; a downward slope signals a bearish trend. A label shows the current MA value (e.g., "MA: 105000").
Alerts: Triggers when the price nears the projected top or bottom, helping you catch breakouts or retracements.
How to Use
Add the Indicator: Apply "MestreDoFOMO Future Projection Box" to your chart in TradingView.
Interpret the Trend: Check the orange box’s slope—upward for bullish, downward for bearish.
Identify Key Levels: Use the blue box’s top as resistance and bottom as support. On a 4H chart, if the top is 114,000, expect resistance; if the bottom is 102,600, expect support.
Plan Targets: Use the green box for future targets—top for profit-taking (e.g., 114,000), bottom for stop-loss or buying (e.g., 102,600).
Set Alerts: Enable alerts for "Near Upper Projection" or "Near Lower Projection" to get notified when the price hits key levels.
Trade Examples:
Bullish: If the price breaks above the blue box top (e.g., 114,000), buy with a target at the green box top. Set a stop-loss below the green box bottom.
Bearish: If the price rejects at the blue box top and drops below the orange MA, short with a target at the blue box bottom.
Customize: Adjust the lookback period, projection bars, ATR multiplier, and MA length in the settings to fit your trading style.
Tips
Use on 1H for short-term trades, 4H for swing trades, or 1D for long-term trends.
Combine with volume or RSI to confirm signals.
Validate levels with market structure (e.g., candlestick patterns).

TCP | Money Management indicator | Crypto Version📌 TCP | Money Management Indicator | Crypto Version
A robust, multi-target risk and capital management indicator tailored for crypto traders. Whether you're trading spot, perpetual futures, or leverage tokens, this tool empowers you with precise control over risk, reward, and position sizing—directly on your chart. Eliminate guesswork and trade with confidence.
🔰 Introduction: Master Your Capital, Master Your Trades
Poor money management is the number one reason traders lose their accounts, even with solid strategies. The TCP Money Management Indicator, built by Trade City Pro (TCP), solves this problem by providing a structured, rule-based approach to capital allocation.
Want to dive deeper into the concept of money management? Check out our comprehensive tutorial on TradingView, " TradeCityPro Academy: Money Management ", to understand the principles that power this indicator and transform your trading mindset.
This indicator equips you to:
• Calculate optimal position sizes based on your capital, risk percentage, and leverage
• Set up to 5 customizable take-profit targets with partial close percentages
• Access real-time metrics like Risk-to-Reward (R/R), USD profit, and margin usage
• Trade with discipline, avoiding emotional or inconsistent decisions
💸 Money Management Formula
The indicator uses a professional capital allocation model:
Position Size = (Capital × Risk %) ÷ (Stop Loss % × Leverage)
From this, it calculates:
• Total risk amount in USD
• Optimal position size for your trade
• Margin required for each take-profit target
• Adjusted R/R for each target, accounting for partial position closures
🛠 How to Use
Enter Trade Parameters: Input your capital, risk %, leverage, entry price, and stop-loss price.
Set Take-Profit Targets: Enable 1 to 5 take-profit levels and specify the percentage of the position to close at each.
Real-Time Calculations: The indicator automatically computes:
• R/R ratio for each target
• Profit in USD for each partial close
• Margin used per target (in % and USD)
Visualize Your Trade:
• Price levels for entry, stop-loss, and take-profits are plotted on the chart.
• A dynamic info panel on the left side displays all key metrics.
🔄 Dynamic Adjustments: As each take-profit target is hit and a portion of the position is closed, the indicator recalculates the remaining position size, expected profit, R/R, and margin for subsequent targets. This ensures accuracy and reflects real-world trade behavior.
📊 Table Overview
The left-side panel provides a clear snapshot:
• Trade Setup: Capital, entry price, stop-loss, risk amount, and position size
• Per Target: Percentage closed, R/R, profit in USD, and margin used
• Summary: Total expected profit across all targets
⚙️ Settings Panel
• Total Capital ($): Your account size for the trade
• Risk per Trade (%): The percentage of capital you’re willing to risk
• Leverage: The leverage applied to the trade
• Entry/Stop-Loss Prices: Define your trade’s risk zone
• Take-Profit Targets (1–5): Set price levels and percentage to close at each
🔍 Use Case Example
Imagine you have $1,000 capital, risking 1%, using 10x leverage:
• Entry: $100 | Stop-Loss: $95
• TP1: $110 (close 50%) | TP2: $115 (close 50%)
The indicator calculates the exact position size, profit at each target, and margin allocation in real time, with all metrics displayed on the chart.
✅ Why Traders Love It
• Precision: No more manual calculations or guesswork
• Versatility: Works on all crypto pairs (BTC, ETH, altcoins, etc.)
• Flexibility: Perfect for scalping, swing trading, or futures strategies
• Universal: Compatible with all timeframes
• Transparency: Fully manual, with clear and reliable outputs
🧩 Built by Trade City Pro (TCP)
Developed by TCP, a trusted name in trading tools, used by over 150,000 traders worldwide. This indicator is coded in Pine Script v5, ensuring compatibility with TradingView’s platform.
🧾 Final Notes
• No Auto-Trading: This is a manual tool for disciplined traders
• No Repainting: All calculations are accurate and non-repainting
• Tested: Rigorously validated across major crypto pairs
• Publish-Ready: Built for seamless use on TradingView
🔗 Resources
• Money Management Tutorial: Learn the fundamentals of capital management with our detailed guide: TradeCityPro Academy: Money Management
• TradingView Profile: Explore more tools by TCP on TradingView
