Realized Volatility (annualized for any time frame)Plots standard deviation of returns (realized volatility), and annualizes it for the selected timeframe. Suitable for forex/cryptocurrencies which trade 24/7.
Cerca negli script per "crypto"

BTC and ETH Long strategy - version 2I wrote my first article in May 2020. See below
BTC and ETH Long strategy - version1
After 6 months, it is now time to check the result of my script for the last 6 months.
XBTUSD (4H): 14/05/2020 --> 22/11/2020 = +78% in 4 trades
ETHXBT (4H): 14/05/2020 --> 22/11/2020 = +21% in 9 trades
ETHUSD (4H): 14/05/2020 --> 22/11/2020 = +90% in 6 trades
Using the signals from this strategy to trade manually has shown that this was a bit frustrating because of the low rate of winning trades.
If you have to enter 100 trades and see 75% of them failing and 25% winning, this is frustrating. For sure the strategy makes good money but it is difficult to hold this mentality.
So, I have reviewed and modified it to get a higher winning rate.
After few days of work, tests and validation, I managed to get a wining rate close to 60%.
The key element was also to decrease the number of trades by using a higher time frame. (4H candles instead of 2H candles).
- Entry in position is based on
MACD, EMA (20), SMA (100), SMA (200) moving up
AND EMA (20) > SMA (100)
AND SMA (100) > SMA (200)
- Exit the position if: Stoploss is reached OR EMA (20) crossUnder SMA (100)
The goal of this new script is to be able to follow the signals manually and only make few trades per years.
I have also validated it against some other altcoins where some are giving very good results.
Here are some results for 2020 (from 01/01/2020 until now (22/11/2020). Those results are the one I get when using 4H candles.
ETH/USD: +144% in 8 trades.
BTC/USD: +120% in 7 trades.
ETH/BTC: +33% in 9 trades.
ICX/USD: +123% in 10 trades.
LINK/USD: +155% in 11 trades.
MLN/USD: +388% in 8 trades.
ADA/USD: +180% in 7 trades.
LINK/BTC: +97% in 10 trades.
The best is that above results are without considering compound effect. If you re-invest all gains done in each new trade, this will give you the below results :)
ETH/USD: +189% in 8 trades.
BTC/USD: +260% in 7 trades.
ETH/BTC: +29% in 9 trades.
ICX/USD: +112% in 10 trades.
LINK/USD: +222% in 11 trades.
MLN/USD: +793% in 8 trades.
ADA/USD: +319% in 7 trades.
LINK/BTC: +103% in 10 trades.
As you can see, the results are good and the number of trades for 11 months is not big, which allows the trader to place orders manually.
But still, I'm lazy :), so, I have also coded this strategy in HaasScript language which allows you to automate this strategy using the HaasOnline software specialized in automated crypto trading.
I hope that this strategy will give you ideas or will be the starting point for your own strategy.
Let me know if you need more details.

Dynamic Dots Dashboard (a Cloud/ZLEMA Composite)The purpose of this indicator is to provide an easy-to-read binary dashboard of where the current price is relative to key dynamic supports and resistances. The concept is simple, if a dynamic s/r is currently acting as a resistance, the indicator plots a dot above the histogram in the red box. If a dynamic s/r is acting as support, a dot is plotted in the green box below.
There are some additional features, but the dot graphs are king.
_______________________________________________________________________________________________________________
KEY:
_______________________________________________________________________________________________________________
Currently the dynamic s/r's being used in the dot plots are:
Ichimoku Cloud:
Tenkan (blue)
Kijun (pink)
Senkou A (red)
Senkou B (green)
ZLEMA (Zero Lag Exponential Moving Average)
99 ZLEMA (lavender)
200 ZLEMA (salmon)
You'll see a dashed line through the middle of the resistances section (red) and supports section (green). Cloud indicators are plotted above the dashed line, and ZLEMA's are below.
_______________________________________________________________________________________________________________
How it Works - Visual
_______________________________________________________________________________________________________________
As stated in the intro - if a dynamic s/r is currently above the current price and acting as a resistance, the indicator plots a dot above the histogram in the red box. If a dynamic s/r is acting as support, a dot is plotted in the green box below. Additionally, there is an optional histogram (default is on) that will further visualize this relationship. The histogram is a simple summation of the resistances above and the supports below.
Here's a visual to assist with what that means. This chart includes all of those dynamic s/r's in the dynamic dot dashboard (the on-chart parts are individually added, not part of this tool).
You can see that as a dynamic support is lost, the corresponding dot is moved from the supports section at the bottom (green), to the resistances section at the top (red). The opposite being true as resistances are being overtaken (broken resistances are moved to the support section (red)). You can see that the raw chart is just... a mess. Which kinda of accentuates one of the key goals of this indicator: to get all that dynamic support info without a mess of a chart like that.
_______________________________________________________________________________________________________________
How To Use It
_______________________________________________________________________________________________________________
There are a lot of ways to use this information, but the most notable of which is to detect shifts in the market cycle.
For this example, take a look at the dynamic s/r dots in the resistances category (red background). You can see clearly that there are distinctive blocks of high density dots that have clear beginnings and ends. When we transition from a high density of dots to none in resistances, that means we are flipping them as support and entering a bull cycle. On the other hand, when we go from low density of dots as resistances to high density, we're pivoting to a bear cycle. Easy as that, you can quickly detect when market cycles are beginning or ending.
Alternatively, you can add your preferred linear SR's, fibs, etc. to the chart and quickly glance at the dashboard to gauge how dynamic SR's may be contributing to the risk of your trade.
_______________________________________________________________________________________________________________
Who It's For
_______________________________________________________________________________________________________________
New traders: by looking at dot density alone, you can use Dot Dynamics to spot transitionary phases in market cycles.
Experienced traders: keep your charts clean and the information easy to digest.
Developers: I created this originally as a starting point for more complex algos I'm working on. One algo is reading this dot dashboard and taking a position size relative to the s/r's above and below. Another cloud algo is using the results as inputs to spot good setups.
Colored Bars
There is an option (off by default, shown in the headline image above) to fill the bar colors based on how many dynamic s/r's are above or below the current price. This can make things easier for some users, confusing for others. I defaulted them to off as I don't want colors to confuse the primary value proposition of the indicators, which is the dot heat map. You can turn on colored bars in the settings.
One thing to note with the colored bars: they plot the color purely by the dot densities. Random spikes in the gradient colors (i.e. red to lime or green) can be a useful thing to notice, as they commonly occur at places where the price is bouncing between dynamic s/r's and can indicate a paradigm shift in the market cycle.
_______________________________________________________________________________________________________________
Timeframes and Assets
_______________________________________________________________________________________________________________
This can be used effectively on all assets (stocks, crypto, forex, etc) and all time frames. As always with any indicator, the higher TF's are generally respected more than lower TF's.
Thanks for checking it out! I've been trading crypto for years and am just now beginning to publish my ideas, secret-sauce scripts and handy tools (like this one). If you enjoyed this indicator and would like to see more, a like and a follow is greatly appreciated 😁.

DePriExchange weighted price for cryptocurrencies
DECENTRALIZED PRICE CHART FOR DECENTRALIZED WORLD
See non-manipulated , globally price action that comes from whole liquidity!
The main idea behind this script is that...
The value of each trading pair finally determined globally and the price displayed in exchanges is its own and not global! differences between exchanges, reduced to near zero gradually by market makers and arbitrages, so..
Every min tick price changes Must be backed by liquidity to be part of the global fluctuations
more liquidity gives it more credibility
more credibility give it more weight
..Against opposing movements.
This script can collect price of crypto pairs from 12 exchanges that listed on TV and have effective volume.
In the first step, summarizes the volume of all exchanges and creates the total volume
In the next step, divide each exchange volume to total volume to obtain relative weight of each exchange.
In the final step, multiply each exchange price to weight of itself and summarizes these numbers .. now, we have Exchange weighted price!
The results on high liquidity pairs like BTCUSDT, ETHUSDT, is not much differ then simple chart but when you apply it on lower liquidity, lower time frames of altcoins, you realize its benefits and usefulness. Altcoins chart in composite and simple mode is very differ, I hope you enjoy from TRUE CHART.
With this, also you can..
Filter and smooth candlestick chart with SMA or EMA
Plot a line chart of pair at your desired frame separate from the main chart for monitor important price levels
Get realtime report of whole volume of pair on included exchanges
Get realtime report of each exchange weight and share
Note.1:
some of pairs queted on more than one like BTCUSD, BTCUSDT, BTCUSDC and etc. In this pairs we choose the one that usually has more volume on that exchange.
Note.2:
At this time, supported queted currencies are BTC, ETH, USD, USDT, BUSD, USDC, USDK.
Note.3:
This script is relatively heavy! This is not cuz of bad coding.
Each bar compution contains at least one plot and some of security calls, so 10 to 15 seconds is normal load time.
Note.4:
You can combine this with your price action base scripts and use balanced OHLCV. The necessary explanations about this are available in the code.
Note.5:
You must only include exchanges that support your ticker, Otherwise you will receive an error.
I hope it comes useful to you.

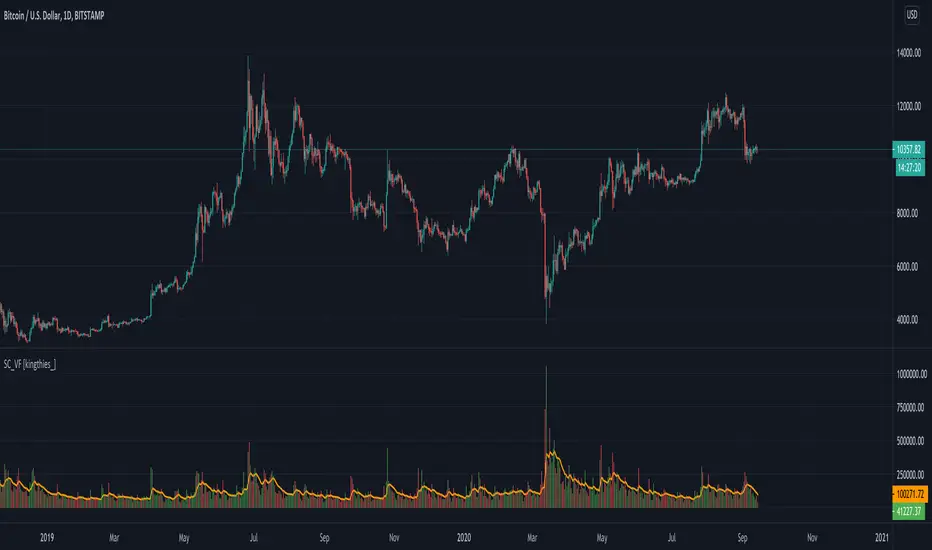
Stablecoin Volume Flow [kingthies_]Stablecoin Volume Flow into BTCUSD/BTC-Stablecoin pairings
Exchanges Used
Coinbase
Kraken
Bittrex
Binance
Huobi
Bitstamp
Gemini
Bitfinex
Our aim here is simple...to combine the overall volume flow from Fiat or stable currencies into the crypto-markets.
This is the first portion of a series I plan to share involving a holistic approach to understanding the overall crypto-ecosystem. I've included several of the highest ranking by volume exchanges and their accompanying older/well known stablecoins.
Also, the historic data for the newer stable coins made the study invalid due to limited sample size. That included coins like USDC, DAI, GUSD, BUSD and more. For this reason, the 10 sources of data here adequately provide the data needed to see a full view of the market volume going in and out of bitcoin at any given moment
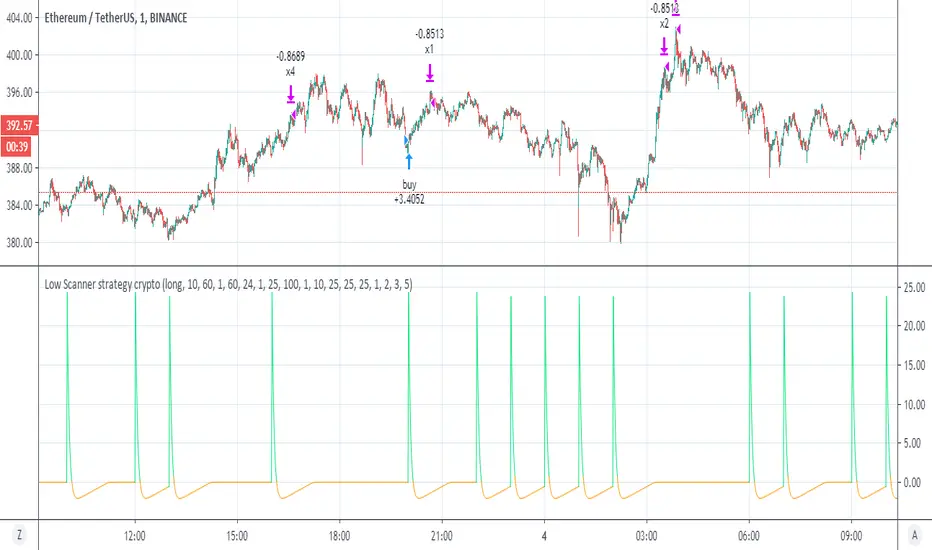
Low Scanner strategy cryptoThis is the last script of the Low scanner series
I have shown in script 1 the best strategy for stocks on 1 hour
script for forex 1 hour (if you look on comments you will find settings which are perfect for low TF (1 min system )
This strategy is the perfect weapen for crypto
no repaint as I shown the scanner do not use security
this system will buy and sell about every 1000 min in the end you will getyour profit which is progressive
set to 1,2,3, and 5 % where each time you take 25% of equaty out
as I shown before the power of the progresive take and my scanner make it best
the scnner serach for low point using my special RSI system with no repaint MTF
every time we get our profit out
the scanner will find us new low to start cycle again
so invite me for coffe if you like this system
thanks to TV that allow donation:)
so this is example of smart strategy that beat the odds
try on major crypto assets (it nice system )
without the script of adolgov
this system was not possible so I would like to thank him very much that he share with us his great script
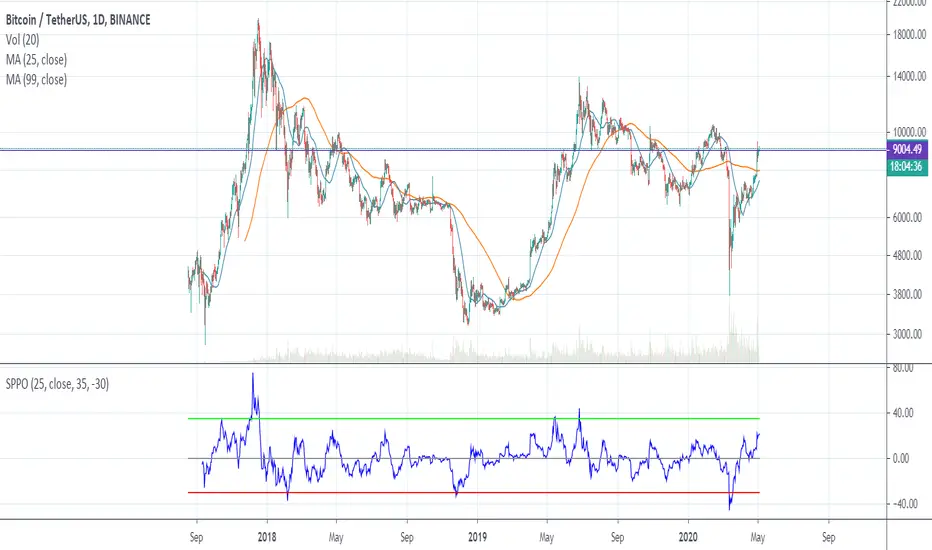
SPPO — Simple Percentage Price Oscillator SPPO is Simple Percentage Price Oscillator .
SPPO is calculated as the ratio of the current price to the moving average.
This indicator is used in the trading strategy to determine overbought and oversold markets. Chart period D1.
I use this oscillator on the BTCUSD and ETHUSD pairs. It can also be used on other top crypto symbols.
If SPPO on the BTCUSDT chart > 35%, this means that in the Bitcoin market pamp . So it’s time to close long positions.
If SPPO on the bitcoin chart is <-30%, then bitcoin is oversold and you need to think about starting to buy it.
Recommended timeframe: 1d
Input parameters:
MA Length — number of bars for moving average. Default = 25.
Source — type of price used to calculate the MA. Default = close.
High Level — upper horizontal constant on the SPPO chart. Default = 35.
Low Level — lower horizontal constant on the SPPO chart. Default = -35.
Simple MA(Oscillator) — type of MA indicator used. If false = Exponential Moving Average , if true = Simple Moving Average . Default = true.
Best Volatility Calculator (Multi Instruments)Hello traders
A bit of context
Definition: Volatility is defined as the close of current candle - close of the previous N candle
This is an alternative version of my Best Volatility Calculator
The other version is displayed on a panel below. This one overlays on the chart using the "overlay=true" setting
This indicator shows the average volatility, of last N Periods, for the selected time frames and for 2 selected instruments.
You can select up to 2 timeframes with this version
Presented as Currency, Pip, percentage labels in a panel below.
Will calculate in real-time only for the current instrument on the chart.
The indicator is coded to not be repainting
Example
In the indicator screenshot, I used a lookback period of 1.
That compares the current candle close versus the previous one for the daily and weekly timeframe
Showing how the results look like using FOREX instruments (where using the PIPS labels make more sense than with cryptocurrency assets)
Best regards
Dave

Trade System Crypto InvestidorTrade System created to facilitate the visualization of crossing and extensions of the movements with Bollinger bands.
Composed by:
Moving Averages of 21, 50, 100 and 200.
Exponential Moving Averages: 17,34,72,144, 200 and 610.
Bollinger bands with standard deviation 2 and 3.
How it works?
The indicators work together, however there are some important cross-averages that need to be identified.
- Crossing the MA21 with 50, 100 and 200 up or down will dictate an up or down trend.
- MA200 and EMA200 are excellent indicators of resistance and support zone, if the price is above these averages it will be a great support, if the price is below these averages it will indicate strong resistance.
- Another important crossover refers to exponential moving averages of 17 to 72 indicates a possible start of a trend
- The crossing of the exponential moving average of 34 with 144 will confirm the crossing mentioned above.
- In addition, the exponential moving average of 610 used by Bo Williams is an excellent reference for dictating an upward or downward trend, if the price is above it it will possibly confirm an upward trend and the downside.
- To conclude we have bollinger bands with standard deviation 2 and 3, they help to identify the maximum movements.

HatiKO EnvelopesPublished source code is subject to the terms of the GNU Affero General Public License v3.0
This script describes and provides backtesting functionality to internal strategy of algorithmic crypto trading software "HatiKO bot".
Suitable for backtesting any Cryptocurrency Pair on any Exchange/Platform, any Timeframe.
Core Mechanics of this strategy are based on theory of price always returning to Moving Average + Envelopes indicator (Moving_average_envelope from Wiki)
Developement of this script and trading software is inspired by:
"Essential Technical Analysis: Tools and Techniques to Spot Market Trends" by Leigh Stevens (published on 12th of April 2002)
"Moving Average Envelopes" by ChartSchool, StockCharts platform (published on 13th of April 2015 or earlier)
"Коля Колеснік" from Crypto Times channel ("Метод сетка", published on 19th of August 2018)
"3 ways to use Moving Average Envelopes" by Rich Fitton, published on Trader's Nest (published on 28st of November 2018 or earlier)
noro's "Robot WhiteBox ShiftMA" strategy v1 script, published on TradingView platform (published on 29th of August 2018)
"Moving Average Envelopes: A Popular Trading Tool" Investopedia article (published 25th of June 2019)
and KROOL1980's blogpost on Argolabs ("Гридерство или Сетка как источник прибыли на форекс", published on 27th of February 2015)
Core Features:
1) Up to 4 Envelopes in each direction (Long/Short)
2) Use any of 6 different basis MAs, optionally use different MAs for Opening and Closure
3) Use different Timeframes for MA calculation, without any repainting and lookahead bias.
4) Fixed order size, not Martingale strategy
5) Close open position earlier by using Deviation parameter
6) PineScript v4 code
Options description:
Lot - % from your initial balance to use for order size calculation
Timeframe Short - Timeframe to use for Short Opening MA calculation, can be chosen from dropdown list, default is Current Graph Timeframe
MA Type Short - Type of MA to use for Short Opening MA calculation, can be chosen from dropdown list, default is SMA
Data Short - Source of Price for Short Opening MA calculation, can be chosen from dropdown list, default is OHLC4
MA Length Short - Period used for Short Opening MA calculation, should be >=1, default is 3
MA offset Short - Offset for MA value used for Short Envelopes calculation, should be >= 0, default is 0
Timeframe Long - Timeframe to use for Long Opening MA calculation, can be chosen from dropdown list, default is Current Graph Timeframe
MA Type Long - Type of MA to use for Long Opening MA calculation, can be chosen from dropdown list, default is SMA
Data Long - Source of Price for Long Opening MA calculation, can be chosen from dropdown list, default is OHLC4
MA Length Long - Period used for Long Opening MA calculation, should be >=1, default is 3
MA offset Long - Offset for MA value used for Long Envelopes calculation, should be >= 0, default is 0
Mode close MA Short - Enable different MA for Short position Closure, default is "false". If false, Closure MA = Opening MA
Timeframe Short Close - Timeframe to use for Short Position Closure MA calculation, can be chosen from dropdown list, default is Current Graph Timeframe
MA Type Close Short - Type of MA to use for Short Position Closure MA calculation, can be chosen from dropdown list, default is SMA
Data Short Close - Source of Price for Short Closure MA calculation, can be chosen from dropdown list, default is OHLC4
MA Length Short Close - Period used for Short Opening MA calculation, should be >=1, default is 3
Short Deviation - % to move from MA value, used to close position above or beyond MA, can be negative, default is 0
MA offset Short Close - Offset for MA value used for Short Position Closure calculation, should be >= 0, default is 0
Mode close MA Long - Enable different MA for Long position Closure, default is "false". If false, Closure MA = Opening MA
Timeframe Long Close - Timeframe to use for Long Position Closure MA calculation, can be chosen from dropdown list, default is Current Graph Timeframe
MA Type Close Long - Type of MA to use for Long Position Closure MA calculation, can be chosen from dropdown list, default is SMA
Data Long Close - Source of Price for Long Closure MA calculation, can be chosen from dropdown list, default is OHLC4
MA Length Long Close - Period used for Long Opening MA calculation, should be >=1, default is 3
Long Deviation - % to move from MA value, used to close position above or beyond MA, can be negative, default is 0
MA offset Long Close - Offset for MA value used for Long Position Closure calculation, should be >= 0, default is 0
Short Shift 1..4 - % from MA value to put Envelopes at, for Shorts numbers should be positive, the higher is number, the higher should be Shift position, example: "Shift 1 = 1, shift 2 = 2, etc."
Long Shift 1..4 - % from MA value to put Envelopes at, for Longs numbers should be negative, the lower is number, the lower should be Shift position, example: "Shift 1 = -1, shift 2 = -2, etc."
From Year 20XX - Backtesting Starting Year number, only 20xx supported as script is cryptocurrency-oriented.
To Year 20XX - Backtesting Final Year number, only 20xx supported as script is cryptocurrency-oriented.
From Month - Years starting Month, optional tweaking, changing not recommended
To Month - Years ending Month, optional tweaking, changing not recommended
From day - Months starting day, optional tweaking, changing not recommended
To day - Months ending day, optional tweaking, changing not recommended
Graph notes:
Green lines - Long Envelopes.
Red lines - Short Envelopes.
Orange line - MA for closing of Short positions.
Lime line - MA for closing of Long positions.
**************************************************************************************************************************************************************************************************************
Опубликованный исходный код регулируется Условиями Стандартной Общественной Лицензии GNU Affero v3.0
Этот скрипт описывает и предоставляет функции бектеста для внутренней стратегии алгоритмического программного обеспечения "HatiKO bot".
Подходит для тестирования любой криптовалютной пары на любой бирже/платформе, на любом таймфрейме.
Кор-механика этой стратегии основана на теории всегда возвращающейся к значению МА цены с использованием индикатора Envelopes (Moving_average_envelope from Wiki)
Разработка этого скрипта и программного обеспечения для торговли вдохновлена следующими источниками:
Книга "Essential Technical Analysis: Tools and Techniques to Spot Market Trends" Ли Стивенса (опубликовано 12 апреля 2002 года)
«Moving Average Envelopes» от ChartSchool, платформа StockCharts (опубликовано 13 апреля 2015 года или раньше)
«Коля Колеснік» с канала Crypto Times («Метод сетка», опубликовано 19 августа 2018 года)
«3 ways to use Moving Average Envelopes» Рича Фиттона, опубликованные в «Trader's Nest» (опубликовано 28 ноября 2018 года или раньше)
Скрипт стратегии noro "Robot WhiteBox ShiftMA" v1, опубликованный на платформе TradingView(опубликовано 29 августа 2018 года)
«Moving Average Envelopes: A Popular Trading Tool», статья Investopedia (опубликовано 25 июня 2019 года)
Блог KROOL1980 из Argolabs («Гридерство или Сетка как источник прибыли на форекс», опубликовано 27 февраля 2015 года)
Основные особенности:
1) До 4-х Ордеров в каждом из направлении (Лонг / Шорт)
2) Выбор из 6-ти разных базовых МА, опционально используйте разные МА для открытия и закрытия.
3) Используйте разные таймфреймы для расчета MA, без перерисовки и "эффекта стеклянного шара".
4) Фиксированный размер ордера, а не стратегия Мартингейла
5) Возможность закрытия открытой позиции заблаговременно, используя параметр Deviation
6) Код реализован на PineScript v4
Описание параметров:
Lot - % от вашего первоначального баланса, используется при расчете размера Ордера
Timeframe Short - таймфрейм, используемый для расчета МА Открытия Шорт позиций, может быть выбран из списка, по умолчанию - таймфрейм текущего графика
MA Type Short - тип MA, используемый для расчета МА Открытия Шорт позиций, может быть выбран из списка, по умолчанию SMA
Data Short - источник цены для расчета МА Открытия Шорт позиций, может быть выбран из списка, по умолчанию OHLC4
MA Length Short - период, используемый для расчета МА Открытия Шорт позиций, должен быть >= 1, по умолчанию 3
MA Offset Short - смещение значения MA, используемого для расчета Шорт Ордеров, должно быть >= 0, по умолчанию 0
Timeframe Long - таймфрейм, используемый для расчета МА Открытия Лонг позиций, может быть выбран из списка, по умолчанию - таймфрейм текущего графика
MA Type Long - тип MA, используемый для расчета МА Открытия Лонг позиций, может быть выбран из списка, по умолчанию SMA
Data Long - источник цены для расчета МА Открытия Лонг позиций, может быть выбран из списка, по умолчанию OHLC4
MA Length Long - период, используемый для расчета МА Открытия Лонг позиций, должен быть >= 1, по умолчанию 3
MA Offset Long - смещение значения MA, используемого для расчета Лонг Ордеров, должно быть >= 0, по умолчанию 0
Mode close MA Short - Включает отдельное MA для закрытия Шорт позиции, по умолчанию «false». Если false, MA Закрытия = MA Открытия
Timeframe Short Close - таймфрейм, используемый для расчета МА Закрытия Шорт позиций, может быть выбран из списка, по умолчанию - таймфрейм текущего графика
MA Type Close Short - тип MA, используемый при расчете МА Закрытия Шорт позиции. Mожно выбрать из списка, по умолчанию SMA
Data Short Close - источник цены для расчета МА Закрытия Шорт позиций, может быть выбран из списка, по умолчанию OHLC4
MA Length Short Close - период, используемый для расчета МА Закрытия Шорт позиции, должен быть >= 1, по умолчанию 3
Short Deviation - % отклонения от значения MA, используется для закрытия позиции выше или ниже рассчитанного значения MA, может быть отрицательным, по умолчанию 0
MA Offset Short Close - смещение значения MA, используемого для расчета закрытия Шорт позиции, должно быть >= 0, по умолчанию 0
Mode close MA Long - Включает разные MA для закрытия Лонг позиции, по умолчанию «false». Если false, MA Закрытия = MA Открытия
Timeframe Long Close - таймфрейм, используемый для расчета МА Закрытия Лонг позиций, может быть выбран из списка, по умолчанию - таймфрейм текущего графика
MA Type Close Long - тип MA, используемый при расчете МА Закрытия Лонг позиции. Mожно выбрать из списка, по умолчанию SMA
Data Long Close - источник цены для расчета МА Закрытия Лонг позиций, может быть выбран из списка, по умолчанию OHLC4
MA Length Long Close - период, используемый для расчета МА Закрытия Лонг позиции, должен быть >= 1, по умолчанию 3
Long Deviation -% для перехода от значения MA, используется для закрытия позиции выше или ниже рассчитанного значения MA, может быть отрицательным, по умолчанию 0
MA Offset Long Close - смещение значения MA, используемого для расчета закрытия Лонг позиции, должно быть >= 0, по умолчанию 0
Short Shift 1..4 - % от значения MA для размещения Ордеров, для Шорт Ордеров должен быть положительным, чем выше номер, тем выше должна располагаться позиция Shift, например: «Shift 1 = 1, Shift 2 = 2 и т.д. "
Long Shift 1..4 - % от значения MA для размещения Ордеров, для Лонг Ордеров должно быть отрицательным, чем ниже число, тем ниже должна располагаться позиция Shift, например: «Shift 1 = -1, Shift 2 = -2, и т.д."
From Year 20XX - Год начала тестирования, из-за ориентированности на криптовалюты поддерживаются только значения формата 20хх.
To Year 20XX - Год окончания тестирования, из-за ориентированности на криптовалюты поддерживаются только значения формата 20хх.
From Month - Начальный месяц, опционально, менять не рекомендуется
To Month - Конечный месяц, опционально, менять не рекомендуется
From day - Начальный день месяца, опционально, менять не рекомендуется
To day - Конечный день месяца, опционально, менять не рекомендуется
Пояснения к графику:
Зеленые линии - Лонг Ордера.
Красные линии - Шорт Ордера.
Оранжевая линия - MA Закрытия Шорт позиций.
Лаймовая линия - MA Закрытия Лонг позиций.

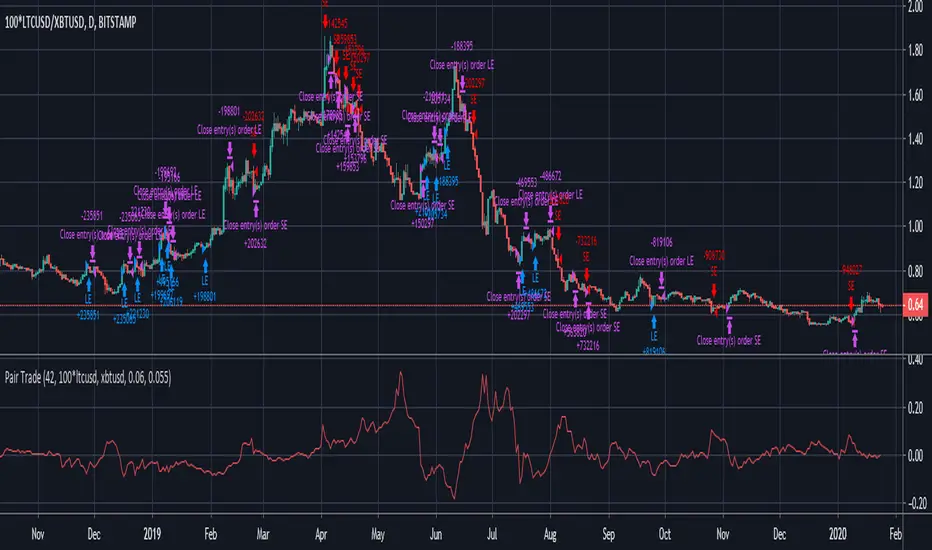
Pair Trade cryptoPair trade for crypto with inputs:
* length of correlation and moving average
* trade pair
* spread threshold to enter long / short
* spread threshold to exit long / short
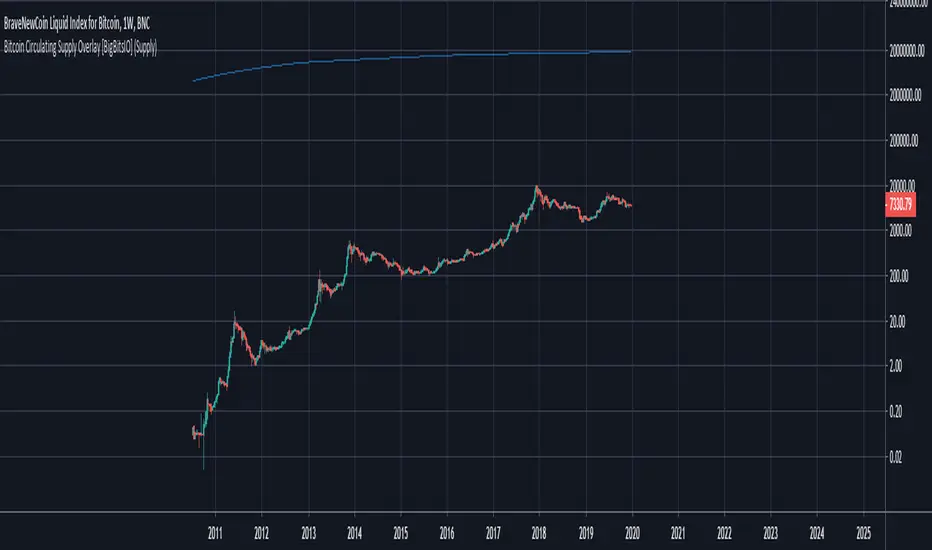
Bitcoin Circulating Supply Overlay [BigBitsIO]This script shows the estimated circulating supply of Bitcoin on any given day.
Features:
- Estimated Bitcoin circulating supply calculated daily
- Uses the Bitcoin reward schedule, past halving dates, and the next upcoming halving estimated date to calculate the current estimated supply.
- Optionally includes an option to use "Log Reduction" on the chart
*** DISCLAIMER: For educational and entertainment purposes only. Nothing in this content should be interpreted as financial advice or a recommendation to buy or sell any sort of security or investment including all types of crypto. DYOR, TYOB. ***
BEST Mayer MultipleHello traders
I'm not a HODLer by any means. I know when to sell (or I think I know....) when an asset starts going against me too much.
Even if it's a "long-term" investment.
My mentor used to telling me this: "If a short-term trade becomes a long-term investment, then you're in for a hell of a ride".
I have no clue if Bitcoin/BTC will go back up or not - I don't even care because I'm an intraday trader.
What if BTC was actually a way to accumulate more fiat? Satoshi fooled us
I coded this Mayer Multiple according to the specifications below. By the way, I'm a big fan of Willy Woo. I've been monitoring all his work since I learned about crypto (10 minutes ago.... it's a joke come on)
charts.woobull.com
Scaling
To respect the Mayer's multiple model, I recommend to select the Logarithmic scaling as shown below
imgur.com
What Mayer's model says
Using the reference below, the model says we're in the oversold zone. But, we can be in that zone for months/years...
When a model says an asset could bounce in a 1000-7000 USD range... well... I don't know how I would be able to perform optimally with that insight. This is very subjective and not a recommendation.
Mayer's Multiple model reference
All the BEST
Dave

Multi-Exchange Volume (30 Tickers) by kurtsmock + BV + rVolauthor: kurtsmock
Fully Customizable ticker set. Up to 30 Tickers. Bitcoin set as default.
-- IMPORTANT NOTE: --
30 Exchanges are a lot. It can take a while to load. You can fully customize this indicator to your liking. Here's how:
1. Load indicator
2. Open Settings
3. Uncheck the switch box for exchanges you want unincluded
4. At the bottom of the settings menu click "Defaults" and hit "Save as Default"
5. To turn them all back on, hit "Reset Settings" in that same "Defaults" menu and click "Save as Default" again.
Also, you don't have to use this with Bitcoin. This works with any asset, just change the ticker in the settings.
There's a lot going on with this indicator so the following is descriptions and instructions to help you better understand what's going on here. Thanks!
Goal:
- To provide a mechanism for assets on multiple exchanges to have their volume evaluated together
Edge:
- Having better and more complete volume information
Notes:
- The Default Exchanges for this indicator are highest volume bitcoin exchanges, but may contain "fake volume"
- Indicator is set for Bitcoin by default. However, you can change the tickers to reflect any asset you want
////// rVol //////
Goal:
- To understand how much volume is being executed relative to the same candle on previous days/periods
Edge:
- Higher rVol implies higher volatility and market interest.
- High rVol = higher than average volume . Markets move on volume so higher than average volume indicates increased market activity/volatility
- rVol is an indirect measure of active or anticipated volatility
Definitions:
- rVol: The volume of a period compared to the Average Volume of that same period in past sessions
- Important to note it does NOT add up the last 10 (default) candles, but rather the last 10 candles at session intervals.
- Example:
-- On a Tuesday, 1h chart it will add up the last ten Tuesday, 9:00 am candles, not including the current, active candle.
-- It then averages those lookback candles.
-- It then plots the percentage relationship between the most recent candle and the average of the lookback candles
-- Avg Vol of Lookback candles = 5000,
-- Volume of most recent candle = 4000: Output = rVol = 80:
-- Volume of most recent candle was 80% of the average volume in the 9 am time period of the last ten Tuesdays in the 9 am, 1h period
Notes:
- rVol does not add current candle volume into lookback sum. So, you set lookback to be: (not including the current day)
- rVol is on a switch. So, if you want to see rVol instead of volume, hit the switch in the settings
- If you want to see both, load 2 instances of the indicator.
////// Better-er Volume //////
Goal:
To Identify:
- When a candle closes at the highest volume * range relative to the lookback period and close > open
- When a candle closes at the highest volume * range relative to the lookback period and close < open
- When a candle closes at the highest volume / price relative to the lookback period
Edge:
- Identifies beginnings of price expansion, climax of price expansion, breakouts, pivots, and take profit points on the volume chart
Notes:
- Based generally on Barry Taylor's "Better Volume" indicator and ideas from Pascal Willain's book "Value in Time."
- Better-er Volume rules are applied to both Total Volume or rVol.
-- When rVol is displayed Better-er Volume is applied to rVol
-- When Total Volume is displayed Better-er Volume is applied to Total Volume
// Plot Key: //
Green Triangle Up = Often marks the beginning and/or end of price expansion to the upside
Red Triangle Up = Often marks the beginning and/or end of price expansion to the downside
Yellow Square = High Volume but Tight Range. Implies a Battle of Bulls and Bears. High Liquidity area. Provided Liquidity is not enough to move price. Thick Limit Order Book.
Purple Triangle Up or Down = Implies high market participation. Typically at the end of expansion when very significant s/r is hit
category: volume Volatility
tags: Volume rVol relativevolume Bitcoin cryptocurrency bettervolume
Many More Volume Indicators Coming Out Soon!

Relative Volume Combined With a Cumulative FunctionHi everyone
The today's script was suggested by a follower.
--------------------------------------
1 minute of Knowledge
--------------------------------------
Many traders look at volume as a pre-signal that a move may happen.
In trading, some say that "the volume precedes the movement".
This simply means that often volume will increase before a significant move in the stock.
Imagine if a unique trader is buying a crypto/stock. The volume is unlikely to move.
But, if all the mass goes to mass spot buy an asset, then we could see a volume spike announcing a potential upwards move.
---------------------------------------------
What's the story with that indicator?
---------------------------------------------
It's an interesting way of presenting the volume data.
Will show the total volume for the selected period.
You can choose between relative and cumulative presentation.
The users can display the consecutive rising volume above the 0 line and the failing volume below that line.
--------------------------------------
Mix knowledge with usefulness
--------------------------------------
A price making a higher/high (HH) or lower/low (LL) has a real and strong meaning- a HH or LL on a volume has a significant meaning also.
Increasing volume for a stock/crypto, could signify that buyers were willing to purchase a bigger number of shares at a higher price (comparatively to the day before)
Obviously, non-stop crazy buying/shorting won't work at some point - and that "some point" may hurt a bit.
Such volume indicator combined with others like momentum or strength indicators is a nice trading strategy.
The volume announces that a move may happen and the other indicators will confirm the prophecy :)
Peace
Dave
InfoPanel - SeasonalityThis panel will show which is the best month to buy a stock, index or ETF or even a cryptocurrency in the past 5 years.
Script to use only with MONTHLY timeframe.
Thanks to: RicardoSantos for his hard work.
Please use comment section for any feedback.

InfoPanel Divergence IndicatorThis panel spots divergences of some well knonw indicators. It may be usefull because you have all indicators in one panel only.
Also, you can check on chart which indicator gives better results of each pair on stock or index or crypto.
TO DO: to add custom indicators.
thanks to: RicardoSantos for his script of panel coding
Tradingview scripts
Other members of TV community (I cannot remember the source and inspiration of all snipets)
Please use comment section for any feedback.

Trend Confirmation Indicator - Triple OBVDear all, you might wonder is there a confirmation indicator that has a high hit rate, is dependable, and could rely on the information it gives you when making a decision?
Here I present an indicator I developed specifically for cryptocurrency, in the minds of eliminating fakeouts and traps.
Trend is always invalid then there is a lack of volume, so by tracking the momentum of price direction & volume, we can have a ballpark about where the market is moving to.
On balance volume
obvshort = ema3
obvmedium = ema9
obvlong = ema26
This is a lagging indicator, which means it's not good at predicting reversal.
This is also the reason why
long signal = obvshort > obvmedium and obvshort > obvlong
shortsignal = obvshort < obvmedium and obvshort < obvlong
both without obvmedium >< obvlong
This indicator will not lie to you.
At last
Save Hong Kong, the revolution of our time.

DAKELAX-XRPUSDT Bollinger Band Strategy for TradebotlerDAKELAX-XRPUSDT is a Tradebotler strategy designed to run on XRPUSDT for binance, it's a simple reverse to mean strategy and when backtested on may-aug 2019 on H1 timeframe it performs pretty well in backtest as well as running live.
In order to get started install the Tradebotler extension and connect the strategy with Binance or other crypto exchanges of your choice such as Kraken, Bitstamp, Bitmex, Bittrex, Polyneux etc, etc.

Hedging CryptocurrencyПри написании скрипта автор мотивировался статьей о хэджировании криптовалют . Для работы с данным скрипом необходима установить дневной таймфрейм.
Скрипт " Hedging Cryptocurrency ", по своей сути, является стохастическим осциллятором данных спрэда между ценой (годичной давности) на BTC и равноценным количестве выбранного альткоина. Стоит сразу заметить, что для корректного использования данного скрипта необходима выбирать инструмент вида XXX/USD (где XXX - выбранный альткоин, а USD - стабильный альткоин, привязанный к доллару). В настройках можно включать/выключать сигналы на покупку (зеленые точки) и продажу (красные точки) альткоина. Закрывать сделку можно, когда осциллятор перешагнет нулевую отметку. ВАЖНО, что для хэджирования криптовалют, при открытии сделки на альткоин, необходимо также открыть сделку и на BTC, но уже в обратном направлении. Кроме всего перечисленного сам осциллятор имеет градацию зеленых и красных оттенков, которые говорят об условной перекупленности и перепроданности соответственно. Добавлю, что индикатор чаще ошибается при низкой корреляции между инструментами, поэтому в такие моменты он начинает сигнализировать черными крестиками. В этих ситуациях скрипт не гарантирует ту точность, которую может предложить :-)
Само собой данный индикатор только инструмент, а его сигналы не являются абсолютно верными, поэтому с большим удовольствием почитаю в комментариях ваши предложения по его усовершенствованию.

Pump|Dump Tickerthis is just a study to investigate the pumps and dumps that have been happened in a crypto market and it should not be used as an indicator. this is also my very first Pine Script that I've written and I am sure it is not perfect. actually I am curious to know when (I mean the exact time of the day) most pumps and dumps happen as a self investigation. the method that is used to define pumps and dumps is not good (and I know that) but I will modify it for better result in next version.
to use this study, you should define whether you want to display pumps or dumps or both and also you should define percent of change (threshold).

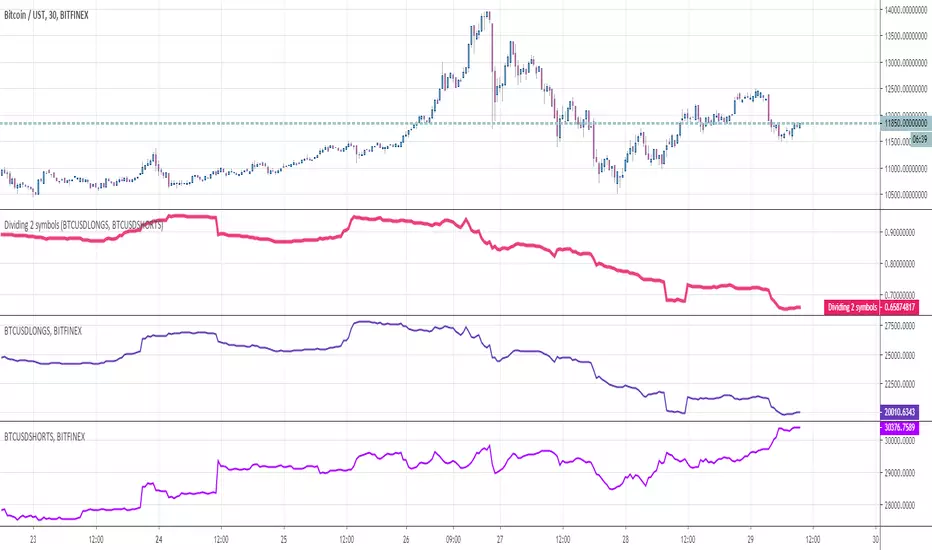
Dividing 2 symbolsHello Traders
This indicator is used to divide two assets between them. Why you would ask ?
For instance, in crypto trading, traders often look at the ratio Longs/Shorts or Shorts/Longs to figure out which side is leading the market and use this information as a powerful hedge for their next trade
Enjoy
Dave