MACD Volume S2 By Gammaprod>> How to use this indicator :
1. Set your teadingview theme to dark theme.
2. My indicator is valid for forex, stock and but more valid for crypto.
3. Use three timeframe for more validation (choose between those, that fit to your trading style) :
- Timeframe 1m, 5m, and 15m for Scalping
- Timeframe 30m, 1h and 4h for Intraday
- Timeframe 4h, 1D and 1W for Swing Trading
4 . Always use THREE INDICATORS FROM GAMMAPROD, those three indicators is back to back each other, by the way, I only made those three indicators only (for now) :
- Trendlines Boll Ichi Crypto by Gammaprod
- Stoch RSI Divs Zone Crypto by Gammaprod
- MACD Volume Crypto by Gammaprod
>> How to setting :
1. Trendlines Boll Ichi Crypto by Gammaprod
A. Support and Resistence
- Well if you familiar with this indicator you can add it, but recommended for Timeframe 30m or more
B. Trendlines Primary or Trendlines Secondary
- Timeframe 1m you DON'T NEED Trendlines Primary or Trendlines Secondary
- Timeframe 5m you DON'T NEED Trendlines Secondary, but you CAN ADD Trendlines Primary if you fell it helpful (for me, it is helpful to find where the candles start or the end trend or a consolidation or where the candles will surpass a resistance or a support).
- Timeframe 15m you DON'T NEED Trendlines Secondary, DEFENITELY add Trendlines Primary it will help to find where the candles stop or a consolidation or where the candles will surpass a resistance or a support).
- Timeframe 30m or more, DEFENITELY NEED BOTH Trendlines Primary and Secondary Trendlines, it will help to find where the candle stop or consolidation or where the candle will surpass a resistance or support).
C. Bolinger, Ichimoku Cloud and Lagging Span
- Please DON'T CHANGE IT at all, it's really helpful to know when and where to make an entry decesion or a trend or a consolidation, if you don't understand how to read it, you better to learn it first (on "how to read" section and "How to OPEN position" the section below)
2. Stoch RSI Divs Zone Crypto by Gammaprod (DON'T CHANGE IT)
3. MACD Volume Crypto by Gammaprod (DON'T CHANGE IT)
>> How to read :
1. Sell or Buy Priority :
A. Buy Priority
- Color background on macd and stoch rsi is pink or purple sell is the priority, (if you're not sure to buy, just wait until the best moment to sell)
B. Buy Priority
- Color background on macd and stoch rsi Teal or light green buy is the priority, (if you're not sure to sell, just wait until the best moment to buy)
C. Indecision / Golden Moment
- Color background on stoch rsi yellow is indecision / golden moment of reversal pattern (wait until it formed background only on Stoch RSI), please becareful at this moment.
2. Trend / Consolidation :
A. BULLISH trend
- When Stoch RSI and MACD have teal or light green background that's means BULLISH trend, better to confirm by the candle is above green cloud and lagging span (red line) is also above the candle.
B. BEARISH trend
- When Stoch RSI and MACD have the Pink or purple background that's means BEARISH trend, better to confirm by the candle is above purple cloud and lagging span (red line) is also below the candle.
C. CONSOLIDATION
- When Stoch RSI have the mix background that's means CONSOLIDATION, better to confirm by the candle is in or near to green / purple cloud and lagging span (red line) is also on the candle.
3. Special Mark
A. Ideal Bullish :
- Near line 20 and green / teal background = When Stoch RSI have the char R / H on lime color label, that's means divergence or hidden divergence for buy position, if you not see this label that's means just a standard confirmation for buy
B. Not an Ideal Bullish :
- Near line 80 and green / teal background = if this happens make sure you know what happen, it could be a false signal or bullish continual pattern
C. Ideal Bearish :
- Near line 80 and pink / purple background = When Stoch RSI have the char R / H on lime color label, that's means divergence or hidden divergence for buy position, if you not see this label that's means just a standard confirmation for sell position.
D. Not an Ideal Bearish:
- Near line 20 and pink / purple background = if this happens make sure you know what happen, it could be a false signal or bearish continual pattern
E. The Beginning of Reversal (from BEARISH to BULLISH) :
- When Stoch RSI line shaping GREEN position is near 20.
- MACD lines still PINK, position lines is UNDER the HISTOGRAM, but the HISTOGRAM start to SHAPE FALL PINK (light pink) and the BACKGROUND still PINK / PURPLE.
- Position CANDLES NEAR BLUE line, NEAR PURPLE CLOUD, and lagging span (red line) STILL ON the area candle. (it used to be confirmed with the golden moment).
F. The Beginning of Reversal (from BULLISH to BEARISH) :
- When Stoch RSI line shaping PINK position is near 80.
- MACD lines still GREEN, position lines is ABOVE the HISTOGRAM, but the HISTOGRAM start to SHAPE FALL GREEN (light green) and the BACKGROUND still TEAL / GREEN.
- Position CANDLES NEAR WHITE line, NEAR TEAL CLOUD, and lagging span (red line) STILL ON the area candle. (it used to be confirmed with the golden moment).
G. False Signals, or It could be a Golden Moment (better to see it on TF 15 or bigger):
- Near line 20 or 80 and yellow background = When Stoch RSI have the char R / H on color label, that's means divergence or hidden divergence for buy / sell position, if you not see this label that's means just a standard confirmation for buy / sell depends on where the Stoch RSI line if near 20 that's means buy, near 80 means sell
>> How to OPEN position:
A. Bullish
1. Trendlines Boll Ichi Crypto by Gammaprod
- The candles above the green cloud.
- Lagging span (red line) above the candles.
- then open buy near yellow line (the first option) / blue line (the second option) (always confirm the position with two other indicators below).
2. Stoch RSI Divs Zone Crypto by Gammaprod
- Teal or Green background.
- The lines is shaping green.
- Better if on the bottom (at a range 20).
3. MACD Volume Crypto by Gammaprod
- Teal or Green background.
- The lines is shaped or shaping green.
- Better if at the green histogram.
B. Bearish
1. Trendlines Boll Ichi Crypto by Gammaprod
- The candles below the purple cloud.
- Lagging span (red line) below the candles.
- then open buy near yellow line (the first option) / white line (the second option) (always confirm the position with two other indicators below).
2. Stoch RSI Divs Zone Crypto by Gammaprod
- Pink or purple background.
- The lines are shaping pink.
- Better if the line on the top (at a range 80).
3. MACD Volume Crypto by Gammaprod
- Pink or purple background.
- The lines are shaped or shaping green.
- Better if at the pink histogram.
C. Consolidation
1. Trendlines Boll Ichi Crypto by Gammaprod
- The candles on the cloud (green or purple).
- Lagging span (red line) on the candles.
- then open buy near the white or blue line (always confirm the position with two other indicators below).
2. Stoch RSI Divs Zone Crypto by Gammaprod
- Mix background specially on a timeframe 15m or more.
- The line move fast up and down.
- Better if on the bottom or the top of the lines (at a range 20 or 80).
3. MACD Volume Crypto by Gammaprod
- Changing the background.
- The line is near the middle line.
- Have small Histogram.
>> The secret ingridient is comparing the timeframe :
The example scalping (Timeframe 1m, 5m and 15m)
- TF 1m is for making an open position.
- TF 5m is for making a judgement of the trend market.
- TF 15m is to confirm that judgement from TF 5m, be careful if it not similar then it used to be a consolidation or the beginning of the reversal.
There's a lot a way to open the position than above information that i gave it to you, but consider there are a limit char on this column, I hope it will help your trading and make a more profit on it.
Cerca negli script per "crypto"

Stoch RSI, Div, Zone S3 by Gammaprod>> How to use this indicator :
1. Set your teadingview theme to dark theme.
2. My indicator is valid for forex, stock and but more valid for crypto.
3. Use three timeframe for more validation (choose between those, that fit to your trading style) :
- Timeframe 1m, 5m, and 15m for Scalping
- Timeframe 30m, 1h and 4h for Intraday
- Timeframe 4h, 1D and 1W for Swing Trading
4 . Always use THREE INDICATORS FROM GAMMAPROD, those three indicators is back to back each other, by the way, I only made those three indicators only (for now) :
- Trendlines Boll Ichi Crypto by Gammaprod
- Stoch RSI Divs Zone Crypto by Gammaprod
- MACD Volume Crypto by Gammaprod
>> How to setting :
1. Trendlines Boll Ichi Crypto by Gammaprod
A. Support and Resistence
- Well if you familiar with this indicator you can add it, but recommended for Timeframe 30m or more
B. Trendlines Primary or Trendlines Secondary
- Timeframe 1m you DON'T NEED Trendlines Primary or Trendlines Secondary
- Timeframe 5m you DON'T NEED Trendlines Secondary, but you CAN ADD Trendlines Primary if you fell it helpful (for me, it is helpful to find where the candles start or the end trend or a consolidation or where the candles will surpass a resistance or a support).
- Timeframe 15m you DON'T NEED Trendlines Secondary, DEFENITELY add Trendlines Primary it will help to find where the candles stop or a consolidation or where the candles will surpass a resistance or a support).
- Timeframe 30m or more, DEFENITELY NEED BOTH Trendlines Primary and Secondary Trendlines, it will help to find where the candle stop or consolidation or where the candle will surpass a resistance or support).
C. Bolinger, Ichimoku Cloud and Lagging Span
- Please DON'T CHANGE IT at all, it's really helpful to know when and where to make an entry decesion or a trend or a consolidation, if you don't understand how to read it, you better to learn it first (on "how to read" section and "How to OPEN position" the section below)
2. Stoch RSI Divs Zone Crypto by Gammaprod (DON'T CHANGE IT)
3. MACD Volume Crypto by Gammaprod (DON'T CHANGE IT)
>> How to read :
1. Sell or Buy Priority :
A. Buy Priority
- Color background on macd and stoch rsi is pink or purple sell is the priority, (if you're not sure to buy, just wait until the best moment to sell)
B. Buy Priority
- Color background on macd and stoch rsi Teal or light green buy is the priority, (if you're not sure to sell, just wait until the best moment to buy)
C. Indecision / Golden Moment
- Color background on stoch rsi yellow is indecision / golden moment of reversal pattern (wait until it formed background only on Stoch RSI), please becareful at this moment.
2. Trend / Consolidation :
A. BULLISH trend
- When Stoch RSI and MACD have teal or light green background that's means BULLISH trend, better to confirm by the candle is above green cloud and lagging span (red line) is also above the candle.
B. BEARISH trend
- When Stoch RSI and MACD have the Pink or purple background that's means BEARISH trend, better to confirm by the candle is above purple cloud and lagging span (red line) is also below the candle.
C. CONSOLIDATION
- When Stoch RSI have the mix background that's means CONSOLIDATION, better to confirm by the candle is in or near to green / purple cloud and lagging span (red line) is also on the candle.
3. Special Mark
A. Ideal Bullish :
- Near line 20 and green / teal background = When Stoch RSI have the char R / H on lime color label, that's means divergence or hidden divergence for buy position, if you not see this label that's means just a standard confirmation for buy
B. Not an Ideal Bullish :
- Near line 80 and green / teal background = if this happens make sure you know what happen, it could be a false signal or bullish continual pattern
C. Ideal Bearish :
- Near line 80 and pink / purple background = When Stoch RSI have the char R / H on lime color label, that's means divergence or hidden divergence for buy position, if you not see this label that's means just a standard confirmation for sell position.
D. Not an Ideal Bearish:
- Near line 20 and pink / purple background = if this happens make sure you know what happen, it could be a false signal or bearish continual pattern
E. The Beginning of Reversal (from BEARISH to BULLISH) :
- When Stoch RSI line shaping GREEN position is near 20.
- MACD lines still PINK, position lines is UNDER the HISTOGRAM, but the HISTOGRAM start to SHAPE FALL PINK (light pink) and the BACKGROUND still PINK / PURPLE.
- Position CANDLES NEAR BLUE line, NEAR PURPLE CLOUD, and lagging span (red line) STILL ON the area candle. (it used to be confirmed with the golden moment).
F. The Beginning of Reversal (from BULLISH to BEARISH) :
- When Stoch RSI line shaping PINK position is near 80.
- MACD lines still GREEN, position lines is ABOVE the HISTOGRAM, but the HISTOGRAM start to SHAPE FALL GREEN (light green) and the BACKGROUND still TEAL / GREEN.
- Position CANDLES NEAR WHITE line, NEAR TEAL CLOUD, and lagging span (red line) STILL ON the area candle. (it used to be confirmed with the golden moment).
G. False Signals, or It could be a Golden Moment (better to see it on TF 15 or bigger):
- Near line 20 or 80 and yellow background = When Stoch RSI have the char R / H on color label, that's means divergence or hidden divergence for buy / sell position, if you not see this label that's means just a standard confirmation for buy / sell depends on where the Stoch RSI line if near 20 that's means buy, near 80 means sell
>> How to OPEN position:
A. Bullish
1. Trendlines Boll Ichi Crypto by Gammaprod
- The candles above the green cloud.
- Lagging span (red line) above the candles.
- then open buy near yellow line (the first option) / blue line (the second option) (always confirm the position with two other indicators below).
2. Stoch RSI Divs Zone Crypto by Gammaprod
- Teal or Green background.
- The lines is shaping green.
- Better if on the bottom (at a range 20).
3. MACD Volume Crypto by Gammaprod
- Teal or Green background.
- The lines is shaped or shaping green.
- Better if at the green histogram.
B. Bearish
1. Trendlines Boll Ichi Crypto by Gammaprod
- The candles below the purple cloud.
- Lagging span (red line) below the candles.
- then open buy near yellow line (the first option) / white line (the second option) (always confirm the position with two other indicators below).
2. Stoch RSI Divs Zone Crypto by Gammaprod
- Pink or purple background.
- The lines are shaping pink.
- Better if the line on the top (at a range 80).
3. MACD Volume Crypto by Gammaprod
- Pink or purple background.
- The lines are shaped or shaping green.
- Better if at the pink histogram.
C. Consolidation
1. Trendlines Boll Ichi Crypto by Gammaprod
- The candles on the cloud (green or purple).
- Lagging span (red line) on the candles.
- then open buy near the white or blue line (always confirm the position with two other indicators below).
2. Stoch RSI Divs Zone Crypto by Gammaprod
- Mix background specially on a timeframe 15m or more.
- The line move fast up and down.
- Better if on the bottom or the top of the lines (at a range 20 or 80).
3. MACD Volume Crypto by Gammaprod
- Changing the background.
- The line is near the middle line.
- Have small Histogram.
>> The secret ingridient is comparing the timeframe :
The example scalping (Timeframe 1m, 5m and 15m)
- TF 1m is for making an open position.
- TF 5m is for making a judgement of the trend market.
- TF 15m is to confirm that judgement from TF 5m, be careful if it not similar then it used to be a consolidation or the beginning of the reversal.
There's a lot a way to open the position than above information that i gave it to you, but consider there are a limit char on this column, I hope it will help your trading and make a more profit on it.

V/T Ratio: Onchain BTC MetricThis is a New Onchain metric that is designed for bitcoin by myself Mjshahsavar (Ghoddusifar), and it is published for the first time in this trading view in this post.
I think this metric has a very high capability to determine the ATH and bottom of the market. This metric can solve a problem that channels are unable to solve. this could be the equivalent of what is known in the stock market as P/E
Calculations:
V/T RATIO = MA (7) of Log ((THE TOTAL VOLUME OF BITCOIN TRANSFERRED ONCHAIN IN USD)/(THE TOTAL AMOUNT OF TRANSACTIONS))
INTERPRETATION:
What is the long-term price channel of Bitcoin? Have you ever thought that maybe drawing a price channel is not right and maybe we should look for something else?
Channel drawing for the price is a subjective and interpretive subject. Look at the charts below, they are all correct in terms of drawing, but no one can say which one will happen. There is no certainty because drawing them is objective.
But who can say which one will definitely work?
We need something more objective. I think V/T Ratio does that.
Just draw the channel. There is only one channel for it. And it has worked historically well to this day.
Compare the drawn channel with the price chart. It works right. When the metric reaches the top line of the channel, it indicates the new ATH and the end of the cycle.
When it reaches the bottom line of the channel, it indicates that the price has reached the bottom.
A Market Cycle:
According to this metric, the bitcoin cycle has 5 stages:
1- Bottom Price: which V/T Ratio touches the bottom line of the channel: In this case, we expect the price to reach the bottom.
2- Semi-high price: that the metric reaches the middle line of the channel: In this case, Bitcoin creates a local top in the MID-Term and Long-Term timeframes
3- Semi-low price: which has a metric return to the lower part of the channel (but the price can still increase)
4- ATH: that Bitcoin reaches its highest historical price
5- It starts after the ATH until the metric reaches the bottom part of the channel again.

NVT Ratio: OnchainNVT Ratio
Defined as the ratio of market capitalization divided by transacted volume (in USD).
Network Value to Transactions Ratio (NVT Ratio) is defined as the ratio of market capitalization divided by transacted volume in the specified window.
History
NVT first made an appearance as a tweet on Woo Bull account in Feb 2017. In that tweet he promised an explanatory article which came much later in Oct 2017, first debuting on Forbes.
In Feb 2018, Dimitry Kalichkin published his work to improve NVT for use as a more responsive indicator, hence Kalichkin NVT Signal. In the same month, Woo Bull applied some trader techniques to NVT Signal and published an article summarising how to use it within a trading environment.
Interpretation:
NVT Ratio (Network Value to Transactions Ratio) is similar to the PE Ratio used in equity markets.
this indicator measures whether the blockchain network is overvalued or not.
When Bitcoin`s NVT is high, it indicates that its network valuation is outstripping the value being transmitted on its payment network, this can happen when the network is in high growth and investors are valuing it as a high return investment, or alternatively when the price is in an unsustainable bubble.
High: Overvalued Network worth - Bearish
Marketcap is too much valued compared to the low ability to transact coins in terms of volume
Low : Undervalued Network worth - Bullish
Marketcap is undervalued compared to the high ability to transact coins in terms of volume

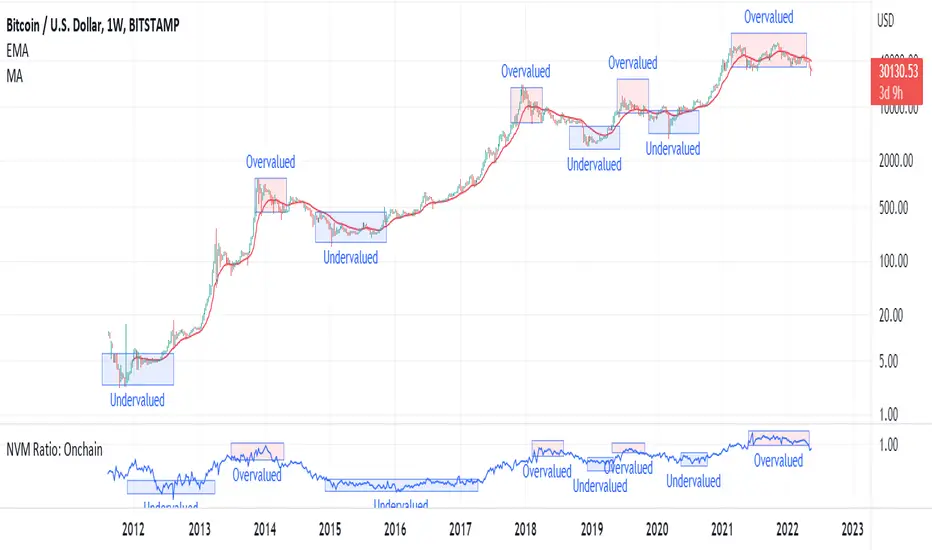
NVM Ratio: OnchainNetwork Value to Metcalfe Ratio (NVM Ratio) is defined as the ratio of the log of market capitalization divided by the log of the square of daily active addresses.
This oscillator evaluates bitcoin price according to the Metcalfe Ratio to show whether the current value of Bitcoin is higher or lower than the real price
in this oscillator, High values indicate the overvalued price, and low values indicate undervalued price.
Oversold RSI with tight SL Strategy (by Coinrule)This is one of the best strategies that can be used to get familiar with technical indicators and start to include them in your trading bot rules.
ENTRY
1. This trading system uses the RSI ( Relative Strength Index ) to anticipate good points to enter positions. RSI is a technical indicator frequently used in trading. It works by measuring the speed and change of price movements to determine whether a coin is oversold (indicating a good entry point) or overbought (indicating a point of exit/entry for a short position). The RSI oscillates between 0 and 100 and is traditionally considered overbought when over 70 and oversold when below 30.
2. To pick the right moment to buy, the strategy enters a trade when the RSI falls below 30 indicating the coin is oversold and primed for a trend reversal.
EXIT
The strategy then exits the position when the price appreciates 7% from the point of entry. The position also maintains a tight stop-loss and closes the position if the price depreciates 1% from the entry price. The idea behind this is to cut your losing trades fast and let your winners ride.
The best time frame for this strategy based on our backtesting data is the daily. Shorter time frames can also work well on certain coins, however in our experience, the daily works best. Feel free to experiment with this script and test it on a variety of your coins! With our backtesting data a trading fee of 0.1% is taken into account. The fee is aligned to the base fee applied on Binance, which is the largest cryptocurrency exchange by volume. In the example shown, this strategy made a handsome net profit of 39.31% on Chainlink with 61.54% of trades being profitable.

BTC Active1Y holders: OnchainUse this Indicator in The Weekly timeframe
This indicator is based on "Percent of Supply Last Active 1+ Years Ago".
This is so important indicator that shows " The percent of circulating supply that has not moved in at least 1 year."
It can show the situation of the holders who have been holding their coins for more than a year. When this indicator starts to decline, it means that the price has risen so much that the holders are selling their coins. When this indicator starts to increase, it means that the number of coins held has been increasing for more than a year. This is because the price is too low for investors.
This indicator can be used to indicate accumulation and distribution areas. When the indicator enters the overlow area (red) it means that the distribution is happening
When the indicator enters the overhigh range (blue), it means that accumulation is taking place by the holders

Scalping The Bull IndicatorName: Scalping The Bull Indicator
Category: Scalping, Trend Following, Mean Reversion.
Timeframe: 1M, 5M, 30M, 1D depending on the specific technique.
Technical Analysis: The indicator supports the operations of the trader named "Scalping The Bull" which uses price action and exponential moving averages.
Suggested usage: Altcoin showing strong trends for scalping and intra-day trades. Trigger points are used as entry and exit points and to be used to understand when a signal has more power.
It is possible to identify the following conformations:
Shimano: look at the price records of a consecutive series of closings between the EMA 60 and the EMA 223 when a certain threshold is reached. Use the trigger points as price structures to identify entry and exit zones (e.g. breakout of the yesterday high as for entry point) .
Bomb: look at the price registers a percentage variation in a single candle, greater than a threshold such as 2%, in particular on shorter timeframes and around the trigger points.
Viagra: look at there is a consecutive series of closes below the EMA 10.
Downward fake: look when, after a cross under (Death Cross), the price returns above the EMA 223 using the yesterday high as a trigger point.
Emergence: look at the EMA 60 is about to cross over the EMA 223.
Anti-crossing: look at, after an important price rise and a subsequent retracement, the EMA 60 is about to cross under the EMA 223 but a bullish impulse brings the price back above the EMAs.
For Sales: look at two types of situations: 1) when the price falls by more than 10% from the opening price and around the yesterday’s low or 2) when the price falls and then reaches, in the last 5 days, a bigger percentage and then breaks a trigger point.
Colour change: look at the opening price of the session - indicated as a trigger point.
Third touch of EMA 60: look for 3 touches below the EMA 60, and enter when there is a close above the EMA 60.
Third touch of EMA 223: look for 3 touches when there are 3 touches below the EMA 223, and enter when there is a close above the EMA 60.
Bud: look at price when it crosses upwards the average 10 and subsequently at least 2 "rest" candles are between the maximum and minimum of the breaking candle.
Fake on EMA 10: look for the open of a candle higher than the EMA 10, the minimum of the candle lower and the closing price returns above the EMA 10..
For Stop Loss and Profit Targets consider a proper R/R depending on Risk Management, using price structures such as the low of the entering candle and a quick Position Management moving quickly the Stop-Loss at Break-Even.
Configuration:
Market
EMA: The indicator automatically configure itself on market it knows (Binance, Piazza Affari and NASDAQ) otherwise it can be configured manually fo Crypto market (5/10/60/223) or Stock Market (5/10/50/200).
Additional Average: You can display an additional average, e.g. 20-period average.
Chart elements:
Session Separators: indicates the beginning of the current session (in blue)
Background: signals with the background in green an uptrend situation ( 60 > 223) and in red background a downtrend situation (60 < 223).
Trigger points:
Today's highs and lows: draw on the chart the opening price of the daily candle and the highs and lows of the day (high in purple, low in red and open in green)
Yesterday's highs and lows: draw on the chart the opening price of the daily candle, the highs and lows of the previous day (high in yellow, low in red).
Credits
Massimo : for refactoring and suggestions.

Scalping The BullNome: Scalping The Bull (Indicatore)
Categoria: Scalping, Trend Following, Mean Reversion.
Timeframe: 1M, 5M, 30M, 1D, secondo la conformazione specifica.
(follow description in english)
Analisi tecnica: l’indicatore supporta le operatività descritte nei video di YouTube del canale “Scalping The Bull”. Di norma si basa su price action e medie mobili esponenziali.
Le varie tecniche che possono essere usate insieme all’indicatore sono sintetizzate nei settaggi dell’indicatore e si può fare riferimento ai video specifici per la spiegazione completa.
Utilizzo consigliato: Altcoin che presentano forti trend per scalping e operazioni intra-day.
Configurazione: È possibile configurare lo strumento in maniera semplice e completa.
Medie:
Medie per mercato: e’ possibile utilizzare le medie mobili esponenziali (EMA) esclusivamente per il mercato Crypto (5/10/60/223).
Media addizionale: e’ possibile visualizzare una media aggiuntiva, e.g. a 20 periodi.
Elementi del grafico:
Sfondo: segnala con lo sfondo del grafico in verde una situazione di uptrend ( EMA 60 > EMA 223) e in rosso sfondo rosso una situazione di downtrend (EMA 60 < EMA 223).
Separatori di sessioni: indica l’inizio della sessione corrente.
Punti Trigger:
Massimi e minimi di oggi: disegna sul grafico il prezzo di apertura della candela daily e i massimi e i minimi di giornata.
Massimi minimi di ieri: disegna sul grafico il prezzo di apertura della candela daily, i massimi e i minimi del giorno prima.
(English description)
Name: Scalping The Bull (Indicator)
Category: Scalping, Trend Following, Mean Reversion.
Timeframe: 1M, 5M, 30M, 1D depending on the specific signal.
Technical Analysis: The indicator supports the operations described in the YouTube videos of the channel "Scalping The Bull". Usually it is based on price action and exponential moving averages.
The various techniques that can be used in conjunction with the indicator are summarized in the indicator settings and you can refer to the specific videos for the full explanation.
Suggested usage: Altcoin showing strong trends for scalping and intra-day trades.
Configuration:
Exponential Moving Averages
Per market: you can display averages exclusively for the Crypto market (5/10/60/223).
Additional Average: You can display an additional average, e.g. 20-period average.
Chart elements:
Session Separators: indicates the beginning of the current session.
Background: signals with the background in green an uptrend situation ( 60 > 223) and in red background a downtrend situation (60 < 223).
Trigger points:
Today's highs and lows: draw on the chart the opening price of the daily candle and the highs and lows of the day.
Yesterday's highs and lows: draw on the chart the opening price of the daily candle, the highs and lows of the previous day.

Open InterestSimple indicator that shows the open interest of whatever crypto contract you're looking at in candlestick form.
If it doesn't show anything then Tradingview doesn't have the open interest data for that contract.
At the time of publishing there's data for Binance, Bitmex and Kraken.
You can change the colors in the settings.

BTC HASHRATE DROP: OnchainWhy is the drop of hashrate important?
Drop of hashrate usually occurs because some miners in the mining network stop for working. There are several possible reasons for this. Such as new anti-mining regulations in some countries or a sharp drop in the price of bitcoin, which makes mining no longer affordable for some miners. So they turn off their devices
This reduces the supply of bitcoin in the market and according to the law of supply and demand can eventually lead to an increase in the price of bitcoin.
This oscillator is designed to detect hashrate drop. for this, we use the data of glassnode . Maroon color indicates decrease in hashrate and Red color indicates excessive hash rate drop. As can be seen on the chart, usually after this drop, we see an increase in the price of bitcoin

BTC NVM Ratio - Onchain AnalysisIt is an onchain oscillator and is designed to operate at weekly timeframes and is only for Bitcoin.
Network Value to Metcalfe Ratio (NVM Ratio) is defined as the ratio of the log of market capitalization divided by the log of the square of daily active addresses in the specified window.
This oscillator evaluates bitcoin price according to the Metcalfe Ratio to shows whether the current value of Bitcoin is higher or lower than the real price
I made this comparison using a moving average of 100. The areas that are red in the weekly timeframe indicate that bitcoin is Overvalued. and The areas that are blue in the weekly timeframe indicate that bitcoin is undervalued.

CryptoMettle - Crypto Market Support BandAs the name suggests, the Crypto Market Support Band has historically acted as a support band in bull runs. It refers to the band between the 20W Simple Moving Average (SMA) and 21W Exponential Moving Average (EMA).

Momentum CloudThis is a modified Ichimoku Cloud:
-The default Lookback-Length and Displacement settings have been modified to operate optimally on 24/7 markets - which is popular among Crypto analysts.
-The Lagging Span, Base Line, and Conversion Line have been removed - leaving just the bare cloud.
-Additionally, the Cloud's color will shift blue when it is compressed. (More specifically - when Leading Span A retreats to Leading Span B, the color changes.)
This allows the user to easily identify when the Cloud is "thinning", either to the upside, or the downside.
Being that the "spread" or "width" of an Ichimoku Cloud generally gauges it's efficacy as potential Support or Resistance, this tool is particularly useful for highlighting when momentum is weakening.
*This script will be updated in the future to allow the user to view the Momentum Cloud of alternate time-frames! (e.g, Viewing the 1D Momentum Cloud on the 1H timeframe)

Binance Open InterestIntro
A free and open source indicator that shows you open interest for Binance USDT and coin margin perpetual swap contracts, plotted as candlesticks.
Open interest means the total number of outstanding derivatives contracts, or in plain and simple English: the total amount of positions that traders have opened and still remain open.
Instructions
I've included data for a variety of cryptocurrencies that are quite popular right now.
However, since it's open source you can of course add any coin you want.
It's important to know that coin margin contracts have their open interest denominated in USD.
So if, for example, the ETH/USD perp shows a value of 470 million, that means 470 mil USD.
Tether margin contracts on the other hand are denominated in the coin itself.
So if, for example, the SOL/USDT perp shows a value of 1 million, that means 1 mil SOL worth of open contracts.
This is how the exchange created and denominated the contracts and I kept it this way to keep the data clean.
You could multiply that 1 mil SOL by the SOL price and it would show you the total open interest in USD terms of course, but that would make the candles look a bit funky.
If you look at the code you can see that for the coin margin contracts I've multiplied BTC open interest by a 100 and for altcoins I multiplied it by 10.
This is because of the Binance contract specifications, they use a multiplier of a 100 for bitcoin and altcoins have a multiplier of 10.
If you google "Binance Trading Rules of coin-margined Contracts" you'll find this info.
Some coins only have a USDT margin perp and not a coin margin perp.
YFI for example doesn't have a coin margin perp, but it is included in the list.
So if you select YFI and choose "coin margin" the indicator won't show anything.
The indicator still works, just select a different contract and you'll see open interest data appear again.
Access
It's free so just favourite it and you'll be able to add it to your chart and use it.
And it's also open source so you could just copy the code and make your own version of it.
Cheers.

Smart RebalanceThis script is based on the portfolio rebalancing strategy. It's designed to work with cryptocurrencies, but it can work with any market.
How portfolio rebalance works?
Let's assume your initial capital is $1000, and you want to distribute it into 4 coins. This script takes the USDT as the stable coin for the initial money, so in case you want other currency, the pairs must be with that fiat as the quote.
Following our example, you would take BTC, ETH, BNB, and FTT. After selecting the coins, it's time to choose how much allocation is on each. Let's put 25% on each. This way, $250 of our capital on each coin.
After selecting the coins and their allocation, you choose the price change ratio for rebalancing. Let's use 1%. Next, you start to watch the markets. The first thing that happens, following our example, is the BTCUSDT price moving 1% up.
That amount hit the ratio of 1% for the rebalance. Hence, you sell 1% of BTC for USDT and redistribute to the other coins, buying 0.25% of each currency to rebalance the portfolio.
Next, ETHUSDT goes 1% down, time to rebalance again. This time, you need to take 0.33% of each other coin and buy ETH, so this way, it's all divided as the chosen allocation.
Why use rebalancing?
Looks easy, right? It is, but very time demanding. Demands even more if you raise the number of coins you want to distribute. Having a system to do that automatically is a must to work efficiently. Rebalancing spreads the risk among multiple currencies. This way, you earn small when it goes up, but you lose small when it goes down.
What this script helps with portfolio rebalance?
This indicator will not buy/sell for you but will help you choose the best markets for your rebalancing. Which coin will work best in that period? Do I need to have more than 8 coins? How much must be my ratio? Those questions you can answer using this indicator.
What this script has?
Start and End dates
The script will work for a certain period. All calculations will be done in that period.
Coin Ratio %
The amount of price movement of each asset that will be used to calculate the rebalancing
Initial Capital and Broker Fee
The amount of capital to be used on the rebalancing and the broker fee you want to use the strategy. The cost will be applied on every trade, buying or selling the coins.
Assets, allocations, and colors
It's possible to select from 2 to 10 assets to be used on the portfolio. Each purchase must have the allocation %. Suppose the sum of the allocations is different from 100%. In that case, a warning message will appear on the chart instead of the statistics.
Panel and tooltips
There is a panel with a summary of the results
Set allocations automatically
There is an option to make the indicator use the daily asset volume from the day before to determine the allocation percentage of each asset. This option is better if you are unsure how much allocation you want to use on each coin.
Use this indicator as a backtest for your rebalancing strategy. The selected market on the chart will not affect the calculation on this indicator, but the time frame will. The higher the time frame, the higher the coin ratio % must be.
About the code
The code is written to use arrays to store the values of each asset, making the calculations on each candle inside the time range. The for-loops are used to reduce the code length and make it easy to change the analysis of all assets. Finally, the script has some comments on the code.

Double SupertrendThis strategy is based on a custom indicator that was created based on the Supertrend indicator. At its core, there are always 2 super trend indicators with different factors to reduce market noise (false signals).
The strategy/indicator has some parameters to improve the signals and filters.
TECHNICAL ANALYSIS
☑ Show Indicators
This option will enable/disable the Supertrend indicators on the chart.
☑ Length
The length will be used on the Supertrend Indicator to calculate its values.
☑ Dev Fast
The fast deviation or factor from one of the super trend indicators. This will be the leading indicator for entry signals, as well as for the exit signals.
☑ Dev Slow
The slow deviation or factor from one of the super trend indicators. This will be the confirmation indicator for entry and exit signals.
☑ Exit Type
It's possible to select from 4 options for the exit signals. Exit signals always take profit target.
☑ ⥹ Reversals
This option will make the strategy/indicator calculate the exit signals based on the difference between the given period's highest and lowest candle value (see Period on this list). It's displayed on the chart with the cross. As it's possible to verify in the image below, there are multiple exit spots for every entry.
☑ ⥹ ATR
Using ATR as a base indicator for exit signals will make the strategy/indicator place limit/stop orders. Candle High + ATR for longs, Candle Low - ATR for shorts. The strategy will show the ATR level for take profit and stick with it until the next signal. This way, the take profit value remains based on the candle of the entry signal.
☑ ⥹ Fast Supertrend
With this option selected, the exit signals will be based on the Fast Supertsignal value, mirrored to make a profit.
☑ ⥹ Slow Supertrend
With this option selected, the exit signals will be based on the Slow Supertsignal value, which is mirrored to take profit.
☑ Period
This will represent the number of candles used on the exit signals when Reversals is selected as Exit Type. It's also used to calculate the gradient used on the Fills and Supertrend signals.
☑ Multiplier
It's used on the take profit when the ATR option is selected on the Exit Type.
STRATEGY
☑ Use The Strategy
This will enable/disable the strategy to show the trades calculations.
☑ Show Use Long/Short Entries
Option to make the strategy show/use Long or Short signals. Available only if Use The Strategy is enabled
☑ Show Use Exit Long/Short
Option to make the strategy show/use Exit Long or Short signals (valid when Reversals option is selected on the Exit Type). Available only if Use The Strategy is enabled
☑ Show Use Add Long/Short
Option to make the strategy show/use Add Long or Short signals. With this option enabled, the strategy will place multiple trades in the same direction, almost the same concept as a pyramiding parameter. It's based on the Fast Supersignal when the candle fails to cross and reverses. Available only if Use The Strategy is enabled
☑ Trades Date Start/End
The date range that the strategy will check the market data and make the trades
HOW TO USE
It's very straightforward. A long signal will appear as a green arrow with a text Long below it. A short signal will appear as a red arrow with a text Short above it. It's ideal to wait for the candle to finish to validate the signal.
The exit signals are optional but give a good idea of the configuration used when backtesting. Each market and timeframe will have its own configuration for the best results. On average, sticking to ATR as an exit signal will have less risk than the other options.
☑ Entry Signals
Follow the arrows with Long/Short texts on them. Wait for the signal candle to close to validate the entry.
☑ Exit Signals
Use them to close your position or to trail stop your orders and maximize profits. Select the exit type suitable for each timeframe and market
☑ Add Entries
It's possible to increase the position following the add margin/contracts based on the Add signals. Not mandatory, but may work as reentries or late entries using the same signal.
☑ What about Stop Loss?
The stop-loss levels were not included as a separated signal because it's already in the chart. There are some possible ideas for the stop loss:
☑⥹ Candle High/Low (2nd recommend option)
When it's a Long signal from the entry signal candle, the stop loss can be the Low value of the same candle. Very tight stop loss in some cases, depending on the candle range
☑⥹ Local Top/Bottom
Selecting the local top/bottom as stop loss will give the strategy more room for false breakouts or reversals, keeping the trade open and minimizing noises. Increases the risk
☑⥹ Fast Supertrend (1st recommend option)
The fast supertrend can be used as stop-loss as well. making it a moving level and working close to trail stop management
☑⥹ Fixed Percentage
It's possible to use a fixed risk percentage for the trades, making the risk easier to control and project. Since the market volatility is not fixed, this may affect the accuracy of the trades
☑⥹ Based on the ATR (3rd recommend option)
When the exit type option ATR is selected, it will display the take profit level for that entry. Just mirror that value and put it as stop-loss, or multiply that amount by 1.5 to have more room for market noise.
EXAMPLE CONFIGURATIONS
Here are some configuration ideas for some markets (all of them are from crypto, especially futures markets)
BTCUSDT 15min - Default configuration
BTCUSDT 1h - Length 10 | Dev Fast 3 | Dev Slow 4 | Exit Type ATR | Period 50 | Multiplier 1
BTCUSDT 4h - Length 10 | Dev Fast 2 | Dev Slow 4 | Exit Type ATR | Period 50 | Multiplier 1
ETHUSDT 15min - Length 20 | Dev Fast 1 | Dev Slow 3 | Exit Type Fast Supertrend | Period 50 | Multiplier 1
IOTAUSDT 15min - Length 10 | Dev Fast 1 | Dev Slow 2 | Exit Type Slow Supertrend | Period 50 | Multiplier 1
OMGUSDT 15min - Length 10 | Dev Fast 1 | Dev Slow 4 | Exit Type Slow Supertrend | Period 50 | Multiplier 1
VETUSDT 15min - Length 10 | Dev Fast 3 | Dev Slow 4 | Exit Type Slow Supertrend | Period 50 | Multiplier 1
HOW TO FIND OTHER CONFIGURATIONS
Here are some steps to find suitable configurations
select a market and time frame
enable the Use This Strategy option on the strategy
open the strategy tester panel and select the performance summary
open the strategy configuration and go to properties
change the balance to the same price of the symbol (example: BTCUSDT 60.000, use 60.000 as balance)
go back to the inputs tab and keep changing the parameters until you see the net profit be positive and bigger than the absolute value of the drawdown
in case you can't find a suitable configuration, try other timeframes
Since the tester reflects what happened in the past candles, it's not guaranteed to give the same results. However, this indicator/Strategy can be used with other indicators as a leading signal or confirmation signal.

40 crypto screener [LUPOWN]// ENGLISH
This indicator shows two tables, with 10 assets each, they can be currencies, stocks or cryptos, the columns can be changed to the information you want to see, among the options are price or change (change in percentage of the candle in the temporality where you are seeing it), TL are buy or sell signals according to the Latin trading strategy (Squeeze momentum combined with ADX) buy if the momentum changes to range or rise and the ADX has a negative slope, sell if the momentum changes to range or fall and The ADX has a negative slope, the signals are not 100% effective, you must support it with price action and market speculation, directionality in the momentum, slope of the ADX, if there is divergence in the momoentum squeeze, lux something and cipher use an indicator of Lazy bear, lux something signals when two wave trends cross and the cipher signals when the wave trend crosses above or below the 0 point.
You can choose between seeing one or two tables, this so that it can be seen on small screens, there is also the option to hide the tables and show the label, which is also an alternative to see it on small screens
i got the main idea from @QuantNomad
//SPANISH
Este indicador muestra dos tablas, con 10 activos cada una, pueden ser divisas, acciones o cryptos, las columnas se pueden cambiar a la información que quieras ver, entre las opciones están precio o cambio (cambio en porcentaje de la vela en la temporalidad donde lo estes viendo), TL son señales de compra o venta según estrategia de trading latino (Squeeze momentum combinado con ADX) compra si el momentum cambia a rango o subida y el ADX tiene pendiente negativa, venta si el momentum cambia a rango o caída y el ADX tiene pendiente negativa, las señales no son 100% efectivas debes apoyarla con la acción del precio y especulación del mercado, direccionalidad en el momentum, pendiente del ADX, si hay divergencia en el squeeze momoentum, lux algo y cipher utilizan un indicador de Lazy bear, lux algo da señal cuando dos wave trend se cruzan y el cipher da señal cuando el wave trend cruza por encima o debajo del punto 0.
Puedes elegir entre ver una o dos tablas, esto para que se pueda ver en pantallas pequeñas, también esta la opción de ocultar las tablas y mostrar el label, que también es una alternativa para verlo en pantallas pequeñas
La idea principal la tome de @QuantNomad

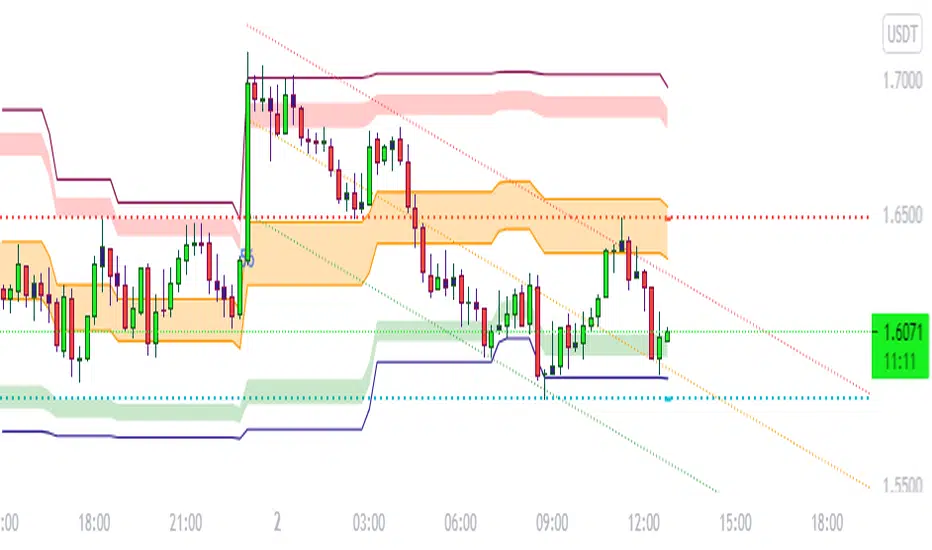
Rolling VWAP - Vhunt Scalper botBINANCE:ADAUSDTPERP
Modified VWAP to use scalping in lower timeframe.
Use 1minute TF for best results but can also use up to 30min.
This indicator is made for crypto but may also work for other assets.
The bands serve as support and resistance and used for opening quick profit position if conditions below are met:
Indicators:
Blue - modified rolling vwap
Orange - Band1
Green - Band2
Opening position Conditions:
Long:
Band2 < Band1
Price < Band2
Short:
Band2 > Band1
Price > Band2

Bjorgum AutoTrailOne Time Trade Risk Management
Incorporating the new interactive feature, this script is meant as a one time trailing stop for the active trader to manage positional risk of an ongoing trade. As a crypto trader or Fx trader, many may find themselves in a position late into the evening, or perhaps daily life is calling while a trade progresses in their favor. Adding a trailing stop to a position thats trending can help to keep you in the trade and lock in gains if things turn around when you are unable to react.
To use the trail, the user would add the script to the chart. Once added, a set of crosshairs will appear allowing the user to choose a point to begin. Often choosing to start a trail from a swing high/ low can be an ideal option. This tends to provide some protection for a stop by placing it under support for a long trade or above resistance for a short trade.
Price based trail
The trail will automatically plot and the offset is a factor of the distance from price action selected by the crosshairs. If placed above price action the script will plot a short trail, if placed below it will trail for a long position.
Additionally, there are several other trail types other than price based. There is also percent based, which offsets the trail as a percent from close. A hard stop is placed at the cross hair value, then once the distance is exceeded by the percentage specified, the trail begins.
There are 2 more volatility based trails. There is a PSAR trail which can provide quicker and tighter stops that accelerate with the trend locking in gains faster, and an ATR trail that keeps a distance from price action as a function of volatility. Volatility levels can be adjusted from the menu.
Volatility based trail (ATR)
Volatility based trail (PSAR)
Lastly, within the code for more the more technical savvy, is some starting setups for string alerts to be sent to exchanges via 3rd party or custom API applications. Some string manipulation is required for specific providers to meet their requirements, but there is some building block alerts that will take the ticker symbol, recognize the asset your trading (Fx, Crypto, etc) and take input quantity or exchange names from the settings via inputs.
Complex strings can be built to perform almost any trade related task when to comes to alerts via web hook. A little setup this way with some technology to back your system can mean a semi-automated half man, half machine setup that actually manages your trail stop while you cannot. For those that don’t go this far, there is some basic alert functionality that well trigger when a trail is hit so you can react and make a decision.
Please note that for now, interactive mode is engaged only when the script is added to the chart. Additional stops, or for adjustments to be made it is best to add a new version. Also as real trades could be at play managing an actual position, alerts are designed to go off only once to ensure no duplicate orders are sent meaning alerts are not reoccurring. Once an alert is triggered, a new trail is to be set up.
A modified version of the TradingView built in SAR equation was used in this script. To provide the value of the SAR on the stop candle, it was necessary to alter the equation to extract this value as the regular SAR “flips” at this point. Thank you to TradingView for supplying access to the built in formula so that this SAR could behave the same as the built-in function outside of these alterations
Example of SAR value maintained in trigger candle
Cheers and happy trading.

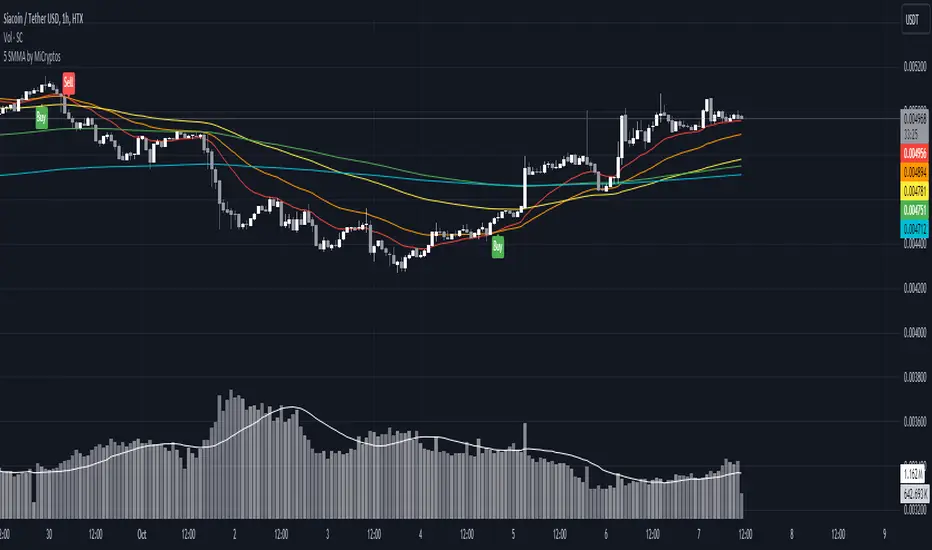
5 SMMA - by MiCryptoGives you the 5 most common SMMA for crypto in day trading:
- 10
- 21
- 50
- 100
- 200
This can be configured as you want.
Hope this can help you to get more indicators in a free plan.
Tickers PanelCONCEPT
It's a very straight forward panel with tickers for both BTC and ETH (you can switch in the settings).
The background colouring changes based on how individual markets are trading compared to a market average.
It shows green if a market is trading above the average price and it shows grey if it's trading below the average.
This makes it easy to spot which markets are cheap/expensive.
This is jus a random idea, but the source code is open so that you can make your own changes if you like.
FEATURES
Tickers for six different markets.
By default it shows BTC prices, but you can also choose for it to show ETH prices.
Sometimes it gets blocked by price.
So there's an option to put it at the bottom of the screen.
There's more possible, just look at the source code.
I use a widescreen so for me the size of the boxes is perfect, but if you're on different resolution it might look weird.
Also if you split your screen in half for example it probably won't perfectly fit anymore.
In the settings you can easily change the colours, width, height, border thickness, ...
So yeah, just a fun panel with some crypto tickers.
Have a look at the source code it's pretty easy to understand, have fun playing around with it.
The indicator is free so just add it to your favourites and you can start using it (you might have to refresh Tradingview before it works).
Cheers.

BULLSEYE BORDERS (Combined Price Action Follower)Developed for Crypto Currency Market! Use for 15 minutes period or more! Under 15 minutes, results are unpredictible.
This script had been orginized with Donchian Lines based on support and resistance levels.
Rules:
If the price is under top line, you will be ready for short position, and over the bottom line, long position.
When the price passes the red and green area you can take action and enter the trade!
Orange area refers the squeezed or floating position, so you can either stop or wait for price action!
If you see boring candles frequently, check out the last high and low levels.
If the price close to the last high, take long position. If not, short position.
Use ALMA , if you want to put and alert on script. It is identical to price line.
Thanks to @millerrh for 'Breakout Trend Follower'. Just used the last low and high features to complete the script. Combined with 'Boring Candles' from ©Prasad Raut, Modified on 20190811 (Updated to %30 full candle)
Trend Tip: You can use the script with Linear Channel so you can also see the trend. (not always)