BTC EMA 5-9 Flip Strategy AutobotThis strategy is designed for fast and accurate trend-following trades on Bitcoin.
It uses a crossover between EMA 5 and EMA 9 to detect instant trend reversals and automatically flips between Long and Short positions.
How the strategy works
EMA 5 crossing above EMA 9 → Long
EMA 5 crossing below EMA 9 → Short
Automatically closes the opposite trade during a flip
Executes trades only on candle close
Prevents double entries with internal position-state logic
Fully compatible with automated trading via webhooks (Delta Exchange)
Why this strategy works
EMA 5–9 is extremely responsive for BTC’s volatility
Captures trend reversals early
Works best on 15-minute timeframe
Clean, simple logic without over-filtering reduces missed opportunities
Performs well in both uptrends and downtrends
Automation Ready
This strategy includes alert conditions and webhook-ready JSON for automated execution.
This is a fast-reacting BTC bot designed for intraday and swing crypto trend trading.
Cerca negli script per "crypto"

MOMO – Imbalance Trend (SIMPLE BUY/SELL)MOMO – Imbalance Trend (SIMPLE BUY/SELL)
This strategy combines trend breaks, imbalance detection, and first-tap supply/demand entries to create a clean and disciplined trading model.
It automatically highlights imbalance candles, draws fresh zones, and waits for the first retest to deliver precise BUY and SELL signals.
Performance
On optimized settings, this strategy shows an estimated 57%–70% win-rate, depending on the asset and timeframe.
Actual performance may vary, but the model is built for consistency, discipline, and improved decision-making.
How it works
Detects trend structure shifts (BOS / Break of Trend)
Identifies displacement (imbalance) candles
Creates supply and demand zones from imbalance origin
Waits for first tap only (no second chances)
Confirms direction using trend logic
Generates clean BUY/SELL arrows
Automatic SL/TP based on user settings
Features
Clean BUY/SELL markers
Auto-drawn supply & demand zones
Trend break markers
Imbalance tags
Smart first-tap confirmation
Customizable stop loss & take profit
Works on crypto, gold, forex, indices
Best on M5–H1 for day trading
Note
This strategy is designed for day traders who want clarity, structure, and zero emotional trading.
Use it with discipline — and it will serve you well.
Good luck, soldier.

macd sma20
### MACD_sma20 – Multi-Timeframe MACD Pullback & SMA20 Dashboard
This script is a complete trading toolkit built around a **MACD pullback strategy** combined with **multi-timeframe SMA20 filters**, volume analysis, and a compact information panel.
It is designed for traders who like to:
* Trade **MACD pullbacks above the moving average**
* Track **key SMA20 levels across multiple timeframes** (Daily, 3-Day, Weekly, Monthly)
* Quickly see whether **current price is above or below those reference levels**
* Use **clean visual signals** for entries and exits, instead of staring at raw indicator values
---
### Core Features
#### 1. MACD Pullback Long Signal (Green Triangle Up)
The script detects a **bullish MACD pullback** pattern:
* MACD line is still **above** the signal line
* Both MACD line and histogram **pull back** for several bars
* Then MACD turns back up again, with price trading **above the local SMA20**
When this “pullback and re-acceleration” is confirmed, a **green triangle below the bar** is plotted as a **long entry signal**.
There is also an optional filter:
* **Weekly SMA20 filter**:
If enabled, long signals are only triggered when **current price is above the Weekly SMA20**, helping you stay on the right side of the higher-timeframe trend.
---
#### 2. Bearish Pullback Confirmation Signal (Red Triangle Down)
On the short side, the script detects a **bearish pullback confirmation** based on:
* A recent **high-volume bearish candle** (large down bar with volume above a multiple of the 20-period volume average)
* At least a minimum number of **negative MACD histogram bars**
* MACD line moving closer to the signal line (loss of momentum)
* Price recovering back up near the **top of that high-volume bearish candle**, then starting to fall again while MACD stays positive
When all conditions align, the script prints a **red triangle above the bar**, indicating a **bearish pullback confirmation** – often a good area to take profits on longs or consider short/hedge setups.
---
#### 3. Signal History Tracking
For both long and short signals, the script internally tracks the **most recent three signals**:
* Timestamp of the signal
* Price at the signal
* Short-term percentage change into the signal
This is mainly for internal use and future expansion, but already gives you a structured signal history if you want to extend or connect the logic later.
---
### Multi-Timeframe SMA20 Dashboard (Bottom-Right Panel)
One of the most useful parts of this script is the **compact dashboard table** in the **bottom-right corner** of the chart. It updates in real time and shows:
1. **Current Price**
2. **Daily SMA20** – value + whether price is above/below
3. **3-Day SMA20** – value + whether price is above/below
4. **Weekly SMA20** – value + whether price is above/below
5. **Monthly SMA20** – value + whether price is above/below
6. **RSI** (current timeframe)
For each timeframe’s SMA20:
* If **price ≥ SMA20**, the status cell is **green** with a ✓
* If **price < SMA20**, the status cell is **red** with a ✗
This gives you, at a glance:
* Is the market in a **short-term uptrend or downtrend** (Daily SMA20)?
* Is the **swing / position trend** healthy (3D & Weekly SMA20)?
* Is the broader **macro structure** supportive (Monthly SMA20)?
You don’t need to manually switch timeframes or add multiple moving averages – the script does all of that for you automatically using `request.security`.
---
### Alerts
The script comes with two built-in alert conditions:
* **MACD回踩转多信号 (MACD pullback bullish signal)**
* **空头回抽确认信号 (Bearish pullback confirmation signal)**
You can attach TradingView alerts to these conditions to get notified whenever a new long or bearish-confirmation setup appears, even when you’re not watching the chart.
---
### How to Use It in Your Trading
1. **Choose your main trading timeframe**
* For intraday swing: 15m / 1h / 4h
* For swing / position: 4h / Daily
2. **Watch the bottom-right SMA20 panel**
* If most higher-timeframe SMA20 rows are **green**, you are trading **with the larger trend**.
* If they are **mixed or mostly red**, you’re either counter-trend or in a choppy transition zone.
3. **Use the green MACD pullback signals**
* Prefer long setups when:
* The **Weekly and Monthly SMA20 rows are green**, and
* The signal appears **above the Daily SMA20**
* This stacks multiple edges: trend + pullback + momentum re-acceleration.
4. **Use the red bearish confirmation signals for risk management**
* Take partial profits on longs when a red signal appears near resistance.
* Consider hedge/short opportunities if higher-timeframe SMA20 rows are already red or turning red.
5. **Use RSI as a context indicator**
* Combine with overbought/oversold zones or your own RSI thresholds for additional confirmation.
---
### Why This Script Is Useful
* **Trend awareness across timeframes**:
You always know where current price sits relative to the Daily / 3-Day / Weekly / Monthly SMA20 – without switching charts.
* **Clear, rule-based signals**:
The MACD logic is explicit and systematic, focused on **pullbacks within trends** rather than random crossovers.
* **Volume-aware bearish logic**:
High-volume bearish candles often mark important supply zones. The script builds this idea directly into the short-side confirmation logic.
* **Visual and intuitive**:
Green/Red triangles + Green/Red table cells make it easy to interpret even if you are not a heavy indicator user.
* **Flexible**:
All key parameters (MACD lengths, SMA length, volume threshold, lookback period, RSI length, weekly filter) are customizable, so you can adapt it to different markets (crypto, stocks, FX) and timeframes.
---
In short, this script is a **multi-timeframe MACD pullback system with an integrated SMA20 dashboard**, suitable for swing traders and position traders who want a structured, visually clean way to align entries with trend and momentum while keeping an eye on higher-timeframe levels.

Multi-Confluence Signal System📊 OPTIMIZED MULTI-CONFLUENCE SIGNAL SYSTEM
A professional-grade trading indicator that combines multiple technical analysis methods to generate high-probability buy and sell signals. Designed for daily timeframe Bitcoin/crypto trading with optimized parameters based on real market backtesting.
🎯 KEY FEATURES:
- Multi-Confluence Scoring (8 components) - Each signal shows strength rating
- Smart Top & Bottom Detection - Catches reversals using price action patterns
- Ichimoku Cloud Integration - Dynamic support/resistance visualization
- Dual EMA System (20/50) - Clear trend identification
- RSI + MACD + Volume Confirmation - Multi-indicator validation
- Signal Alternation - Only shows directional changes (no repeated signals)
- Minimal Bar Spacing - Prevents signal clustering and overtrading
✅ OPTIMIZED FOR:
- Catching parabolic tops with rejection wicks
- Identifying capitulation bottoms in downtrends
- Avoiding false signals during consolidation
- 4-8 quality signals per 4-month period on daily charts
- Works in both trending and volatile markets
🔧 TECHNICAL COMPONENTS:
- EMA 20/50 trend system
- RSI (14) with adjusted overbought/oversold levels (68/32)
- MACD for momentum confirmation
- Ichimoku Cloud for trend context
- Volume analysis (1.3x threshold)
- Candlestick pattern recognition (engulfing, hammers, shooting stars)
- Capitulation detection for extreme moves
- Price extension filters (±5-10% from EMAs)
⚠️ BEST PRACTICES:
- Optimized for Daily timeframe
- Combine with your own risk management
- Higher scores = higher probability trades
- Wait for signal confirmation on candle close
- Use in conjunction with key support/resistance levels
💡 SIGNAL LOGIC:
BUY signals trigger on: Capitulation candles, extreme oversold + reversal patterns, MACD turnarounds in downtrends, or high confluence scores with bullish patterns
SELL signals trigger on: Rejection wicks at tops, bearish engulfings with overbought RSI, parabolic extensions, MACD reversals, or high confluence scores with bearish patterns
📈 Created through iterative backtesting and optimization on Bitcoin price action from 2024-2025.
⭐ Free to use • Leave feedback • Happy trading!

@MO_XBT - EMA/MA ToolkitClean set of EMAs & MAs I use for trend tracking, momentum shifts, and cross signals
If you found this useful, follow me on X: @mo_xbt
Easy [CHE] Easy — Minimalist Pine Script for detecting EMA direction changes to define fixed price zones for simple support and resistance visualization, ideal for manual trading workflows.
Summary
This indicator's programming is kept minimalist and super simple, with core logic in under 20 lines for easy comprehension and modification. It creates fixed price zones based on divergences between a base exponential moving average and its smoother counterpart, helping traders spot potential consolidation or reversal areas without dynamic adjustments. By locking the zone at the high and low of the signal bar, it avoids over-expansion in volatile conditions, offering a stable reference line colored by price position relative to the zone. This approach differs from expanding channels by prioritizing simplicity and persistence until a new qualifying signal, reducing visual clutter while highlighting directional bias through midpoint coloring.
Motivation: Why this design?
Traders often face noisy signals from moving averages that flip frequently in sideways markets or lag during breakouts, leading to premature entries or missed opportunities. This indicator addresses that by focusing on confirmed direction shifts between the base and smoothed averages, then anchoring a non-expanding zone to capture the initial price range of the shift. The result is a cleaner tool for marking equilibrium levels, assuming price respects these bounds in ranging or mildly trending conditions.
What’s different vs. standard approaches?
- Reference baseline: Traditional moving average crossovers or simple channels that update every bar.
- Architecture differences:
- Zones are set only on new divergence signals and remain fixed until reset by a gap from the prior zone.
- No ongoing high-low expansion; relies on persistent variables to hold bounds across bars.
- Midpoint plotting with conditional coloring based on close position, plus a highlight for zone initiations.
- Practical effect: Charts show persistent horizontal references instead of drifting lines, making it easier to gauge if price is rejecting or embracing the zone—useful for avoiding false breaks in low-volatility setups.
How it works (technical)
The indicator first computes a base exponential moving average of closing prices over a user-defined length, then applies a second exponential moving average to smooth that base. It checks if both the base and smoothed values are increasing or decreasing compared to their prior values, indicating aligned direction. A signal triggers when this alignment breaks, marking a potential shift.
On a new signal, if the current bar's high and low fall outside any existing zone (or none exists), the zone bounds update to those extremes and persist via dedicated variables. The midpoint of these bounds becomes the primary plot line, colored green if below the close (bullish lean), red if above (bearish lean), or gray otherwise. A secondary thick line highlights the midpoint briefly when a zone first sets, aiding visual confirmation. No higher timeframe data or external fetches are used, so updates occur on each bar close without lookahead.
Parameter Guide
EMA Length — Sets the period for the base moving average; longer values smooth more, reducing signal frequency but increasing lag. Default: 50. Trade-offs/Tips: Shorter for faster response in intraday charts (risks noise); longer for daily trends (may miss early shifts).
Smoother Length — Defines the period for the secondary smoothing on the base average; higher values dampen minor wiggles for stabler direction checks. Default: 3. Trade-offs/Tips: Keep low (2–5) for sensitivity; increase to 7+ if zones trigger too often in choppy markets, at cost of delayed signals.
Reading & Interpretation
The main circle plot at the zone midpoint serves as a dynamic equilibrium line: green suggests price is above the zone (potential strength), red indicates below (potential weakness), and gray shows containment within bounds (neutral consolidation). A sudden thick foreground line at the midpoint flags a fresh zone start, prompting review of the prior bar's context. Absence of a plot means no active zone, implying reliance on price action alone until the next signal.
Practical Workflows & Combinations
- Trend following: Enter long on green midpoint after a higher low touches the zone lower bound, confirmed by structure like higher highs; filter shorts similarly on red with lower highs.
- Exits/Stops: Use the opposite zone bound as a conservative stop (e.g., below lower for longs); trail aggressively to midpoint on strong moves, tightening near gray neutrality.
- Multi-asset/Multi-TF: Defaults work across forex and stocks on 1H–Daily; for crypto volatility, shorten EMA Length to 20–30. Pair with volume oscillators for confirmation, avoiding isolated use.
Behavior, Constraints & Performance
- Repaint/confirmation: Plots update on bar close using historical closes, so confirmed signals hold; live bars may shift until close but without future references.
- security()/HTF: Not used, eliminating related repaint risks.
- Resources: Minimal overhead—no loops, arrays, or bar limits exceeded; suitable for real-time on any timeframe.
- Known limits: Fixed zones may lag in strong trends (price drifts away without reset); signals skip if no gap from prior zone, potentially missing clustered shifts. Assumes standard OHLC data; untested on non-equity assets.
Sensible Defaults & Quick Tuning
Start with EMA Length at 50 and Smoother Length at 3 for balanced daily charts. If signals fire too frequently (e.g., in ranges), extend EMA Length to 100 for fewer but stabler zones. For sluggish response in trends, drop Smoother Length to 2 and EMA Length to 30, monitoring for added noise. In high-vol setups, widen both to 75/5 to filter extremes, trading speed for reliability.
What this indicator is—and isn’t
This is a lightweight visualization layer for EMA-driven zones, aiding manual chart reading and basic signal spotting. It is not a standalone system, predictive model, or automated alert generator—integrate with broader analysis like market structure and risk rules. (Unknown/Optional: No built-in alerts or multi-timeframe scaling.)
Disclaimer
The content provided, including all code and materials, is strictly for educational and informational purposes only. It is not intended as, and should not be interpreted as, financial advice, a recommendation to buy or sell any financial instrument, or an offer of any financial product or service. All strategies, tools, and examples discussed are provided for illustrative purposes to demonstrate coding techniques and the functionality of Pine Script within a trading context.
Any results from strategies or tools provided are hypothetical, and past performance is not indicative of future results. Trading and investing involve high risk, including the potential loss of principal, and may not be suitable for all individuals. Before making any trading decisions, please consult with a qualified financial professional to understand the risks involved.
By using this script, you acknowledge and agree that any trading decisions are made solely at your discretion and risk.
Do not use this indicator on Heikin-Ashi, Renko, Kagi, Point-and-Figure, or Range charts, as these chart types can produce unrealistic results for signal markers and alerts.
Best regards and happy trading
Chervolino

Range breaking indicatorDescription
Bull/Bear Area Ratio (last N candles) helps identify potential end-of-range situations by analyzing the relative strength of bullish vs bearish candles over a rolling window of N bars.
Instead of simply counting up or down candles, this script measures the "area" of each candle — the absolute distance between open and close, optionally weighted by volume.
By summing these areas over the last N bars, it calculates the percentage of bullish and bearish energy within that period.
When both sides become balanced (near 50/50), it often signals range exhaustion or possible trend transition.
How it works
Calculates the bullish and bearish area of each candle (abs(close - open), optionally × volume).
Maintains rolling buffers of the last N bars to compute running totals.
Plots both Bullish % (green) and Bearish % (red).
Highlights possible range-ending zones when the bullish ratio nears 50% ± threshold.
Displays a label showing the current balance.
Includes an alert condition when equilibrium is detected.
Inputs
Number of candles (N) – Rolling window length.
Use volume weighting – Multiplies each candle’s area by its volume.
Balance threshold (%) – Sensitivity for detecting equilibrium (default: 10%).
Best use
Combine with volume or volatility indicators to confirm market compression or expansion.
Use on higher timeframes (H1, H4, D1) to detect early signs of accumulation or distribution.
Works across all asset types: crypto, forex, stocks, indices, etc.
Alerts
An alert is triggered when:
“The range of the last N candles is balanced (possible end of range).”

ATR Channel (Bottom & Top)The ATR Channel (Bottom & Top) indicator dynamically visualizes market volatility zones based on the Average True Range (ATR). It automatically builds adaptive upper and lower boundaries around the current price, helping traders identify potential market extremes, volatility-driven reversals, and dynamic support/resistance levels.
This version is specifically optimized for Bitcoin (BTCUSDT) but works with any asset or timeframe.
⚙️ How It Works
The indicator calculates ATR over a user-defined period (default 200) and applies separate multipliers for the top and bottom bands (default ×1).
The Top Band = Close + (ATR × Multiplier)
The Bottom Band = Close - (ATR × Multiplier)
These two adaptive bands create a volatility envelope, allowing traders to visualize where the price may encounter potential exhaustion or reversal zones.
💡 Signal Logic
LONG Signal (Green Tab):
Triggered when the low of the candle touches or dips below the ATR bottom line — suggesting a possible oversold or volatility-based bottoming area.
The label displays the exact ATR line value (not the close), formatted for better readability (e.g. “LONG\n103 885”).
SELL Signal (Red Tab):
Triggered when the high of the candle touches or exceeds the ATR top line — signaling possible overbought conditions or an exhaustion zone.
Signal Filtering:
The script intelligently avoids duplicate signals — e.g., multiple consecutive LONGs or SELLs will not appear until the opposite signal is triggered.
This ensures cleaner visualization and reduces signal noise during consolidation periods.
🎯 Features
✅ Adaptive ATR-based volatility channel
✅ Automatic LONG/SELL signal labeling with real ATR-touch prices
✅ Customizable parameters:
✅ Intelligent filtering (one signal per phase)
✅ Works on any market and timeframe (crypto, forex, indices, stocks)
🧭 Trading Applications
Identify volatility extremes (ATR-based overbought/oversold zones)
Detect reversal points or exhaustion moves after extended trends
Use with trend filters (e.g. EMA200) to confirm trend continuation vs mean reversion setups
Combine with oscillators (RSI, Stoch) for confluence signals
📊 Summary
The ATR Channel (Bottom & Top) provides a clear, professional-grade visualization of volatility dynamics and price extremes.
It is especially useful for traders using mean-reversion, volatility breakout, or swing-trading strategies — helping them identify statistically significant reaction zones and improving trade timing precision.

Rage of UltronRage of Ultron - Multi-Timeframe Smart Money Trading System
Advanced Confluence-Based Trading Indicator
Rage of Ultron is a comprehensive multi-timeframe trading system that combines Smart Money Concepts (SMC) with macro market context, RSI divergences, liquidity sweeps, and volume analysis to identify high-probability setups across all markets.
Key Features
Multi-Timeframe Alignment
* Weekly Bias - Directional trend context
* Daily Structure - Order Blocks and Fair Value Gaps
* 4H Confirmation - Entry timing and execution
* Real-time MTF alignment scoring (🟢 Bull Aligned / 🔴 Bear Aligned / 🟡 Mixed)
Smart Money Concepts
* Order Blocks (OB) - Institutional entry zones with visual clarity
* Fair Value Gaps (FVG) - Price imbalances and retracement magnets
* Change of Character (CHoCH) - Market structure breaks (▲▼)
* Liquidity Sweeps - Stop hunt detection before reversals (💧)
Technical Analysis
* RSI Divergences - Regular and hidden divergences with zones (◆)
* RSI Swing Failure Patterns - Grade-A reversal setups (★)
* Automatic Fibonacci - Dynamic retracements and extensions
* Volume Impulse Detection - Weighted confirmation signals
Macro Market Radar
* DXY - Dollar strength assessment
* BTC Dominance - Crypto market risk gauge
* USDT Dominance - Stablecoin flow analysis
* Combined risk environment scoring
Confluence Scoring System (0-7)
Quantified setup quality with three alert tiers:
* Tier 1 (Score 6-7): Full confluence + sweep + volume + MTF alignment
* Tier 2 (Score 5): High confluence + volume or sweep
* Tier 3 (Score 4): Standard confluence setups
"Rage" Volume State
* 🟢 RAGE PULSE - Explosive volume spike (score 6+ trigger)
* ⚡ Active - Strong volume with good confluence
* 🟡 Stable - Moderate volume conditions
* 🔴 Dormant - Low volume, wait for confirmation
Visual Design
* Clean Zone Rendering - Persistent OB/FVG boxes with limited extension
* Signal Bar Highlighting - Colored fills and contrasting borders for instant recognition
* Dynamic Symbol Placement - ATR-based offset prevents overlap
* Comprehensive Panel - Real-time macro + trade metrics in one view
* Toggleable Legend - Learn signals, hide once familiar
How to Use
1. Set Your Timeframes - Default 1W/1D/4H works for swing trading
2. Monitor Macro Environment - Check risk-on/off context
3. Wait for Confluence ≥4 - Let multiple signals align
4. Enter on Tier 1/2 Alerts - Best probability setups
5. Use Fib Extensions for Targets - Systematic profit taking
Customizable Settings
* Multi-timeframe periods
* RSI length and divergence sensitivity
* Liquidity sweep parameters
* Fibonacci swing lookback
* Volume thresholds
* Shape offset multiplier
* Visual toggles (Fibs, extensions, legend)
Built-in Alert System
Three-tier alert structure lets you filter by setup quality. Set alerts for Tier 1 only for highest conviction trades, or include Tier 2 for more opportunities.
Best Practices
* Use on clean timeframes - 1H+ for less noise
* Combine with support/resistance - Zones near key levels = highest probability
* Respect the macro - Don't fight extreme risk-off environments
* Wait for the full stack - Best trades have 4+ aligned signals
* Practice on demo first - Learn signal behavior in your market
Works On
* Cryptocurrency (spot & futures)
* Forex pairs
* Stock indices
* Individual stocks
* Commodities
Note: This indicator identifies potential setups but does not guarantee profits. Always use proper risk management, position sizing, and stops. Past performance does not predict future results.
Created by cdotgnz | For educational purposes

Squeeze Go Momentum Pro [KingThies] █ OVERVIEW
The Squeeze Momentum Pro indicator identifies volatility compression phases and breakout opportunities by comparing Bollinger Bands to Keltner Channels. When price consolidates (squeeze), the bands contract inside the channels, signaling an imminent breakout. The momentum histogram shows directional bias, helping traders anticipate which way price will move when the squeeze releases.
This indicator displays in a separate panel below the price chart, providing clear visual signals without cluttering price action.
█ KEY FEATURES
Momentum Histogram
The histogram is the primary visual element, displaying momentum strength and direction with four distinct color states:
• Dark Green (#00C853) — Strong bullish momentum that is increasing. This signals strengthening upward pressure and potential continuation.
• Light Green (#26A69A) — Bullish momentum that is decreasing. Price remains in bullish territory but upward force is weakening.
• Dark Red (#D32F2F) — Strong bearish momentum that is increasing. This signals strengthening downward pressure and potential continuation.
• Light Red (#EF5350) — Bearish momentum that is decreasing. Price remains in bearish territory but downward force is weakening.
The color intensity provides immediate feedback on momentum strength and trend health.
Squeeze State Indicator
Colored dots on the zero line communicate the current volatility state:
• Orange Dots — Squeeze is ON. Bollinger Bands have contracted inside Keltner Channels, indicating consolidation and low volatility.
A breakout is building and traders should prepare for directional movement.
• Green Dots — Squeeze is OFF. Bollinger Bands have expanded outside Keltner Channels, indicating active momentum and higher volatility.
Price is moving with conviction in the current direction.
• Gray Dots — Neutral state. The bands are transitioning between squeeze states.
Release Triangles
Triangle shapes mark the exact bar when a squeeze releases, providing precise entry timing:
• Green Triangle Up — Bullish squeeze release. The squeeze has ended with positive momentum, suggesting a long setup opportunity.
• Red Triangle Down — Bearish squeeze release. The squeeze has ended with negative momentum, suggesting a short setup opportunity.
Information Panel
A compact dashboard in the top-right corner displays real-time trading intelligence:
• Squeeze Status — Current state: ON, OFF, or NEUTRAL with color coding
• Momentum Direction — Current bias: BULL or BEAR
• Momentum Value — Precise numerical reading of momentum strength
• Trading Signal — Actionable status: LONG SETUP, SHORT SETUP, WAIT, or MONITOR
Configurable Parameters
All calculation inputs are adjustable to match your trading style and timeframe:
• BB Length — Bollinger Bands period (default: 20)
• BB StdDev — Bollinger Bands standard deviation multiplier (default: 2.0)
• KC Length — Keltner Channels period (default: 20)
• KC ATR Multiplier — Keltner Channels range multiplier (default: 1.5)
• Momentum Length — Linear regression period for momentum calculation (default: 20)
Alert System
Four alert conditions notify you of critical trading opportunities:
• Bullish Squeeze Release — Squeeze has released with bullish momentum, indicating a potential long entry
• Bearish Squeeze Release — Squeeze has released with bearish momentum, indicating a potential short entry
• Squeeze Started — Volatility compression detected, prepare for upcoming breakout
• Squeeze Ended — Volatility expansion confirmed, breakout is active
█ TRADING METHODOLOGY
The indicator follows a clear four-step process for identifying and trading squeeze breakouts:
1 - Wait for Orange Dots . When orange dots appear on the zero line, a squeeze is building. This indicates price consolidation and declining volatility.
Do not enter trades during this phase. Instead, prepare by identifying key support and resistance levels and potential breakout directions.
2 - Watch for Release Triangle . When a triangle appears, the squeeze has released and a breakout is beginning. This is your entry signal.
The triangle color (green up or red down) combined with the histogram direction indicates the breakout direction.
3 - Confirm with Histogram Direction . Check the momentum histogram for directional confirmation:
• Green histogram + green triangle up = Go long. Bullish momentum supports upward breakout.
• Red histogram + red triangle down = Go short. Bearish momentum supports downward breakout.
4 - Monitor Momentum Intensity . Stay in the trade while histogram bars maintain their dark, intense color.
When colors lighten (dark green to light green, or dark red to light red), momentum is weakening and you should consider taking profits or tightening stops.
█ INTERPRETATION GUIDE
Squeeze Detection Logic
A squeeze occurs when Bollinger Bands contract inside Keltner Channels. This happens when:
• Standard deviation of price decreases (BB narrows)
• Price consolidates within a tight range
• Volatility compresses to unsustainable levels
The orange dots signal this condition, warning traders that explosive movement is imminent.
Squeeze Release Logic
A squeeze releases when Bollinger Bands expand outside Keltner Channels. This happens when:
• Price volatility increases sharply
• Price breaks out of consolidation
• Volume typically expands (check volume separately)
The green dots and release triangles signal this condition, indicating the direction and timing of the breakout.
Momentum Reading
The histogram uses linear regression to calculate momentum relative to the midpoint of the recent range:
• Above Zero : Price is trading above the range midpoint with bullish pressure
• Below Zero : Price is trading below the range midpoint with bearish pressure
• Increasing Bars : Momentum is strengthening in the current direction (darker color)
• Decreasing Bars : Momentum is weakening in the current direction (lighter color)
█ BEST PRACTICES
• Timeframe Selection — The indicator works on all timeframes but performs best on 15-minute to daily charts.
Lower timeframes may produce more false signals due to noise.
• Confluence Trading — Combine squeeze releases with support/resistance levels, trend lines, or other indicators for higher probability setups.
• Volume Confirmation — Check that squeeze releases occur with increasing volume. Low volume breakouts are more likely to fail.
• Multiple Timeframe Analysis — Check higher timeframes for overall trend direction. Trade squeeze releases that align with the larger trend.
• Parameter Adjustment — Increase BB and KC lengths for smoother signals on higher timeframes. Decrease for more sensitive signals on lower timeframes.
█ LIMITATIONS
• The indicator does not predict breakout direction before the squeeze releases. The momentum histogram provides bias but is not definitive until the breakout occurs.
• False breakouts can occur, particularly in choppy or low-volume market conditions. Always use proper risk management and stop losses.
• The indicator works best in trending markets. In deeply ranging markets with no clear direction, squeeze signals may be less reliable.
• Momentum calculations use linear regression which can lag during extremely fast price movements. Confirm signals with price action.
█ NOTES
This implementation uses linear regression for momentum calculation rather than simple moving averages, providing more responsive and accurate directional signals. The four-color histogram system gives traders nuanced feedback on momentum strength that binary color schemes cannot provide.
The indicator automatically adjusts to any symbol and timeframe without modification, making it suitable for stocks, forex, crypto, and futures markets.
█ CREDITS
Squeeze methodology inspired by John Carter's TTM Squeeze indicator. Momentum calculation and visual design optimized for modern trading workflows.

Top Finder & Dip Hunter [BackQuant]Top Finder & Dip Hunter
A practical tool to map where price is statistically most likely to exhaust or mean-revert. It builds objective support for dips and resistance for tops from multiple methodologies, then filters raw touches with volume, momentum, trend, and price-action context to surface higher-quality reversal opportunities.
What this does
Draws a Dip Support line and a Top Resistance line using the method you select, or a blended hybrid.
Evaluates each touch/penetration against Quality Filters and assigns a 0–100 composite score.
Prints clean DIP and TOP signals only when depth/extension and quality pass your thresholds.
Optionally annotates the chart with the computed quality score at signal time.
Why it’s useful
Objectivity: Converts vague “looks extended” into rules, reduces discretion creep.
Signal hygiene: Filters raw touches using trend, volume, momentum, and candle structure to avoid obvious traps.
Adaptable regimes: Switch methods, sensitivity, and lookbacks to match choppy vs trending conditions.
How support and resistance are built
Pick one per side, or use “Hybrid.”
Dynamic: Anchors to the extreme of a lookback window, padded by recent ATR, so buffers expand in volatile periods and contract when calm.
Fibonacci: Uses the 0.618/0.786 retracement pair inside the current swing window to target common reaction zones.
Volatility: Uses a moving-average basis with standard-deviation bands to capture statistically stretched moves.
Volume-Weighted: Centers off VWAP and penalizes deviations using dispersion of price around VWAP, helpful on intraday instruments.
Hybrid: A weighted average of the above to smooth out single-method biases.
When a touch becomes a signal
Depth/extension test:
Dips must penetrate their support by at least Min Dip Depth % .
Tops must extend above resistance by at least Min Top Rise % .
Quality Score gate: The composite must clear Min Quality Score . Components:
Trend alignment: Favor dips in bullish regimes and tops in bearish regimes using EMAs and RSI.
Volume confirmation: Reward expansion or spikes versus a 20-period baseline.
RSI context: Prefer oversold for dips, overbought for tops.
Momentum shift: Look for short-term momentum turning in the expected direction.
Candle structure: Reward hammer/shooting-star style responses at the level.
How to use it
Pick your regime:
Range/chop, small caps, mean-revert intraday → Volatility or Volume Weighted .
Cleaner swings/trends → Dynamic or Fibonacci .
Unsure or mixed conditions → Hybrid .
Set windows: Start with Lookback = 50 for both sides. Increase in higher timeframes or slow assets, decrease for fast scalps.
Tune sensitivity: Raise Dip/Top Sensitivity to widen buffers and reduce noise. Lower to be more aggressive.
Gate with quality: Begin with Min Quality Score = 60 . Push to 70–80 for cleaner swing entries, relax to 50–60 for scalps.
Act on first prints: The script only fires on new qualified events. Use the score label to prioritize A-setups.
Typical workflows
Intraday futures/crypto: Volume-Weighted or Volatility methods for both sides, higher Sensitivity , require Volume Filter and Momentum Filter on. Look for DIP during opening drive exhaustion and TOP near late-session fatigue.
Swing equities/FX: Dynamic or Fibonacci with moderate sensitivity. Keep Trend Filter on to only take dips above the 200-EMA and tops below it.
Countertrend scouts: Lower Min Dip Depth % / Min Top Rise % slightly, but raise Min Quality Score to compensate.
Reading the chart
Lines: “Dip Support” and “Top Resistance” are the current actionable rails, lightly smoothed to reduce flicker.
Signals: “DIP” prints below bars when a qualified dip appears, “TOP” prints above for qualified tops.
Scores: Optional labels show the composite at signal time. Favor higher numbers, especially when aligned with higher-timeframe trend.
Background hints: Light highlights mark raw touches meeting depth/extension, even if they fail quality. Treat these as early warnings.
Tuning tips
If you get too many false DIP signals in downtrends, raise Min Dip Depth % and keep Trend Filter on.
If tops appear late in squeezes, lower Top Sensitivity slightly or switch top side to Fibonacci .
On assets with erratic volume, prefer Volatility or Dynamic methods and down-weight the Volume Filter .
For strict systems, increase Min Quality Score and require both Volume and Momentum filters.
What this is not
It is not a blind reversal signal. It’s a structured context tool. Combine with your risk plan and higher-timeframe map.
It is not a guarantee of mean reversion. In strong trends, expect fewer, higher-score opportunities and respect invalidation quickly.
Suggested presets
Scalp preset: Lookback 30–40, Sensitivity 1.2–1.5, Quality ≥ 55, Volume & Momentum filters ON.
Swing preset: Lookback 75–100, Sensitivity 1.0–1.2, Quality ≥ 70, Trend & Volume filters ON.
Chop preset: Volatility/Volume-Weighted methods, Quality ≥ 60, Momentum filter ON, RSI emphasis.
Input quick reference
Dip/Top Method: Choose the model for each side or “Hybrid” to blend.
Lookback: Swing window the levels are built from.
Sensitivity: Scales volatility padding around levels.
Min Dip Depth % / Min Top Rise %: Minimum breach/extension to qualify.
Quality Filters: Trend, Volume, Momentum toggles, plus Min Quality Score gate.
Visuals: Colors and whether to print score labels.
Best practices
Map higher-timeframe trend first, then act on lower-timeframe DIP/TOP in the trend’s favor.
Use the score as triage. Skip mediocre prints into news or at session open unless score is exceptional.
Pre-define stop placement relative to the level you used. If a DIP fails, exit on loss of structure rather than waiting for the next print.
Bottom line: Top Finder & Dip Hunter codifies where reversals are most defensible and only flags the ones with supportive context. Tune the method and filters to your market, then let the score keep your playbook disciplined.

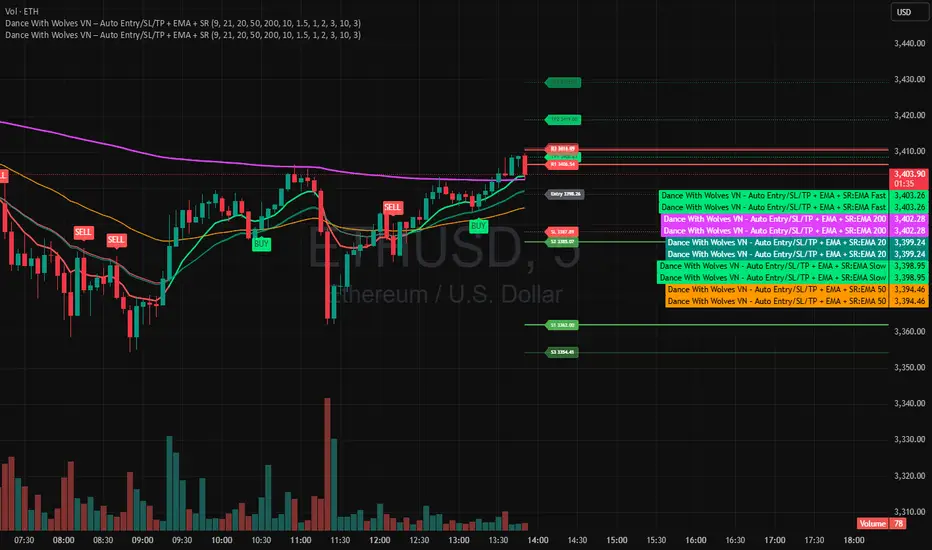
Dance With Wolves VN PublicDance With Wolves VN
Indicator kết hợp EMA 9/21 để vào lệnh nhanh, thêm EMA 20/50/200 để xem trend lớn.
Tự tạo Entry, SL, TP1, TP2, TP3 theo ATR.
Vẽ luôn 3 mức kháng cự (R1–R3) và 3 mức hỗ trợ (S1–S3) từ pivot gần nhất.
Dùng tốt cho khung 1m–15m với crypto, stock, futures.
Dance With Wolves VN — Smart EMA Strategy
This indicator combines EMA 20/50/200 trend tracking, automatic Buy/Sell signals, Take Profit & Stop Loss levels, and Support/Resistance zones.
It helps traders identify clean entries, manage risk with visual TP/SL targets, and follow market trends with clarity.
Created by Dance With Wolves VN — a community project for traders who value discipline, teamwork, and precision.
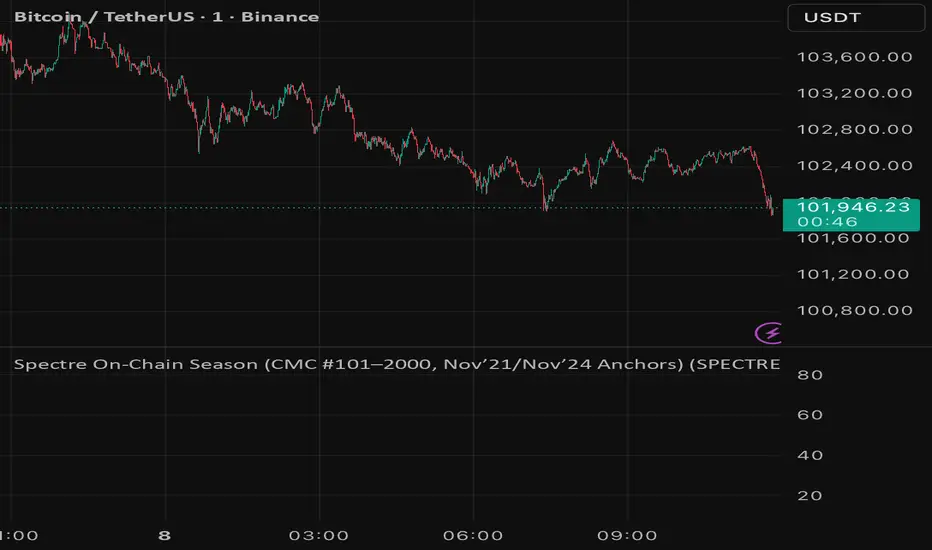
Spectre On-Chain Season (CMC #101–2000, Nov’21/Nov’24 Anchors)Spectre On-Chain Season Index measures the real health of the on-chain market by focusing on the mid-tail of crypto — not Bitcoin, not ETH, not the Top 100.
Instead of tracking hype at the top of the market, this index looks at coins ranked #101–#2000 on CoinMarketCap and compares their current price performance to their cycle highs from:
November 2021 peak
November 2024 peak
Ben's BTC Macro Fair Value OscillatorBen's BTC Macro Fair Value Oscillator
Overview
The **BTC Macro Fair Value Oscillator** is a non-crypto fair value framework that uses macro asset relationships (equities, dollar, gold) to estimate Bitcoin's "macro-driven fair value" and identify mean-reversion opportunities.
"Is BTC cheap or expensive right now?" on the 4 Hour Timeframe ONLY
### Key Features
✅ **Macro-driven**: Uses QQQ, DXY, XAUUSD instead of on-chain or crypto metrics
✅ **Dynamic weighting**: Assets weighted by rolling correlation strength
✅ **Mean-reversion signals**: Identifies when BTC is cheap/expensive vs macro
✅ **Validated parameters**: Optimized through 5-year backtest (Sharpe 6.7-9.9)
✅ **Visual transparency**: Live correlation panel, fair value bands, statistics
✅ **Non-repainting**: All calculations use confirmed historical data only
### What This Indicator Does
- Builds a **synthetic macro composite** from traditional assets
- Runs a **rolling regression** to predict BTC price from macro
- Calculates **deviation z-score** (how far BTC is from macro fair value)
- Generates **entry signals** when BTC is extremely cheap vs macro (dev < -2)
- Generates **exit signals** when BTC returns to fair value (dev > 0)
### What This Indicator Is NOT
❌ Not a high-frequency trading system (sparse signals by design)
❌ Not optimized for absolute returns (optimized for Sharpe ratio)
❌ Not suitable as standalone trading system (best as overlay/confirmation)
❌ Not predictive of short-term price movements (mean-reversion timeframe: days to weeks)
---
## Core Concept
### The Premise
Bitcoin doesn't trade in a vacuum. It's influenced by:
- **Risk appetite** (equities: QQQ, SPX)
- **Dollar strength** (DXY - inverse to risk assets)
- **Safe haven flows** (Gold: XAUUSD)
When macro conditions are "good for BTC" (risk-on, weak dollar, strong equities), BTC should trade higher. When macro conditions turn against it, BTC should trade lower.
### The Innovation
Instead of looking at BTC in isolation, this indicator:
1. **Measures how strongly** BTC currently correlates with each macro asset
2. **Builds a weighted composite** of those macro returns (the "D" driver)
3. **Regresses BTC price on D** to estimate "macro fair value"
4. **Tracks the deviation** between actual price and fair value
5. **Signals mean reversion** when deviation becomes extreme
### The Edge
The validated edge comes from:
- **Extreme deviations predict future returns** (dev < -2 → +1.67% over 12 bars)
- **Monotonic relationship** (more negative dev → higher forward returns)
- **Works out-of-sample** (test Sharpe +83-87% better than training)
- **Low correlation with buy & hold** (provides diversification value)
---
## Methodology
### Step 1: Macro Composite Driver D(t)
The indicator builds a weighted composite of macro asset returns:
**Process:**
1. Calculate **log returns** for BTC and each macro reference (QQQ, DXY, XAUUSD)
2. Compute **rolling correlation** between BTC and each reference over `corrLen` bars
3. **Weight each asset** by `|correlation|` if above `minCorrAbs` threshold, else 0
4. **Sign-adjust** weights (+1 for positive corr, -1 for negative) to handle inverse relationships
5. **Z-score normalize** each reference's returns over `fvWindow`
6. **Composite D(t)** = weighted sum of sign-adjusted z-scores
**Formula:**
```
For each reference i:
corr_i = correlation(BTC_returns, ref_i_returns, corrLen)
weight_i = |corr_i| if |corr_i| >= minCorrAbs else 0
sign_i = +1 if corr_i >= 0 else -1
z_i = (ref_i_returns - mean) / std
contrib_i = sign_i * z_i * weight_i
D(t) = sum(contrib_i) / sum(weight_i)
```
**Key Insight:** D(t) represents "how good macro conditions are for BTC right now" in a normalized, correlation-weighted way.
---
### Step 2: Fair Value Regression
Uses rolling linear regression to predict BTC price from D(t):
**Model:**
```
BTC_price(t) = α + β * D(t)
```
**Calculation (Pine Script approach):**
```
corr_CD = correlation(BTC_price, D, fvWindow)
sd_price = stdev(BTC_price, fvWindow)
sd_D = stdev(D, fvWindow)
cov = corr_CD * sd_price * sd_D
var_D = variance(D, fvWindow)
β = cov / var_D
α = mean(BTC_price) - β * mean(D)
fair_value(t) = α + β * D(t)
```
**Result:** A time-varying "macro fair value" line that adapts as correlations change.
---
### Step 3: Deviation Oscillator
Measures how far BTC price has deviated from fair value:
**Calculation:**
```
residual(t) = BTC_price(t) - fair_value(t)
residual_std = stdev(residual, normWindow)
deviation(t) = residual(t) / residual_std
```
**Interpretation:**
- `dev = 0` → BTC at fair value
- `dev = -2` → BTC is 2 standard deviations **cheap** vs macro
- `dev = +2` → BTC is 2 standard deviations **rich** vs macro
---
### Step 4: Signal Generation
**Long Entry:** `dev` crosses below `-2.0` (BTC extremely cheap vs macro)
**Long Exit:** `dev` crosses above `0.0` (BTC returns to fair value)
**No shorting** in default config (risk management choice - crypto volatility)
---
## How It Works
### Visual Components
#### 1. Price Chart (Main Panel)
**Fair Value Line (Orange):**
- The estimated "macro-driven fair value" for BTC
- Calculated from rolling regression on macro composite
**Fair Value Bands:**
- **±1σ** (light): 68% confidence zone
- **±2σ** (medium): 95% confidence zone
- **±3σ** (dark, dots): 99.7% confidence zone
**Entry/Exit Markers:**
- **Green "LONG" label** below bar: Entry signal (dev < -2)
- **Red "EXIT" label** above bar: Exit signal (dev > 0)
#### 2. Deviation Oscillator (Separate Pane)
**Line plot:**
- Shows current deviation z-score
- **Green** when dev < -2 (cheap)
- **Red** when dev > +2 (rich)
- **Gray** when neutral
**Histogram:**
- Visual representation of deviation magnitude
- Green bars = negative deviation (cheap)
- Red bars = positive deviation (rich)
**Threshold lines:**
- **Green dashed at -2.0**: Entry threshold
- **Red dashed at 0.0**: Exit threshold
- **Gray solid at 0**: Fair value line
#### 3. Correlation Panel (Top-Right)
Shows live correlation and weighting for each macro asset:
| Asset | Corr | Weight |
|-------|------|--------|
| QQQ | +0.45 | 0.45 |
| DXY | -0.32 | 0.32 |
| XAUUSD | +0.15 | 0.00 |
| Avg \|Corr\| | 0.31 | 0.77 |
**Reading:**
- **Corr**: Current rolling correlation with BTC (-1 to +1)
- **Weight**: How much this asset contributes to fair value (0 = excluded)
- **Avg |Corr|**: Average correlation strength (should be > 0.2 for reliable signals)
**Colors:**
- Green/Red corr = positive/negative correlation
- White weight = asset included, Gray = excluded (below minCorrAbs)
#### 4. Statistics Label (Bottom-Right)
```
━━━ BTC Macro FV ━━━
Dev: -2.34
Price: $103,192
FV: $110,500
Status: CHEAP ⬇
β: 103.52
```
**Fields:**
- **Dev**: Current deviation z-score
- **Price**: Current BTC close price
- **FV**: Current macro fair value estimate
- **Status**: CHEAP (< -2), RICH (> +2), or FAIR
- **β**: Current regression beta (sensitivity to macro)
---
## Installation & Setup
### TradingView Setup
1. Open TradingView and navigate to any **BTC chart** (BTCUSD, BTCUSDT, etc.)
2. Open **Pine Editor** (bottom panel)
3. Click **"+ New"** → **"Blank indicator"**
4. **Delete** all default code
5. **Copy** the entire Pine Script from `GHPT_optimized.pine`
6. **Paste** into the editor
7. Click **"Save"** and name it "BTC Macro Fair Value Oscillator"
8. Click **"Add to Chart"**
### Recommended Chart Settings
**Timeframe:** 4h (validated timeframe)
**Chart Type:** Candlestick or Heikin Ashi
**Overlay:** Yes (indicator plots on price chart + separate pane)
**Alternative Timeframes:**
- Daily: Works but slower signals
- 1h-2h: May work but not validated
- < 1h: Not recommended (too noisy)
### Symbol Requirements
**Primary:** BTC/USD or BTC/USDT on any exchange
**Macro References:** Automatically fetched
- QQQ (Nasdaq 100 ETF)
- DXY (US Dollar Index)
- XAUUSD (Gold spot)
**Data Requirements:**
- At least **90 bars** of history (warmup period)
- Premium TradingView recommended for full historical data
---
## Reading the Indicator
### Identifying Signals
#### Strong Long Signal (High Conviction)
- ✅ Deviation < -2.0 (extreme undervaluation)
- ✅ Avg |Corr| > 0.3 (strong macro relationships)
- ✅ Price touching or below -2σ band
- ✅ "LONG" label appears below bar
**Interpretation:** BTC is extremely cheap relative to macro conditions. Historical data shows +1.67% average return over next 12 bars (48 hours at 4h timeframe).
#### Moderate Long Signal (Lower Conviction)
- ⚠️ Deviation between -1.5 and -2.0
- ⚠️ Avg |Corr| between 0.2-0.3
- ⚠️ Price approaching -2σ band
**Interpretation:** BTC is cheap but not extreme. Consider as confirmation for other signals.
#### Exit Signal
- 🔴 Deviation crosses above 0 (returns to fair value)
- 🔴 "EXIT" label appears above bar
**Interpretation:** Mean reversion complete. Close long positions.
#### Strong Short/Avoid Signal
- 🔴 Deviation > +2.0 (extreme overvaluation)
- 🔴 Avg |Corr| > 0.3
- 🔴 Price touching or above +2σ band
**Interpretation:** BTC is expensive vs macro. Historical data shows -1.79% average return over next 12 bars. Consider exiting longs or reducing exposure.
### Regime Detection
**Strong Regime (Reliable Signals):**
- Avg |Corr| > 0.3
- Multiple assets weighted > 0
- Fair value line tracking price reasonably well
**Weak Regime (Unreliable Signals):**
- Avg |Corr| < 0.2
- Most weights = 0 (grayed out)
- Fair value line diverging wildly from price
- **Action:** Ignore signals until correlations strengthen

Bull Bear Indicator# Bull Bear Indicator - TradingView Script Description
## Overview
The Bull Bear Indicator is a powerful visual tool that instantly identifies market sentiment by coloring all candlesticks based on their position relative to a moving average. This indicator helps traders quickly identify bullish and bearish market conditions at a glance.
## Key Features
### 🎨 Visual Bull/Bear Identification
- **Green Candles**: Price is at or above the moving average (Bullish condition)
- **Red Candles**: Price is below the moving average (Bearish condition)
- Complete candle coloring including body, wicks, and borders for maximum clarity
### 📊 Flexible Moving Average Options
- **MA Type**: Choose between Simple Moving Average (MA) or Exponential Moving Average (EMA)
- **Timeframe**: Select Weekly or Daily timeframe for the moving average calculation
- **Customizable Period**: Adjust the MA/EMA period (default: 50)
### 📈 Smooth Moving Average Line
- Displays a smooth blue moving average line on the chart
- Automatically adapts to your selected timeframe and MA type
- Provides clear visual reference for trend identification
## How It Works
The indicator calculates a moving average (MA or EMA) based on your selected timeframe (Weekly or Daily). It then compares the current price to this moving average:
- **Bull Market**: When price ≥ Moving Average → Candles turn **GREEN**
- **Bear Market**: When price < Moving Average → Candles turn **RED**
## Configuration Options
1. **MA Type**: Choose "MA" for Simple Moving Average or "EMA" for Exponential Moving Average
2. **Timeframe**: Select "Weekly" for weekly-based MA or "Daily" for daily-based MA
3. **MA Period**: Set the number of periods for the moving average calculation (default: 50)
## Use Cases
- **Trend Identification**: Quickly identify overall market trend direction
- **Entry/Exit Signals**: Use color changes as potential entry or exit signals
- **Multi-Timeframe Analysis**: Combine with different chart timeframes for comprehensive analysis
- **Visual Clarity**: Reduce chart clutter while maintaining essential trend information
## Best Practices
- Use Weekly MA for longer-term trend identification
- Use Daily MA for shorter-term trend analysis
- Combine with other technical indicators for confirmation
- Adjust the MA period based on your trading style and timeframe
## Technical Details
- Built with Pine Script v6
- Overlay indicator (displays on main chart)
- Optimized for performance
- Compatible with all TradingView chart types
---
**Note**: This indicator is for educational and informational purposes only. Always conduct your own analysis and risk management before making trading decisions.

Realtime Squeeze Box [CHE] Realtime Squeeze Box — Detects lowvolatility consolidation periods and draws trimmed price range boxes in realtime to highlight potential breakout setups without clutter from outliers.
Summary
This indicator identifies "squeeze" phases where recent price volatility falls below a dynamic baseline threshold, signaling potential energy buildup for directional moves. By requiring a minimum number of consecutive bars in squeeze, it reduces noise from fleeting dips, making signals more reliable than simple threshold crosses. The core innovation is realtime box visualization: during active squeezes, it builds and updates a box capturing the price range while ignoring extreme values via quantile trimming, providing a cleaner view of consolidation bounds. This differs from static volatility bands by focusing on trimmed ranges and suppressing overlapping boxes, which helps traders spot genuine setups amid choppy markets. Overall, it aids in anticipating breakouts by combining volatility filtering with visual containment of price action.
Motivation: Why this design?
Traders often face whipsaws during brief volatility lulls that mimic true consolidations, leading to premature entries, or miss setups because standard volatility measures lag in adapting to changing market regimes. This design addresses that by using a hold requirement on consecutive lowvolatility bars to denoise signals, ensuring only sustained squeezes trigger visuals. The core idea—comparing rolling standard deviation to a smoothed baseline—creates a responsive yet stable filter for lowenergy periods, while the trimmed box approach isolates the core price cluster, making it easier to gauge breakout potential without distortion from spikes.
What’s different vs. standard approaches?
Reference baseline: Traditional squeeze indicators like the Bollinger Band Squeeze or TTM Squeeze rely on fixed multiples of bands or momentum oscillators crossing zero, which can fire on isolated bars or ignore range compression nuances.
Architecture differences:
Realtime box construction that updates barbybar during squeezes, using arrays to track and trim price values.
Quantilebased outlier rejection to define box bounds, focusing on the bulk of prices rather than full range.
Overlap suppression logic that skips redundant boxes if the new range intersects heavily with the prior one.
Hold counter for consecutive bar validation, adding persistence before signaling.
Practical effect: Charts show fewer, more defined orange boxes encapsulating tight price action, with a horizontal line extension marking the midpoint postsqueeze—visibly reducing clutter in sideways markets and highlighting "coiled" ranges that standard plots might blur with full highs/lows. This matters for quicker visual scanning of multitimeframe setups, as boxes selflimit to recent history and avoid piling up.
How it works (technical)
The indicator starts by computing a rolling average and standard deviation over a userdefined length on the chosen source price series. This deviation measure is then smoothed into a baseline using either a simple or exponential average over a longer window, serving as a reference for normal volatility. A squeeze triggers when the current deviation dips below this baseline scaled by a multiplier less than one, but only after a minimum number of consecutive bars confirm it, which resets the counter on breaks.
Upon squeeze start, it clears a buffer and begins collecting source prices barbybar, limited to the first few bars to keep computation light. For visualization, if enabled, it sorts the buffer and finds a quantile threshold, then identifies the minimum value at or below that threshold to set upper and lower box bounds—effectively clamping the range to exclude tails above the quantile. The box draws from the start bar to the current one, updating its right edge and levels dynamically; if the new bounds overlap significantly with the last completed box, it suppresses drawing to avoid redundancy.
Once the hold limit or squeeze ends, the box freezes: its final bounds become the last reference, a midpoint line extends rightward from the end, and a tiny circle label marks the point. Buffers and states reset on new squeezes, with historical boxes and lines capped to prevent overload. All logic runs on every bar but uses confirmed historical data for calculations, with realtime updates only affecting the active box's position—no future peeking occurs. Initialization seeds with null values, building states progressively from the first bars.
Parameter Guide
Source: Selects the price series (e.g., close, hl2) for deviation and box building; influences sensitivity to wicks or bodies. Default: close. Tradeoffs/Tips: Use hl2 for balanced range view in volatile assets; stick to close for pure directional focus—test on your timeframe to avoid oversmoothing trends.
Length (Mean/SD): Sets window for average and deviation calculation; shorter values make detection quicker but noisier. Default: 20. Tradeoffs/Tips: Increase to 30+ for stability in higher timeframes, reducing false starts; below 10 risks overreacting to singlebar noise.
Baseline Length: Defines smoothing window for the deviation baseline; longer periods create a steadier reference, filtering regime shifts. Default: 50. Tradeoffs/Tips: Pair with Length at 1:2 ratio for calm markets; shorten to 30 if baselines lag during fast volatility drops, but watch for added whips.
Squeeze Multiplier (<1.0): Scales the baseline downward to set the squeeze threshold; lower values tighten criteria for rarer, stronger signals. Default: 0.8. Tradeoffs/Tips: Tighten to 0.6 for highvol assets like crypto to cut noise; loosen to 0.9 in forex for more frequent but shallower setups—balances hit rate vs. depth.
Baseline via EMA (instead of SMA): Switches baseline smoothing to exponential for faster adaptation to recent changes vs. equalweighted simple average. Default: false. Tradeoffs/Tips: Enable in trending markets for quicker baseline drops; disable for uniform history weighting in rangebound conditions to avoid overreacting.
SD: Sample (len1) instead of Population (len): Adjusts deviation formula to divide by length minus one for smallsample bias correction, slightly inflating values. Default: false. Tradeoffs/Tips: Use sample in short windows (<20) for more conservative thresholds; population suits long looks where bias is negligible, keeping signals tighter.
Min. Hold Bars in Squeeze: Requires this many consecutive squeeze bars before confirming; higher denoise but may clip early setups. Default: 1. Tradeoffs/Tips: Bump to 35 for intraday to filter ticks; keep at 1 for swings where quick consolidations matter—trades off timeliness for reliability.
Debug: Plot SD & Threshold: Toggles lines showing raw deviation and threshold for visual backtesting of squeeze logic. Default: false. Tradeoffs/Tips: Enable during tuning to eyeball crossovers; disable live to declutter—great for verifying multiplier impact without alerts.
Tint Bars when Squeeze Active: Overlays semitransparent color on bars during open box phases for quick squeeze spotting. Default: false. Tradeoffs/Tips: Pair with low opacity for subtlety; turn off if using boxes alone, as tint can obscure candlesticks in dense charts.
Tint Opacity (0..100): Controls background tint strength during active squeezes; higher values darken for emphasis. Default: 85. Tradeoffs/Tips: Dial to 60 for light touch; max at 100 risks hiding price action—adjust per chart theme for visibility.
Stored Price (during Squeeze): Price series captured in the buffer for box bounds; defaults to source but allows customization. Default: close. Tradeoffs/Tips: Switch to high/low for wider boxes in gappy markets; keep close for midline focus—impacts trim effectiveness on outliers.
Quantile q (0..1): Fraction of sorted prices below which tails are cut; higher q keeps more data but risks including spikes. Default: 0.718. Tradeoffs/Tips: Lower to 0.5 for aggressive trim in noisy assets; raise to 0.8 for fuller ranges—tune via debug to match your consolidation depth.
Box Fill Color: Sets interior shade of squeeze boxes; semitransparent for layering. Default: orange (80% trans.). Tradeoffs/Tips: Soften with more transparency in multiindicator setups; bold for standalone use—ensures boxes pop without overwhelming.
Box Border Color: Defines outline hue and solidity for box edges. Default: orange (0% trans.). Tradeoffs/Tips: Match fill for cohesion or contrast for edges; thin width keeps it clean—helps delineate bounds in zoomed views.
Keep Last N Boxes: Limits historical boxes/lines/labels to this count, deleting oldest for performance. Default: 10. Tradeoffs/Tips: Increase to 50 for weekly reviews; set to 0 for unlimited (risks lag)—balances history vs. speed on long charts.
Draw Box in Realtime (build/update): Enables live extension of boxes during squeezes vs. waiting for end. Default: true. Tradeoffs/Tips: Disable for confirmedonly views to mimic backtests; enable for proactive trading—adds minor repaint on live bars.
Box: Max First N Bars: Caps buffer collection to initial squeeze bars, freezing after for efficiency. Default: 15. Tradeoffs/Tips: Shorten to 510 for fast intraday; extend to 20 in dailies—prevents bloated arrays but may truncate long squeezes.
Reading & Interpretation
Squeeze phases appear as orange boxes encapsulating the trimmed price cluster during lowvolatility holds—narrow boxes signal tight consolidations, while wider ones indicate looser ranges within the threshold. The box's top and bottom represent the quantilecapped high and low of collected prices, with the interior fill shading the containment zone; ignore extremes outside for "true" bounds. Postsqueeze, a solid horizontal line extends right from the box's midpoint, acting as a reference level for potential breakout tests—drifting prices toward or away from it can hint at building momentum. Tiny orange circles at the line's start mark completion points for easy scanning. Debug lines (if on) show deviation hugging or crossing the threshold, confirming hold logic; a persistent hug below suggests prolonged calm, while spikes above reset counters.
Practical Workflows & Combinations
Trend following: Enter long on squeezeend close above the box top (or midpoint line) confirmed by higher high in structure; filter with rising 50period average to avoid countertrend traps. Use boxes as support/resistance proxies—short below bottom in downtrends.
Exits/Stops: Trail stops to the box midpoint during postsqueeze runs for conservative holds; go aggressive by exiting on retest of opposite box side. If debug shows repeated threshold grazes, tighten stops to curb drawdowns in ranging followups.
Multiasset/MultiTF: Defaults work across stocks, forex, and crypto on 15min+ frames; scale Length proportionally (e.g., x2 on hourly). Layer with highertimeframe boxes for confluence—e.g., daily squeeze + 1H box for entry timing. (Unknown/Optional: Specific multiTF scaling recipes beyond proportional adjustment.)
Behavior, Constraints & Performance
Repaint/confirmation: Core calculations use historical closes, confirming on bar close; active boxes repaint their right edge and levels live during squeezes if enabled, but freeze irrevocably on hold limit or end—mitigates via barbybar buffer adds without future leaks. No lookahead indexes.
security()/HTF: None used, so no external timeframe repaints; all native to chart resolution.
Resources: Caps at 300 boxes/lines/labels total; small arrays (up to 20 elements) and short loops in sorting/minfinding keep it light—suitable for 10k+ bar charts without throttling. Persistent variables track state across bars efficiently.
Known limits: May lag on ultrasharp volatility spikes due to baseline smoothing; gaps or thin markets can skew trims if buffer hits cap early; overlaps suppress visuals but might hide chained squeezes—(Unknown/Optional: Edge cases in nonstandard sessions).
Sensible Defaults & Quick Tuning
Start with defaults for most liquid assets on 1Hdaily: Length 20, Multiplier 0.8, Hold 1, Quantile 0.718—yields balanced detection without excess noise. For too many false starts (choppy charts), increase Hold to 3 and Baseline Length to 70 for stricter confirmation, reducing signals by 3050%. If squeezes feel sluggish or miss quick coils, shorten Length to 14 and enable EMA baseline for snappier adaptation, but monitor for added flips. In highvol environments like options, tighten Multiplier to 0.6 and Quantile to 0.6 to focus on core ranges; reverse for calm pairs by loosening to 0.95. Always backtest tweaks on your asset's history.
What this indicator is—and isn’t
This is a volatilityfiltered visualization tool for spotting and bounding consolidation phases, best as a signal layer atop price action and trend filters—not a standalone predictor of direction or strength. It highlights setups but ignores volume, momentum, or news context, so pair with discreteness rules like higher highs/lows. Never use it alone for entries; always layer risk management, such as 12% stops beyond box extremes, and position sizing based on account drawdown tolerance.
Disclaimer
The content provided, including all code and materials, is strictly for educational and informational purposes only. It is not intended as, and should not be interpreted as, financial advice, a recommendation to buy or sell any financial instrument, or an offer of any financial product or service. All strategies, tools, and examples discussed are provided for illustrative purposes to demonstrate coding techniques and the functionality of Pine Script within a trading context.
Any results from strategies or tools provided are hypothetical, and past performance is not indicative of future results. Trading and investing involve high risk, including the potential loss of principal, and may not be suitable for all individuals. Before making any trading decisions, please consult with a qualified financial professional to understand the risks involved.
By using this script, you acknowledge and agree that any trading decisions are made solely at your discretion and risk.
Do not use this indicator on HeikinAshi, Renko, Kagi, PointandFigure, or Range charts, as these chart types can produce unrealistic results for signal markers and alerts.
Best regards and happy trading
Chervolino

Stablecoin to BTC Market Cap RatioThis indicator calculates the ratio of the combined market capitalization of USDT and USDC stablecoins to the market capitalization of BTC. Data is updated daily from TradingView's CRYPTOCAP sources. It is displayed as a line in a separate panel, allowing analysis of stablecoin liquidity dynamics relative to BTC.
How to Use
Add the indicator to any asset chart in TradingView. It is useful for assessing the potential buying power of stablecoins in the cryptocurrency market. High ratio values may signal accumulation of liquidity in stablecoins, often preceding growth in BTC or altcoins (bullish signal). Low values indicate a decrease in the role of stablecoins, which may be bearish. It is recommended to combine with other indicators, such as RSI or volumes, to confirm trends.

Turtles StrategyBorn from the 1980s "Turtle" experiment, this method of trading captures breakouts and places or closes trades with intrabar entries or exits and realized-equity risk controls.
How It Works
The strategy buys/sells on breakouts from recent highs/lows, using ATR for volatility-adjusted stops and sizing. It risks a fixed % (default 1%) of realized equity per trade—initial capital plus closed P&L, ignoring open positions for conservatism. Drawdown protection auto-reduces risk by 20% at 10% drops (up to three times), resetting only on full peak recovery. Single positions only, with 1-tick slippage simulated for realistic fills. Best for trending assets like forex,commodities, crypto, stocks. Backtest for optimal parameters.
Main Operations
The strategy works on any timeframe but it's meant to be used on daily charts.
Entry Signals:
Long: Buy-stop 1 tick above 20-bar high (default "Entry Period") when no position—enters intrabar on breakout.
Short: Sell-stop 1 tick below 20-bar low. OCA cancels opposites.
Size: (Realized equity × adjusted risk %) ÷ (2× ATR stop distance), scaled by point value.
Exit Signals:
Longs: Stop at tighter of (entry - 2× ATR) or (10-bar low - 1 tick trailing, default "Exit Period").
Shorts: Stop at tighter of (entry + 2× ATR) or (10-bar high + 1 tick trailing).
Locks profits in trends, exits fast on fades.
Risk Controls:
Tracks realized equity peak.
10% drawdown: Risk ×0.8; 20%/30%: Further ×0.8 (max 3x).
Full reset above peak—preserves capital in slumps.

Ornstein-Uhlenbeck Trend Channel [BOSWaves]Ornstein-Uhlenbeck Trend Channel - Adaptive Mean Reversion with Dynamic Equilibrium Geometry
Overview
The Ornstein-Uhlenbeck Trend Channel introduces an advanced equilibrium-mapping framework that blends statistical mean reversion with adaptive trend geometry. Traditional channels and regression bands react linearly to volatility, often failing to capture the natural rhythm of price equilibrium. This model evolves that concept through a dynamic reversion engine, where equilibrium adapts continuously to volatility, trend slope, and structural bias - forming a living channel that bends, expands, and contracts in real time.
The result is a smooth, equilibrium-driven representation of market balance - not just trend direction. Instead of static bands or abrupt slope shifts, traders see fluid, volatility-aware motion that mirrors the natural pull-and-release dynamic of market behavior. Each channel visualizes the probabilistic boundaries of fair value, showing where price tends to revert and where it accelerates away from its statistical mean.
Unlike conventional envelopes or Bollinger-type constructs, the Ornstein-Uhlenbeck framework is volatility-reactive and equilibrium-sensitive, providing traders with a contextual map of where price is likely to stabilize, extend, or exhaust.
Theoretical Foundation
The Ornstein-Uhlenbeck Trend Channel is inspired by stochastic mean-reversion processes - mathematical models used to describe systems that oscillate around a drifting equilibrium. While linear regression channels assume constant variance, financial markets operate under variable volatility and shifting equilibrium points. The OU process accounts for this by treating price as a mean-seeking motion governed by volatility and trend persistence.
At its core are three interacting components:
Equilibrium Mean (μ) : Represents the evolving balance point of price, adjusting to directional bias and volatility.
Reversion Rate (θ) : Defines how strongly price is pulled back toward equilibrium after deviation, capturing the self-correcting nature of market structure.
Volatility Coefficient (σ) : Controls how far and how quickly price can diverge from equilibrium before mean reversion pressure increases.
By embedding this stochastic model inside a volatility-adjusted framework, the system accurately scales across different markets and conditions - maintaining meaningful equilibrium geometry across crypto, forex, indices, or commodities. This design gives traders a mathematically grounded yet visually intuitive interpretation of dynamic balance in live market motion.
How It Works
The Ornstein-Uhlenbeck Trend Channel is constructed through a structured multi-stage process that merges stochastic logic with volatility mechanics:
Equilibrium Estimation Core : The indicator begins by identifying the evolving mean using adaptive smoothing influenced by trend direction and volatility. This becomes the live centerline - the statistical anchor around which price naturally oscillates.
Volatility Normalization Layer : ATR or rolling deviation is used to calculate volatility intensity. The output scales the channel width dynamically, ensuring that boundaries reflect current variance rather than static thresholds.
Directional Bias Engine : EMA slope and trend confirmation logic determine whether equilibrium should tilt upward or downward. This creates asymmetrical channel motion that bends with the prevailing trend rather than staying horizontal.
Channel Boundary Construction : Upper and lower bands are plotted at volatility-proportional distances from the mean. These envelopes form the “statistical pressure zones” that indicate where mean reversion or acceleration may occur.
Signal and Lifecycle Control : Channel breaches, mean crossovers, and slope flips mark statistically significant events - exhaustion, continuation, or rebalancing. Older equilibrium zones gradually fade, ensuring a clear, context-aware visual field.
Through these layers, the channel forms a continuously updating equilibrium corridor that adapts in real time - breathing with the market’s volatility and rhythm.
Interpretation
The Ornstein-Uhlenbeck Trend Channel reframes how traders interpret balance and momentum. Instead of viewing price as directional movement alone, it visualizes the constant tension between trending force and equilibrium pull.
Uptrend Phases : The equilibrium mean tilts upward, with price oscillating around or slightly above the midline. Upper band touches signal momentum extension; lower touches reflect healthy reversion.
Downtrend Phases : The mean slopes downward, with upper-band interactions marking resistance zones and lower bands acting as reversion boundaries.
Equilibrium Transitions : Flat mean sections indicate balance or distribution phases. Breaks from these neutral zones often precede directional expansion.
Overextension Events : When price closes beyond an outer boundary, it marks statistically significant disequilibrium - an early warning of exhaustion or volatility reset.
Visually, the OU channel translates volatility and equilibrium into structured geometry, giving traders a statistical lens on trend quality, reversion probability, and volatility stress points.
Strategy Integration
The Ornstein-Uhlenbeck Trend Channel integrates seamlessly into both mean-reversion and trend-continuation systems:
Trend Alignment : Use mean slope direction to confirm higher-timeframe bias before entering continuation setups.
Reversion Entries : Target rejections from outer bands when supported by volume or divergence, capturing snapbacks toward equilibrium.
Volatility Breakout Mapping : Monitor boundary expansions to identify transition from compression to expansion phases.
Liquidity Zone Confirmation : Combine with BOS or order-block indicators to validate structural zones against equilibrium positioning.
Momentum Filtering : Align with oscillators or volume profiles to isolate equilibrium-based pullbacks with statistical context.
Technical Implementation Details
Core Engine : Stochastic Ornstein-Uhlenbeck process for continuous mean recalibration.
Volatility Framework : ATR- and deviation-based scaling for dynamic channel expansion.
Directional Logic : EMA-slope driven bias for adaptive mean tilt.
Channel Composition : Independent upper and lower envelopes with smoothing and transparency control.
Signal Structure : Alerts for mean crossovers and boundary breaches.
Performance Profile : Lightweight, multi-timeframe compatible implementation optimized for real-time responsiveness.
Optimal Application Parameters
Timeframe Guidance:
1 - 5 min : Reactive equilibrium tracking for short-term scalping and microstructure analysis.
15 - 60 min : Medium-range setups for volatility-phase transitions and intraday structure.
4H - Daily : Macro equilibrium mapping for identifying exhaustion, distribution, or reaccumulation zones.
Suggested Configuration:
Mean Length : 20 - 50
Volatility Multiplier : 1.5× - 2.5×
Reversion Sensitivity : 0.4 - 0.8
Smoothing : 2 - 5
Parameter tuning should reflect asset liquidity, volatility, and desired reversion frequency.
Performance Characteristics
High Effectiveness:
Trending environments with cyclical pullbacks and volatility oscillation.
Markets exhibiting consistent equilibrium-return behavior (indices, majors, high-cap crypto).
Reduced Effectiveness:
Low-volatility consolidations with minimal variance.
Random walk markets lacking definable equilibrium anchors.
Integration Guidelines
Confluence Framework : Pair with BOSWaves structural tools or momentum oscillators for context validation.
Directional Control : Follow mean slope alignment for directional conviction before acting on channel extremes.
Risk Calibration : Use outer band violations for controlled contrarian entries or trailing stop management.
Multi-Timeframe Synergy : Derive macro equilibrium zones on higher timeframes and refine entries on lower levels.
Disclaimer
The Ornstein-Uhlenbeck Trend Channel is a professional-grade equilibrium and volatility framework. It is not predictive or profit-assured; performance depends on parameter calibration, volatility regime, and disciplined execution. BOSWaves recommends using it as part of a comprehensive analytical stack combining structure, liquidity, and momentum context.

Buy&Hold Profitcalculator in EuroTitle: Buy & Hold Strategy in Euro
Description:
This Pine Script implements a simple yet flexible Buy & Hold strategy denominated in Euros, suitable for a wide range of assets including cryptocurrencies, forex pairs, and stocks.
Key Features:
Custom Investment Amount: Define your invested capital in Euros.
Flexible Start & End Dates: Specify exact entry and exit dates for the strategy.
Automatic Currency Conversion: Supports assets priced in USD or USDT, converting the invested capital to chart currency using the EUR/USD exchange rate.
Single Entry and Exit: Executes a one-time Buy & Hold position based on the defined timeframe.
Profit and Performance Tracking: Calculates total profit/loss in Euros and percentage returns.
Smart Exit Label: Displays a dynamic label at the exit showing final position value, net profit/loss, and return percentage. The label automatically adjusts its position above or below the price bar for optimal visibility.
Visual Enhancements:
Position value and profit/loss plotted on the chart.
Background color highlights the active investment period.
Buy and Sell markers clearly indicate entry and exit points.
This strategy is ideal for traders and investors looking to simulate long-term positions and evaluate performance in Euro terms, even when trading USD-denominated assets.
Usage Notes:
Best used on daily charts for medium- to long-term analysis.
Adjust start and end dates, as well as invested capital, to simulate different scenarios.
Works with any asset, but currency conversion is optimized for USD or USDT-pegged instruments.

Advanced Multi-Timeframe Moving AveragesThis indicator combines three fully customizable Moving Averages (MA30, MA80, MA120 by default) with multi-timeframe support, trend detection, and visual highlights — all in one lightweight script.
⚙️ Features
🕒 Multi-Timeframe Control – set a custom timeframe for each MA (e.g. MA30 from 1H, MA80 from 4H, MA120 from Daily).
🟢 Dynamic Trend Coloring – candles and background turn green when price is above all MAs, and red when below.
⚡ Crossover Alerts – built-in alerts for MA1↔MA2, MA2↔MA3, and MA1↔MA3 crossovers.
🎨 Optimized Colors – clear, bright MA colors for better visibility:
MA 1 (short-term): Gold (#FFD700)
MA 2 (mid-term): Deep Sky Blue (#00BFFF)
MA 3 (long-term): Hot Pink (#FF69B4)
🧩 Simple, Modular Design – easily adjust lengths, types (SMA/EMA), and timeframes from inputs.
🧠 How to Use
Add the indicator to your chart.
Set your preferred lengths (e.g. 30, 80, 120).
Optionally assign different timeframes for higher-TF analysis.
Use the color cues and crossovers to spot momentum shifts and trend changes.
🪶 Notes
Works great on all assets (crypto, forex, stocks, indices).
Compatible with both light and dark themes.
Built with Pine Script v5 — no external dependencies.

3D Institutional Battlefield [SurgeGuru]Professional Presentation: 3D Institutional Flow Terrain Indicator
Overview
The 3D Institutional Flow Terrain is an advanced trading visualization tool that transforms complex market structure into an intuitive 3D landscape. This indicator synthesizes multiple institutional data points—volume profiles, order blocks, liquidity zones, and voids—into a single comprehensive view, helping you identify high-probability trading opportunities.
Key Features
🎥 Camera & Projection Controls
Yaw & Pitch: Adjust viewing angles (0-90°) for optimal perspective
Scale Controls: Fine-tune X (width), Y (depth), and Z (height) dimensions
Pro Tip: Increase Z-scale to amplify terrain features for better visibility
🌐 Grid & Surface Configuration
Resolution: Adjust X (16-64) and Y (12-48) grid density
Visual Elements: Toggle surface fill, wireframe, and node markers
Optimization: Higher resolution provides more detail but requires more processing power
📊 Data Integration
Lookback Period: 50-500 bars of historical analysis
Multi-Source Data: Combine volume profile, order blocks, liquidity zones, and voids
Weighted Analysis: Each data source contributes proportionally to the terrain height
How to Use the Frontend
💛 Price Line Tracking (Your Primary Focus)
The yellow price line is your most important guide:
Monitor Price Movement: Track how the yellow line interacts with the 3D terrain
Identify Key Levels: Watch for these critical interactions:
Order Blocks (Green/Red Zones):
When yellow price line enters green zones = Bullish order block
When yellow price line enters red zones = Bearish order block
These represent institutional accumulation/distribution areas
Liquidity Voids (Yellow Zones):
When yellow price line enters yellow void areas = Potential acceleration zones
Voids indicate price gaps where minimal trading occurred
Price often moves rapidly through voids toward next liquidity pool
Terrain Reading:
High Terrain Peaks: High volume/interest areas (support/resistance)
Low Terrain Valleys: Low volume areas (potential breakout zones)
Color Coding:
Green terrain = Bullish volume dominance
Red terrain = Bearish volume dominance
Purple = Neutral/transition areas
📈 Volume Profile Integration
POC (Point of Control): Automatically marks highest volume level
Volume Bins: Adjust granularity (10-50 bins)
Height Weight: Control how much volume affects terrain elevation
🏛️ Order Block Detection
Detection Length: 5-50 bar lookback for block identification
Strength Weighting: Recent blocks have greater impact on terrain
Candle Body Option: Use full candles or body-only for block definition
💧 Liquidity Zone Tracking
Multiple Levels: Track 3-10 key liquidity zones
Buy/Sell Side: Different colors for bid/ask liquidity
Strength Decay: Older zones have diminishing terrain impact
🌊 Liquidity Void Identification
Threshold Multiplier: Adjust sensitivity (0.5-2.0)
Height Amplification: Voids create significant terrain depressions
Acceleration Zones: Price typically moves quickly through void areas
Practical Trading Application
Bullish Scenario:
Yellow price line approaches green order block terrain
Price finds support in elevated bullish volume areas
Terrain shows consistent elevation through key levels
Bearish Scenario:
Yellow price line struggles at red order block resistance
Price falls through liquidity voids toward lower terrain
Bearish volume peaks dominate the landscape
Breakout Setup:
Yellow price line consolidates in flat terrain
Minimal resistance (low terrain) in projected direction
Clear path toward distant liquidity zones
Pro Tips
Start Simple: Begin with default settings, then gradually customize
Focus on Yellow Line: Your primary indicator of current price position
Combine Timeframes: Use the same terrain across multiple timeframes for confluence
Volume Confirmation: Ensure terrain peaks align with actual volume spikes
Void Anticipation: When price enters voids, prepare for potential rapid movement
Order Blocks & Voids Architecture
Order Blocks Calculation
Trigger: Price breaks fractal swing points
Bullish OB: When close > swing high → find lowest low in lookback period
Bearish OB: When close < swing low → find highest high in lookback period
Strength: Based on price distance from block extremes
Storage: Global array maintains last 50 blocks with FIFO management
Liquidity Voids Detection
Trigger: Price gaps exceeding ATR threshold
Bull Void: Low - high > (ATR200 × multiplier)
Bear Void: Low - high > (ATR200 × multiplier)
Validation: Close confirms gap direction
Storage: Global array maintains last 30 voids
Key Design Features
Real-time Updates: Calculated every bar, not just on last bar
Global Persistence: Arrays maintain state across executions
FIFO Management: Automatic cleanup of oldest entries
Configurable Sensitivity: Adjustable lookback periods and thresholds
Scientific Testing Framework
Hypothesis Testing
Primary Hypothesis: 3D terrain visualization improves detection of institutional order flow vs traditional 2D charts
Testable Metrics:
Prediction Accuracy: Does terrain structure predict future support/resistance?
Reaction Time: Faster identification of key levels vs conventional methods
False Positive Reduction: Lower rate of failed breakouts/breakdowns
Control Variables
Market Regime: Trending vs ranging conditions
Asset Classes: Forex, equities, cryptocurrencies
Timeframes: M5 to H4 for intraday, D1 for swing
Volume Conditions: High vs low volume environments
Data Collection Protocol
Terrain Features to Quantify:
Slope gradient changes at price inflection points
Volume peak clustering density
Order block terrain elevation vs subsequent price action
Void depth correlation with momentum acceleration
Control Group: Traditional support/resistance + volume profile
Experimental Group: 3D Institutional Flow Terrain
Statistical Measures
Signal-to-Noise Ratio: Terrain features vs random price movements
Lead Time: Terrain formation ahead of price confirmation
Effect Size: Performance difference between groups (Cohen's d)
Statistical Power: Sample size requirements for significance
Validation Methodology
Blind Testing:
Remove price labels from terrain screenshots
Have traders identify key levels from terrain alone
Measure accuracy vs actual price action
Backtesting Framework:
Automated terrain feature extraction
Correlation with future price reversals/breakouts
Monte Carlo simulation for significance testing
Expected Outcomes
If hypothesis valid:
Significant improvement in level prediction accuracy (p < 0.05)
Reduced latency in institutional level identification
Higher risk-reward ratios on terrain-confirmed trades
Research Questions:
Does terrain elevation reliably indicate institutional interest zones?
Are liquidity voids statistically significant momentum predictors?
Does multi-timeframe terrain analysis improve signal quality?
How does terrain persistence correlate with level strength?
LuxAlgo BigBeluga hapharmonic

Sunmool's NY Lunch Model BacktestingICT NY Lunch Model Backtesting (12:00–13:00 NY) 🗽🍔
This research indicator tests an ICT narrative using the New York lunch window (12:00–13:00 America/New_York). It records that hour’s high/low and measures, during the post-lunch session (default 13:00–16:00), how often:
⬆️ If the afternoon trends up, the Lunch Low gets swept first.
⬇️ If the afternoon trends down, the Lunch High gets swept first.
It reports these as conditional probabilities, not trade signals. 📈
👀 What it shows
🟦 Lunch Range box (toggle): high/low from 12:00–13:00 NY
🔻🔺 Sweep signals (bar-anchored)
Low sweep: triangle below bar + optional “L”
High sweep: triangle above bar + optional “H”
🧱 Optional small box wrapping the swept candle
📊 Stats table (top-right)
P(L-swept | Up) — % of Up-days where Lunch Low was swept
P(H-swept | Down) — % of Down-days where Lunch High was swept
🔁 Contradictions + sample sizes (Up-days / Down-days)
🎯 Direction logic (Up/Down)
Anchor: 13:00 open (pmOpen) ⏰
Threshold: ATR × multiple or % from 13:00
Close ≥ pmOpen + threshold → Up-day
Close ≤ pmOpen − threshold → Down-day
Tiny moves under the threshold are ignored to reduce noise 🧹
⚙️ Inputs
🌐 Timezone: America/New_York (DST handled)
🍽️ Lunch window: 1200–1300
🕓 Post-lunch window: default 1300–1600 (try 17:00/20:00 for sensitivity)
📐 Trend threshold: ATR / Percent (with length/multiple or % level)
📅 Weekdays-only toggle (FX/Equities style)
👁️ Display toggles: Lunch box / sweep arrows / sweep text / sweep candle box / stats table
🔔 TF hint when chart TF > 15m
🧭 How to use
Use 5–15m charts for accurate lunch range capture.
Scroll ~1 year for meaningful samples.
Run sensitivity checks: vary ATR/% thresholds and the post-lunch end time.
For crypto, compare with vs without weekends. 🚀
🧠 Reading the results
High P(L-swept | Up) with a solid Up-day count ⇒ on up afternoons, lunch low is often swept.
High P(H-swept | Down) ⇒ on down afternoons, lunch high is often swept.
Lower Contradictions = cleaner tendency.
Remember: this is a probabilistic tendency, not a rule. 🎲
📝 Notes & limits
All markers (arrows, text, sweep boxes) are bar-anchored; the lunch range box is a research overlay you can toggle.
Real-time vs historical bar building can differ—interpret on bar close. 🔒
