Daily Protocol [#] by @shulktrades@shulktrades aka Shulkins aka shulk
Open Source Script created from the code “ICT Everything” by @coldbrewrosh
*Adjusted Key Times and Standard Deviations to better fit my model*
Daily Protocol Indicator - Description
Overview
The Daily Protocol indicator is a comprehensive trading tool designed to help traders identify and visualize key intraday time-based levels and sessions for forex and other markets. This indicator automatically marks important market opening times, session ranges, and standard deviation projections to assist in technical analysis and trade planning.
Key Features
Time-Based Vertical Lines
Midnight Open (00:00): Marks the start of each trading day
News Open (08:30): Highlights the typical economic news release time
NY AM Open (09:30): Identifies the US equity market opening
Opening Price Lines
Midnight Opening Price: Tracks the price at market day start
News Opening Price (08:30): Shows the price level at news time
NY AM Opening Price (09:30): Displays equity market open price
Afternoon Opening Price (13:30): Optional afternoon session marker
Weekly & Monthly Opening Prices: Higher timeframe reference levels
Session Range Boxes
London Session (LNDN): 02:00-05:00 range with optional standard deviation projections
Asian Session (ASIA): 20:00-00:00 range with optional standard deviation projections
NY AM Session (NYAM): 09:30-10:00 range with optional standard deviation projections
Standard Deviation Projections
Automatically calculates and displays 1-4 standard deviation levels based on session ranges
Configurable directional display (both sides, upside only, or downside only)
Helps identify potential target zones and reversal areas
Additional Features
Day of Week Labels: Clearly marks each trading day
Customizable Timezone: Supports multiple global timezones
Historical Lines Toggle: Option to show/hide past levels for cleaner charts
Terminus Settings: Control how far price lines extend into the future
Color Customization: Full control over all colors, line styles, and widths
Range Statistics Table: Displays current session ranges and pip counts (forex only)
Best Use Cases
Identifying overnight key times and structure before market opens for NY
Planning entries around major session times
Setting targets using standard deviation projections
Understanding market structure through time-based analysis
Backtesting strategies based on session behavior
Timeframe Recommendation
Works best on intraday timeframes (1-60 minutes). The indicator automatically hides on timeframes above 61 minutes to prevent chart clutter.
Customization
Extensive settings allow traders to:
Enable/disable any individual component
Adjust all colors, line styles, and widths
Control label display and formatting
Set timezone preferences
Configure standard deviation calculations
Choose which sessions and times to display
This indicator is ideal for traders who follow time-based trading methodologies and want to incorporate structured intraday analysis into their workflow.
Cerca negli script per "daily"

Daily AVWAPsDaily AVWAPs is designed for intraday and swing traders who track institutional volume benchmarks. Instead of a single "rolling" line that resets continuously, this indicator identifies the starting timestamp of the last 5 trading sessions and draws five distinct Anchored VWAPs from those exact moments.
This allows traders to see exactly where the average volume-weighted price stands for the current day (1D), yesterday (2D), and the three days prior (3D, 4D, 5D) simultaneously.
Key Features
Polyline Visualization: Unlike standard indicators that plot historical values for every bar (creating a messy "sawtooth" effect), this script uses Pine Script Polylines. It draws clean, static lines starting from the specific anchor point to the present price, mimicking the manual "Anchored VWAP" drawing tool.
Dynamic Session Detection: The script contains zero hardcoded dates. It automatically detects when a new trading day begins based on the chart data. It works seamlessly across all asset classes (Stocks, Crypto, Futures) and automatically adjusts for weekends, holidays, and irregular trading weeks without manual updates.
Unified Color Control: Input colors are synchronized. Changing a color in the settings menu updates both the chart line and the price scale label instantly.
Toggle Controls: Individual checkboxes allow you to toggle any specific VWAP (1D through 5D) on or off to keep your chart clean.
How to Use
Trend Strength: When the 1D, 2D, and 3D VWAPs are "fanning out" in alignment, the trend is strong.
Mean Reversion: In a sideways market, price often gravitates back to the 5-Day VWAP as a "value area."
Support & Resistance: Watch for price to respect the VWAP of a previous high-volume day (e.g., bouncing off the 3D VWAP during a pullback).
Settings
Source: Select the price data source (default is OHLC4) .
Colors & Toggles: Use the checkboxes to enable/disable specific lines. Customize the color for each specific day's AVWAP directly in the Inputs tab.
This indicator was adapted and repurposed from the original work by The_Last_Gentleman .
Technical Note: This indicator is optimized for intraday timeframes (1m, 5m, 15m, 1H). Because it uses polyline and array logic to scan specific session timestamps, it calculates exclusively on the most recent bar to maintain high performance.
Daily Quarters & Sub-Quarters [by Brites]This script marks the daily and session quarters starting from a custom user-defined time.
It also calculates manual and automatic pip ranges for each quarter and displays a full information table.
The indicator includes True Day Open, Midnight Open, and True Week Open levels, with customizable colors and visibility options.

Daily Separator_Yoot HobbizSimply helps you separate each trading day — a clean, visual indicator that marks daily sessions so you can read price action faster and stay focused on what really matters.
A simple indicator that clearly separates each trading day, making your charts easier to read and your decisions easier to take.

Daily & Average Dollar VolumeCalculates the daily and average (20D) $ volume.
Fully customizable appearence and can be placed in any corner.

Daily Levels (StevenCharts)The Daily Levels (StevenCharts) indicator is a comprehensive, all-in-one tool designed for intraday traders. It automatically plots all critical daily price levels, including the premarket high/low, previous day's high/low/close, and the current day's developing range (HOD/LOD).
What makes this indicator unique is its dynamic Fibonacci range that adapts to the day's price action and its "smart" labeling system that provides contextual clues (like "Swept" vs. "Broken") and combines labels to reduce chart clutter.
Key Features
Dynamic Reversing Fibs: The Fibonacci levels are drawn based on the current day's High-of-Day (HOD) and Low-of-Day (LOD). The range automatically reverses direction based on which extreme (HOD or LOD) was most recently made, providing relevant pullback targets in real-time.
"Golden Zone" Pullback Alert: The script includes a built-in alert that triggers when price makes a new HOD or LOD and then pulls back to touch the "Golden Zone" (defined between the 0.50 and 0.618 levels), signaling a potential continuation setup.
Smart "Swept" vs. "Broken" Logic: Levels like PDH, PDL, PMH, and PML aren't just static lines. The script intelligently labels them as "Swept" if price wicks past them or "Broken" if price closes and holds beyond them, giving you immediate contextual insight.
Clutter-Free "Combination" Labels: To keep your chart clean, the script automatically combines labels. If the day's high is also the premarket high, the label will read "HOD + PMH" instead of two overlapping labels.
Accurate RTH Previous Close: The script specifically requests the "Regular Trading Hours" (RTH) data to plot the official 4 PM EST previous day close (PDC), avoiding inaccuracies from extended hours data.
Full Level Plotting:
Current Day High-of-Day (HOD) & Low-of-Day (LOD)
Premarket High (PMH) & Low (PML) (locked in at 9:30 AM EST)
Previous Day's High (PDH) & Low (PDL)
Previous Day's Official RTH Close (PDC)
How to Use
This indicator provides a complete framework for intraday analysis.
Identify Key Levels: At the start of the session, all key levels (PDH/L, PMH/L, PDC) are clearly plotted, defining the initial areas of potential support and resistance.
Track the Trend: As the day progresses, watch the dynamic Fibs. If the market is making new highs, the Fibs will be drawn from the HOD down, showing pullback zones. If the market is making new lows, the Fibs will be drawn from the LOD up, showing bounce zones.
Use the Alert: The "Golden Zone Touch" alert is the primary trading setup.
For a Long: Wait for a new HOD to be set. The alert will trigger if the price then pulls back to the Golden Zone, offering a potential entry in the direction of the trend.
For a Short: Wait for a new LOD to be set. The alert will trigger if the price then bounces to the Golden Zone, offering a potential entry for a short.
Monitor Level Breaks: Use the "Swept" and "Broken" labels to confirm moves. A "Broken" level suggests a stronger, more decisive move, while a "Swept" level may indicate a stop hunt or liquidity grab.
Settings
The indicator is fully customizable. You can toggle any of the following features on or off to match your trading style:
Show Fibonacci Levels
Show Previous Day High/Low
Show Previous Day Close
Show Premarket High/Low

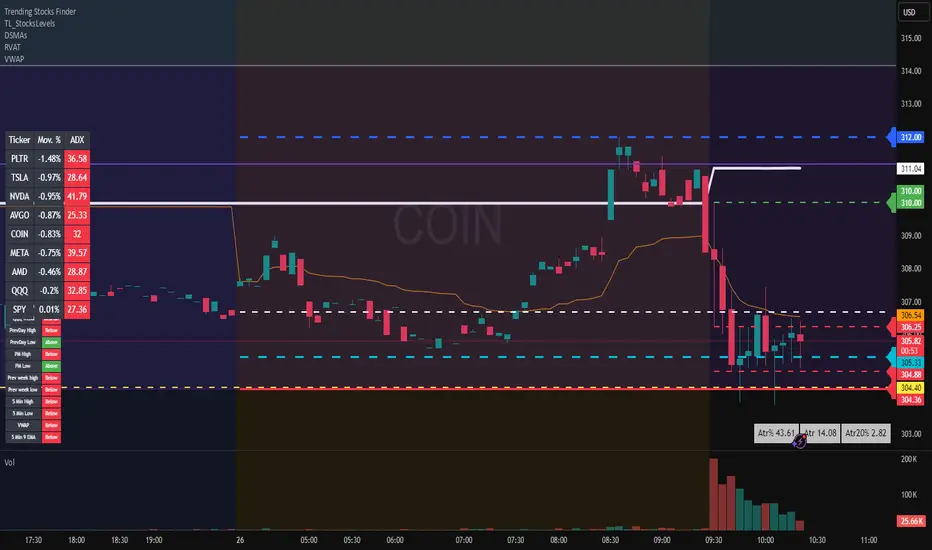
Daily ATR vs Move (black & white) + PipsTop of Chart, Mid. Gives the user an idea of what trend is doing and how the current price compares to daily ATR.
Used on this example below to indicate we are within the bottom range for the day, and price has potential to move up without worry of exhaustion.

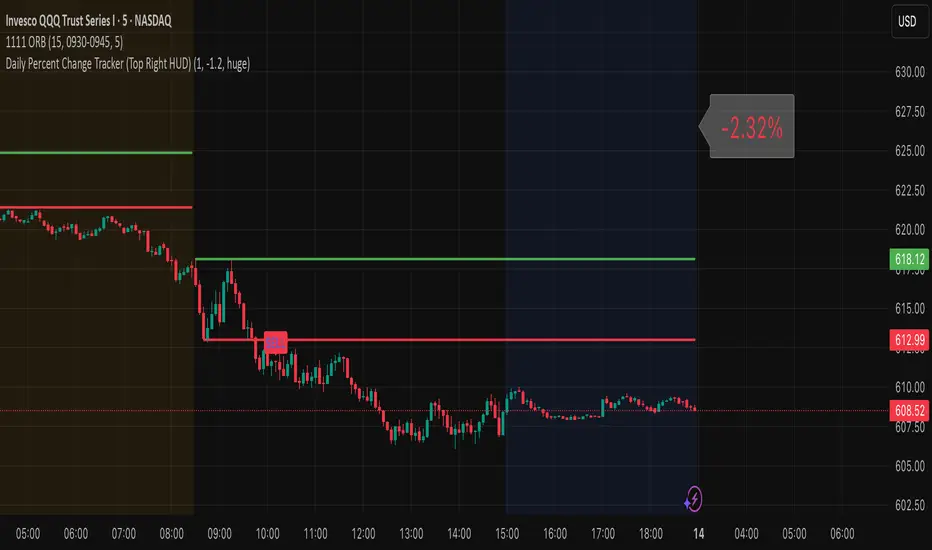
Daily Percent Change Tracker Indicator provides Daily Percent change on any ticker. Provides a HUD on top right with the value and allows custom trigger for + or - percent change
Daily ATR SL/TP Labels on ChartATR-Based Stop Loss & Take Profit Calculator
This script calculates 20% of the Average True Range (ATR) to determine optimal Stop Loss and Take Profit levels. Designed to assist traders in setting precise risk parameters when placing Buy/Sell orders based on daily market volatility.
Key Features:
Computes 20% of ATR value for proportional risk management
Provides dynamic SL/TP levels aligned to current market conditions
Optimised for Daily timeframe analysis to capture full trading day range
Recommended Usage:
Apply on Daily (1D) timeframe for most accurate results, as this captures the complete intraday price movement and provides reliable volatility measurements for position sizing and risk management decisions.

Daily Midnight Marker (NYC)This indicator automatically plots a vertical line at midnight (00:00) New York time on every trading day.
Each line is drawn in light gray to mark the start of a new day, helping traders visually separate daily sessions.
A weekday label (e.g., Monday, Tuesday, Wednesday...) is displayed to the right of each line, making it easy to identify daily transitions when analyzing intraday price action or reviewing trading sessions.
Perfect for traders who:
Trade based on daily session structure or pre-market setups
Use NY time as a market reference
Prefer a clean and minimal visual day separator

Daily Range Zone This indicator shows the daily range (high to low) for each day.
Every day has its own unique color, making it easy to see each day’s price range at a glance.

Daily Pivot Points LEVELS S-RThis indicator plots daily pivot points based on the previous day’s high, low, and close. It displays the main pivot line, as well as the first levels of support (S1) and resistance (R1), with optional second levels (R2, S2) for additional reference. Ideal for
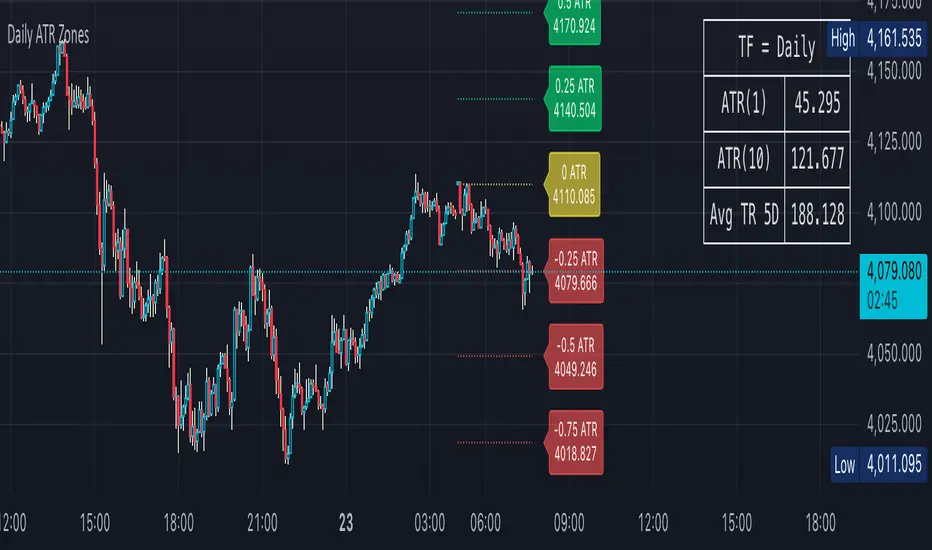
Daily ATR Zones
Dynamic Daily ATR Projection Zones
### **Description:**
This indicator projects potential price levels for the current trading day based on the Average True Range (ATR) of the previous day. It is designed to help intraday traders visualize daily volatility and identify key potential support, resistance, or target levels that are fixed for the entire session and do not repaint.
**How It Works**
The logic is based on two key components: a stable base price and a reliable volatility measure.
* **Base Price:** The indicator uses the **Open price of the current day** as the central anchor point for all projections.
* **Volatility Measure:** The calculation uses the final, completed **ATR value from the previous day**. This ensures that the projected zones are constant throughout the current trading day and are not subject to repainting.
The projection levels are then calculated using the formula:
`Current Day's Open + (Previous Day's ATR * Multiplier)`
**Features**
This script is fully customizable to fit your trading style:
* **Customizable ATR Multipliers:** Easily define your own price zones by entering a comma-separated list of multipliers (e.g., `0.5, 1.0, 1.5, -0.5, -1.0`).
* **Dynamic & Movable Labels:** The price labels are designed to stay on the right edge of the chart, ensuring they never obscure the current price action.
* **Adjustable Label Position:** Use the "Label Horizontal Offset" setting to control how far the labels are positioned from the current bar, keeping your chart clean.
* **Adjustable Label Size:** Choose from five different sizes (Tiny, Small, Normal, Large, Huge) to ensure the labels are perfectly readable on any device.
* **Toggle Labels:** You can turn all labels on or off with a single checkbox.
* **Full Color Customization:** Set unique colors for the positive (upper), negative (lower), and neutral projection zones.
**How to Use**
This tool can be integrated into various intraday trading strategies:
* **Intraday Targets:** The projected levels can serve as potential take-profit or stop-loss targets for scalpers and day traders.
* **Support & Resistance:** Watch for price reactions, such as bounces or rejections, at these ATR levels, as they often act as dynamic support and resistance zones.
* **Volatility Gauge:** The zones provide a quick visual reference for how far the price has moved relative to its recent average daily range. For example, if the price reaches the `1.0 ATR` level, it has completed an "average" day's move.
Daily Vertical LineThis indicator draws vertical lines at a specific time each day, helping you visualize important intraday levels or session opens/closes.
Features:
Customizable time in EST timezone (hour and minute inputs)
Adjustable line color, width, and style (solid, dashed, or dotted)
Automatically draws lines for all historical days
Projects one line into the future for the next occurrence
Works on all intraday timeframes. Future line appears as semi-transparent and dashed to distinguish from historical data.

ICT Daily Bias - Liquidity SweepDaily Bias Script using ICT concepts
Apparently I need to write more here.

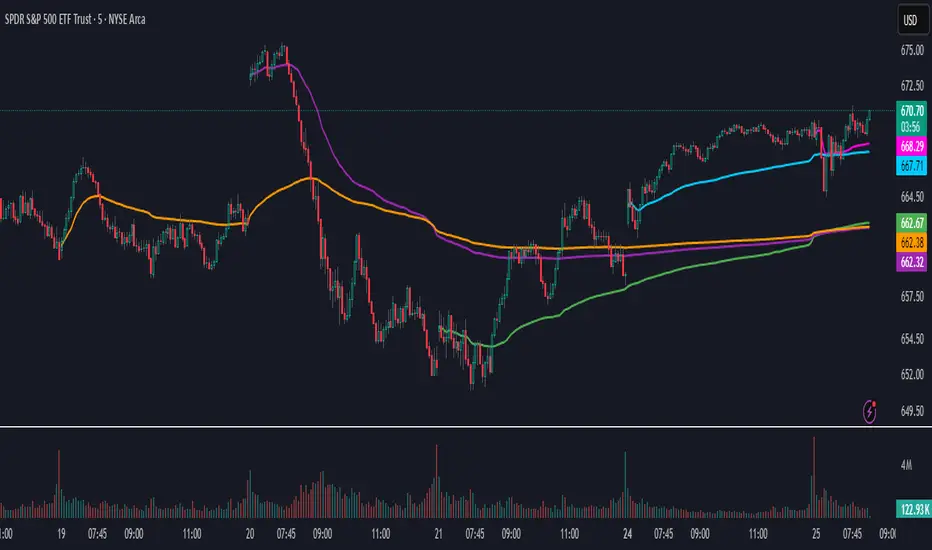
Daily Moving Average Levels on IntradayThis script draws the daily simple moving average levels on the intraday chart. By default it shows 20, 50 and 200 SMA. You can choose the MA you want.


Daily ATR TrackerThis indicator calculates the daily ATR of the past 14 days. The ATR% indicates the range completed for the day. The ATR indicates the average daily range. The 20% ATR indicates the value of 20% of the daily ATR for retracement purposes.
Daily BiasThis indicator draws daily open price levels and marks shifts in market environment with vertical lines. The environment is defined by the daily open relative to the 1H 100 EMA — bullish when above, bearish when below. A simple tool to track daily bias and key levels across all timeframes.

Daily EMA (10/20/50/100/200)Pure Edition
Regardless of the current time period, the daily EMA is always displayed.
純享版
不管目前是什麼時間區段
一律顯示日線級別的ema

Daily EMA (10/20/50/100/200)Pure Edition
Regardless of the current time period, the daily EMA is always displayed.
純享版
不管目前是什麼時間區段
一律顯示日線級別的ema

Daily 10 EMA & 20 EMATracks the 10/20 ema off the daily time frame even when switching to lower time frames

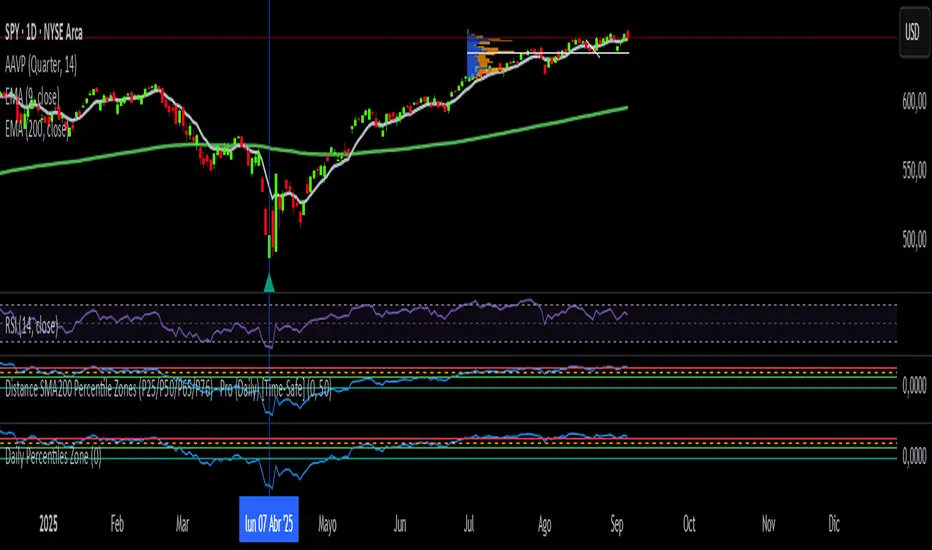
Daily SMA200 Distance – Percentile Zones PROIndicator Description — Weekly/Daily SMA200 Distance – Percentile Zones
The SMA200 Distance – Percentile Zones indicator measures the percentage distance between the price and its 200-period Simple Moving Average (SMA200), and classifies it into historical percentile zones.
This tool helps traders and investors understand the market context of an asset relative to its long-term trend:
Cheap Zone (< P25): price at historically low levels compared to SMA200.
Value Zone (P25–P50): neutral range, where price trades around its long-term average.
Acceptable Zone (P50–P65): moderately high levels, still reasonable within an uptrend.
Not Recommended Zone (P65–P76): overextended territory, with increasing correction risk.
Very Expensive Zone (≥ P76): extreme levels, historically linked to overvaluation and potential market tops.
Percentiles are calculated dynamically from the entire historical dataset (since the SMA200 becomes available), providing a robust and objective statistical framework for decision-making.
✅ In summary:
This indicator works as a quantitative valuation map — showing whether the asset is cheap, fairly valued, acceptable, risky, or very expensive relative to its historical behavior against the SMA200.