Nick_OS RangesUNDERSTANDING THE SCRIPT:
TIMEFRAME RESOLUTION:
* You have the option to choose Daily , Weekly , or Monthly
LOOKBACK WINDOW:
* This number represents how far back you want the data to pull from
- Example: "250" would represent the past 250 Days, Weeks, or Months depending on what is selected in the Timeframe Resolution
RANGE 1 nth (Gray lines):
* This number represents the range of the nth biggest day, week, or month in the Lookback Window
- Example: "30" would represent the range of the 30th biggest day in the past 250 days. (If the Lookback Window is "250")
RANGE 2 nth (Blue lines):
* This number represents the range of the nth biggest day, week, or month in the Lookback Window
- Example: "10" would represent the range of the 10th biggest day in the past 250 days. (If the Lookback Window is "250")
RANGE 3 nth (Pink lines):
* This number represents the range of the nth biggest day, week, or month in the Lookback Window
- Example: "3" would represent the range of the 3rd biggest day in the past 250 days. (If the Lookback Window is "250")
YELLOW LINES:
* The yellow lines are the average percentage move of the inputted number in the Lookback Window
SUGGESTED INPUTS:
FOR DAILY:
Lookback Window: 250
Range 1 nth: 30
Range 2 nth: 10
Range 3 nth: 3
FOR WEEKLY:
Lookback Window: 50
Range 1 nth: 10
Range 2 nth: 5
Range 3 nth: 2
FOR MONTHLY:
Lookback Window: 12
Range 1 nth: 3
Range 2 nth: 2
Range 3 nth: 1
TIMEFRAMES TO USE (If You Have TradingView Premium):
Daily: 5 minute timeframe and higher (15 minute timeframe and higher for Futures)
Weekly: 15 minute timeframe and higher
Monthly: Daily timeframe and higher (Monthly still has issues)
TIMEFRAMES TO USE (If You DO NOT Have TradingView Premium):
Daily: 15 minute timeframe and higher
Weekly: 30 minute timeframe and higher
Monthly: Daily timeframe and higher (Monthly still has issues)
IMPORTANT RELATED NOTE:
If you decide to use a higher Lookback Window, the ranges might be off and the timeframes listed above might not apply
ISSUES THAT MIGHT BE RESOLVED IN THE FUTURE
1. If it is a shortened week (No Monday or Friday), then the Weekly Ranges will show the same ranges as last week
2. Monthly ranges will change based on any timeframe used
Cerca negli script per "daily"

Lepelle's Key LevelsCredit to original code goes to paaax and NSDT. Modified to include premarket H/L levels and to show only daily levels. Indicator includes Close levels.
-US Premarket High and Low Levels
-Daily OHL Levels (No close included)
-Yesterday and Previous day OHLC level
-Labels and ability to modify user preferences (color, line)

SVP + candle + Max volume [midst]
SVP + DALY CANDLE + MAX VOLUME
A comprehensive trading indicator that combines Session Volume Profile (SVP), Higher Timeframe (HTF) Candles, and Intrabar Max Volume Price Detection into one powerful tool. Perfect for traders who want to understand price action, volume distribution, and key levels all in one place.
KEY FEATURES
Session Volume Profile
• Real-time volume distribution across price levels for the current session
• Point of Control (POC) - identifies the price with the highest traded volume
• Value Area High (VAH) & Low (VAL) - shows where 70% of the volume occurred (customizable percentage)
• Color-coded volume bars - distinguish between up volume (bullish) and down volume (bearish)
• Value area highlighting - clearly see the most important price zones
Higher Timeframe Candle Display
• Visual daily (or custom timeframe) candle overlaid on your current chart
• OHLC labels - see Open, High, Low, and Close prices clearly marked
• Fully customizable colors - separate colors for bullish/bearish bodies, borders, and wicks
• Adjustable positioning - move the candle and labels to your preferred location
Max Volume Price Detection
• Identifies the exact price level with maximum volume within each bar
• Uses Lower Timeframe (LTF) data for precise volume analysis (Premium+ required)
• Simple mode fallback - works on all TradingView plans
• Previous max volume marker - displays previous bar's max volume as a reference dot
• Real-time calculation - updates as each bar forms
ATR Table
• Dynamic ATR-based stop levels - automatically calculates potential stop-loss levels
• Multiple smoothing methods - RMA, SMA, EMA, WMA
• Customizable multiplier - adjust for your risk tolerance
• Clean table display - shows ATR value, high stop, and low stop
PERFECT FOR
Day traders analyzing intrabar volume distribution
Swing traders wanting HTF context on lower timeframes
Volume profile traders looking for key support/resistance levels
Price action traders seeking high-probability entry zones
HOW TO USE
Volume Profile Analysis
POC often acts as a magnet for price. VAH/VAL are key support/resistance levels. High volume nodes indicate strong price acceptance, while low volume nodes suggest potential breakout zones.
HTF Candle Context
See daily range while trading on 5m-1h charts. Daily open often acts as pivot point. Daily high/low are key levels to watch.
Max Volume Price
Black line shows where most volume traded in each bar. Previous max volume (dot) helps identify institutional activity. Clusters of max volume create strong support/resistance. Can possibly indicate a Wick bounce
ATR Stops
Use ATR-based levels for logical stop placement. Adjust multiplier based on market volatility.
SETTINGS & CUSTOMIZATION
Positioning
Control the global offset to move both candle and profile together. Fine-tune with individual offsets for candle and profile spacing.
Volume Profile
Adjustable number of rows (50-500) for granular or simplified view. Customizable width and placement (left/right). Value Area percentage control. Full color customization for all volume components.
HTF Candle
Any timeframe selection (default: Daily). Full color customization for bull/bear candles. Adjustable candle width. Toggle OHLC labels on/off. Control label distance and line widths.
Max Volume Price
Choose between Simple (all plans) or LTF mode (Premium+). Auto or manual LTF resolution. Custom color and line width. Toggle current and previous markers independently.
TECHNICAL NOTES
Maximum 5000 bars lookback for volume calculations
Works on all timeframes
LTF max volume requires TradingView Premium or higher
Optimized for performance with efficient array operations
For best results, use on liquid instruments with reliable volume data
Most effective on intraday charts (5min-1hour) for day trading and scalping strategies
For Entertainment and information only
Created by midst

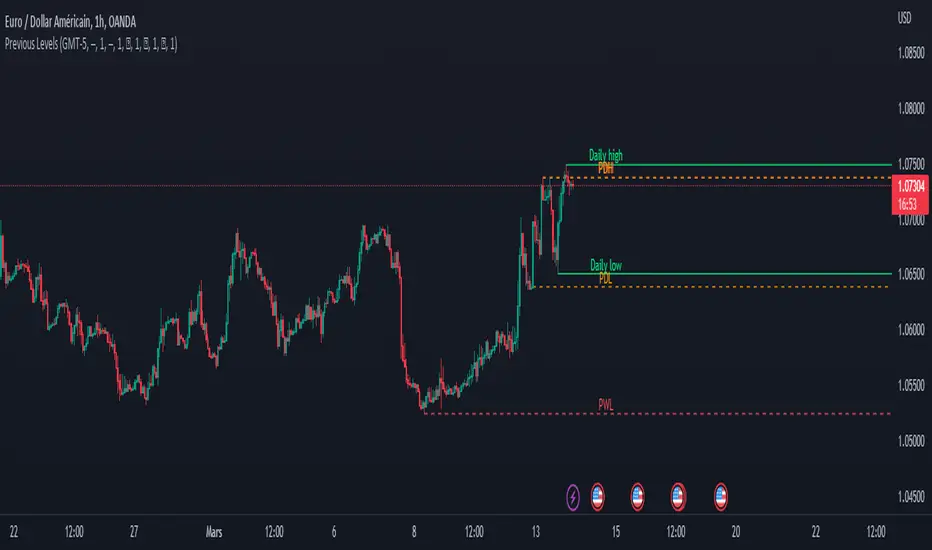
Previous Levels With Custom TimeZoneThe Previous Levels With Custom TimeZone indicator shows to users specifics price area which can be liquidity to take.
Users can determine the desired time zone to retrieve the correct daily, weekly and monthly values.
Several price area are shown with with indicator which are :
Daily Open Price
Daily Low Price
Daily High Price
Previous Daily Low Price
Previous Daily High Price
Previous Weekly Low Price
Previous Weekly High Price
Previous Monthly Low Price
Previous Monthly High Price
All price area are configurable to let user have specific color or line style for each area.
Here's some example :
Daily Open / High / Low
Previous Daily High / Low
Previous Weekly High / Low
Previous Monthly High / Low
MTF previous high and low quarter levelsDescription
An experimental script that prints quarter levels of the previous timeframe's high and low to the current timeframe. The idea is quite simple and is basically the Fibonacci pivoted on the previous high and low with quarter level settings (0,0.25,0.5,0.75,1 etc). The default setting is the previous daily high and low but can be customized on user discretion.
New quarter levels are printed after the close of the previous timeframe and open of the new timeframe (user's timeframe setting)
How To Use
Levels should not be used blindly. Levels can be used as confluence when aligned with high probability supply and demand zones, support, resistance, order blocks, and so on.
Credit to @HeWhoMustNotBeNamed for the Previous High/Low MTF indicator code and @mrbirman for the idea to put this together.

RVOL Relative Volume - IntradayHello All,
Relative Volume is one of the most important indicators and Traders should check it while trading/analyzing. it is used to identify whether the volume flows are increasing or decreasing. Relative volume measures current volume in relation to the “usual” volume for this time of the day. What is considered “usual"? For that, we have to use a historical baseline known as the average daily volume. That means how much volume a security does on a daily basis over a defined period. (This scripts runs on the time frames greater or equal 1 minute and less than 1 day)
The common definition for real-time relative volume is: Current volume for this time of day / Average volume for this time of day. It does not mean taking the volume (for example) from 10:30 am to 10:45 am and comparing it to what it does from 10:30 am to 10:45 am every day. What it truly means is to compare cumulative volumes. Therefore, this is the precise definition of real-time relative volume:
Current cumulative volume up to this time of day / Average cumulative volume up to this time of day
What should we understand while checking RVOL;
- Relative volume tell us if volume flows are increasing or decreasing
- A high relative volume tells us that there is increased trading activity in a security today
- Increased volume flows often accompany higher volatility i.e. a significant price move
Let see an example:
P.S. if you want to get more info about RVOL/Relative Volume then you can search it on the net. While developing the script this was used as reference, you can also check it for more info.
Enjoy!

Bulltrapp.com - KEY LEVELSBulltrapp.com - KEY LEVELS
A comprehensive all-in-one key levels indicator designed for serious traders who want to see the most important price levels at a glance.
📊 Features:
Daily Levels
Previous Day High/Low (PDH/PDL)
Daily Open (DO)
Weekly Levels
Current & Previous Week High/Low
Weekly Open (WO)
Monday Range
Monday High/Low - essential for weekly range analysis
Monthly Levels
Current & Previous Month High/Low
Monthly Open (MO)
Quarterly & Yearly Levels
Quarterly Open (QO)
Yearly High/Low/Open with Previous Year levels
Session Levels
Asian, London & New York session High/Low
Customizable session times (UTC based)
Opening Range
NY Opening Range (first 15 min)
London Opening Range (first 15 min)
Automatic Support/Resistance Detection
Pivot-based S/R detection with customizable lookback
Shows levels with the most touches (strongest zones)
Automatic merging of nearby levels to reduce clutter
Configurable sensitivity and history length
⚙️ Customization:
Fully customizable colors for each level type
Adjustable line width and style (Solid/Dashed/Dotted)
Label size options
Toggle each level group on/off independently
Works correctly with Heikin Ashi charts (uses real OHLC data)
📱 Built by Bulltrapp.com
This indicator is brought to you by Bulltrapp.com - your ultimate crypto portfolio tracker!
🚀 Track your entire portfolio across multiple exchanges and wallets in one place
📈 Real-time P&L tracking with detailed analytics
💰 Tax reporting made easy
🔔 Smart alerts for price movements and portfolio changes
Visit bulltrapp.com to take your trading to the next level!
If you find this indicator useful, please give it a ⭐ and leave a comment!

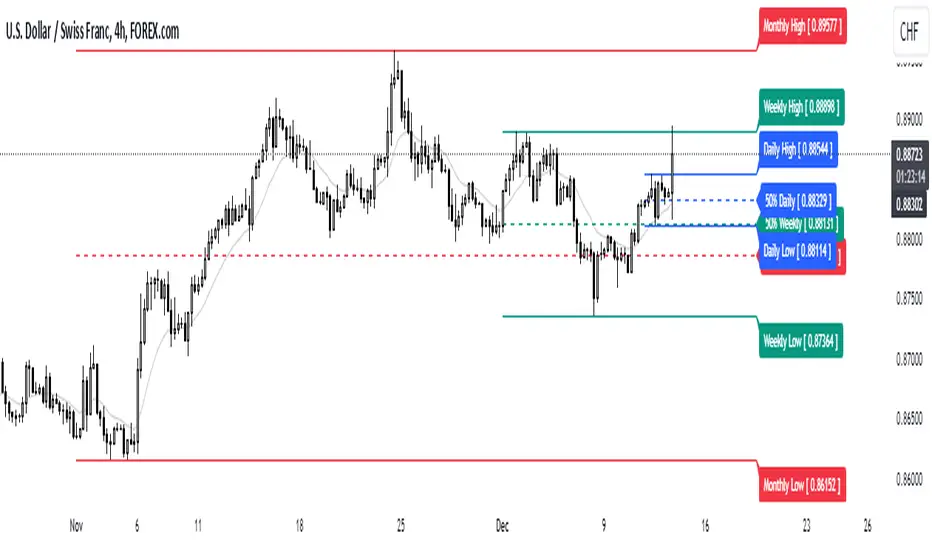
Historical & Periodic Key LevelsHistorical & Periodic Key Levels
This indicator automatically plots historical key levels (ATH/ATL) and periodic closing levels (Daily, Weekly, Monthly, Yearly). It highlights major price zones frequently used in technical and institutional trading.
Key Features:
Dynamic ATH/ATL: tracks all-time high/low with date annotation.
Periodic Closes: previous D/W/M/Y closes with directional coloring.
Adaptive Colors: green/red based on bullish or bearish close.
Full Customization: toggle visibility, colors, line width, text alignment, and label text.
Smart Label Management: prevents overlap by cycling through label styles automatically.
Usage:
Identify strong support/resistance levels.
Monitor key closing prices across multiple timeframes.
Enhance swing trading and long-term analysis with institutional reference levels.
Inputs:
Levels Visibility: show/hide ATH, ATL, and periodic closes.
ATH/ATL Style Settings: line colors, label prefix, width, and text alignment.
Periodic Levels Style: label text (D/W/M/Y), line width, alignment, and bullish/bearish colors.
Notes:
Levels adjust automatically to the active chart timeframe.
Lower timeframe levels are hidden when redundant (e.g., daily close on daily chart).

High/Mid/Low of the Previous Month, Week and Day + MAIntroducing the Ultimate Price Action Indicator
Take your trading to the next level with this feature-packed indicators. Designed to provide key price insights, this tool offers:
- Monthly, Weekly, and Daily Levels : Displays the High, Midpoint, and Low of the previous month, week, and day.
- Logarithmic Price Lines : Option to plot price levels logarithmically for enhanced accuracy.
- Customizable Labels : Display labels on price lines for better clarity. (This feature is optional.)
- Dual Moving Averages : Add two customizable Moving Averages (Simple, Exponential, or Weighted) directly on the price chart. (This feature is optional.)
This code combines features from the Moving Average Exponential and Daily Weekly Monthly Highs & Lows (sbtnc) indicators, with custom modifications to implement unique personal ideas.
Perfect for traders who want to combine precision with simplicity. Whether you're analyzing historical levels or integrating moving averages into your strategy, this indicator provides everything you need for informed decision-making.
To prevent change chart scale, right click on Price Scale and enable "Scale price chart only"
Previous Day and Week RangesI've designed the "Previous Day and Week Ranges" indicator to enhance your trading strategy by clearly displaying daily and weekly price levels. This tool shows Open-Close and High-Low ranges for both daily and weekly timeframes directly on your trading chart.
Key Features :
Potential Support and Resistance: The indicator highlights previous day and week ranges that may serve as key support or resistance levels in subsequent trading sessions.
Customizable Display Options: Offers the flexibility to show or hide daily and weekly ranges based on your trading needs.
Color Customization: Adjust the color settings to differentiate between upward and downward movements, enhancing visual clarity and chart readability.
This indicator is ideal for traders aiming to understand market dynamics better, offering insights into potential pivot points and zones of price stability or volatility.

Day/Week/Month Metrics (Zeiierman)█ Overview
The Day/Week/Month Metrics (Zeiierman) indicator is a powerful tool for traders looking to incorporate historical performance into their trading strategy. It computes statistical metrics related to the performance of a trading instrument on different time scales: daily, weekly, and monthly. Breaking down the performance into daily, weekly, and monthly metrics provides a granular view of the instrument's behavior.
The indicator requires the chart to be set on a daily timeframe.
█ Key Statistics
⚪ Day in month
The performance of financial markets can show variability across different days within a month. This phenomenon, often referred to as the "monthly effect" or "turn-of-the-month effect," suggests that certain days of the month, especially the first and last days, tend to exhibit higher than average returns in many stock markets around the world. This effect is attributed to various factors including payroll contributions, investment of monthly dividends, and psychological factors among traders and investors.
⚪ Edge
The Edge calculation identifies days within a month that consistently outperform the average monthly trading performance. It provides a statistical advantage by quantifying how often trading on these specific days yields better returns than the overall monthly average. This insight helps traders understand not just when returns might be higher, but also how reliable these patterns are over time. By focusing on days with a higher "Edge," traders can potentially increase their chances of success by aligning their strategies with historically more profitable days.
⚪ Month
Historically, the stock market has exhibited seasonal trends, with certain months showing distinct patterns of performance. One of the most well-documented patterns is the "Sell in May and go away" phenomenon, suggesting that the period from November to April has historically brought significantly stronger gains in many major stock indices compared to the period from May to October. This pattern highlights the potential impact of seasonal investor sentiment and activities on market performance.
⚪ Day in week
Various studies have identified the "day-of-the-week effect," where certain days of the week, particularly Monday and Friday, show different average returns compared to other weekdays. Historically, Mondays have been associated with lower or negative average returns in many markets, a phenomenon often linked to the settlement of trades from the previous week and negative news accumulation over the weekend. Fridays, on the other hand, might exhibit positive bias as investors adjust positions ahead of the weekend.
⚪ Week in month
The performance of markets can also vary within different weeks of the month, with some studies suggesting a "week of the month effect." Typically, the first and the last week of the month may show stronger performance compared to the middle weeks. This pattern can be influenced by factors such as the timing of economic reports, monthly investment flows, and options and futures expiration dates which tend to cluster around these periods, affecting investor behavior and market liquidity.
█ How It Works
⚪ Day in Month
For each day of the month (1-31), the script calculates the average percentage change between the opening and closing prices of a trading instrument. This metric helps identify which days have historically been more volatile or profitable.
It uses arrays to store the sum of percentage changes for each day and the total occurrences of each day to calculate the average percentage change.
⚪ Month
The script calculates the overall gain for each month (January-December) by comparing the closing price at the start of a month to the closing price at the end, expressed as a percentage. This metric offers insights into which months might offer better trading opportunities based on historical performance.
Monthly gains are tracked using arrays that store the sum of these gains for each month and the count of occurrences to calculate the average monthly gain.
⚪ Day in Week
Similar to the day in the month analysis, the script evaluates the average percentage change between the opening and closing prices for each day of the week (Monday-Sunday). This information can be used to assess which days of the week are typically more favorable for trading.
The script uses arrays to accumulate percentage changes and occurrences for each weekday, allowing for the calculation of average changes per day of the week.
⚪ Week in Month
The script assesses the performance of each week within a month, identifying the gain from the start to the end of each week, expressed as a percentage. This can help traders understand which weeks within a month may have historically presented better trading conditions.
It employs arrays to track the weekly gains and the number of weeks, using a counter to identify which week of the month it is (1-4), allowing for the calculation of average weekly gains.
█ How to Use
Traders can use this indicator to identify patterns or trends in the instrument's performance. For example, if a particular day of the week consistently shows a higher percentage of bullish closes, a trader might consider this in their strategy. Similarly, if certain months show stronger performance historically, this information could influence trading decisions.
Identifying High-Performance Days and Periods
Day in Month & Day in Week Analysis: By examining the average percentage change for each day of the month and week, traders can identify specific days that historically have shown higher volatility or profitability. This allows for targeted trading strategies, focusing on these high-performance days to maximize potential gains.
Month Analysis: Understanding which months have historically provided better returns enables traders to adjust their trading intensity or capital allocation in anticipation of seasonally stronger or weaker periods.
Week in Month Analysis: Identifying which weeks within a month have historically been more profitable can help traders plan their trades around these periods, potentially increasing their chances of success.
█ Settings
Enable or disable the types of statistics you want to display in the table.
Table Size: Users can select the size of the table displayed on the chart, ranging from "Tiny" to "Auto," which adjusts based on screen size.
Table Position: Users can choose the location of the table on the chart
-----------------
Disclaimer
The information contained in my Scripts/Indicators/Ideas/Algos/Systems does not constitute financial advice or a solicitation to buy or sell any securities of any type. I will not accept liability for any loss or damage, including without limitation any loss of profit, which may arise directly or indirectly from the use of or reliance on such information.
All investments involve risk, and the past performance of a security, industry, sector, market, financial product, trading strategy, backtest, or individual's trading does not guarantee future results or returns. Investors are fully responsible for any investment decisions they make. Such decisions should be based solely on an evaluation of their financial circumstances, investment objectives, risk tolerance, and liquidity needs.
My Scripts/Indicators/Ideas/Algos/Systems are only for educational purposes!

Bollinger Band with Moving Average & Pin BarsThis indicator was specifically built to be used for trading the Scalpius Trading System promoted by @scottphillipstrading. Additionally I've added Daily and Weekly Highs, Lows and Central Pivot lines
The central indicators used in the Scalpius trading system which are included here are: The Bollinger Band, chart plotting of Pin Bars (Hammers & Shooting Stars) and an Exponential Moving Average.
In the settings the user has the option select EMA, SMA or WMA along with desired length, the default settings are 8EMA as per the Scalpius system rules. Also the Bollinger Band settings can be amended by the user and the Pin Bar chart plots and daily + weekly high and low plots can be removed by the user.

52 Week & Daily & Current High/LowThis Indicator Plots a 52 Week High and Low equal or below daily.
A 52 Daily High and Low on timeframes below daily.
A 52 Bars High and Low on timeframes on any timeFrame.
Based on 52 Week High/Low by BacktestRookies

4H HOD/LOD Checkpoint Analysis4H HOD/LOD Checkpoint Analysis - Detailed User Guide
OVERVIEW
This indicator is a data-driven probability framework for NQ Futures traders that predicts High-of-Day (HOD) and Low-of-Day (LOD) placement based on statistical analysis of 3,136+ trading days (2013-2025). Unlike traditional indicators that rely on technical signals, this tool uses checkpoint-based state analysis with zero forward-looking bias to provide real-time probabilities of whether the daily range is complete.
⚠️ IMPORTANT: This indicator is specifically designed for NQ FUTURES ONLY. All probabilities, patterns, and statistics were derived from a 10+ year historical dataset of NQ 1-minute bars. Using this on other instruments will produce inaccurate results.
CORE CONCEPT: CHECKPOINT METHODOLOGY
What is a Checkpoint?
A checkpoint occurs when a 4-hour candle closes. At this moment, the indicator "locks" the current market state and calculates probabilities for the remainder of the trading day. The key innovation is that state never changes after locking - probabilities remain constant throughout the session until the next checkpoint.
The Six 4-Hour Candles (EST):
6PM (18:00-22:00) - Evening/Globex open
10PM (22:00-02:00) - Asia session
2AM (02:00-06:00) - Early London
6AM (06:00-10:00) - Late London + NY Open
10AM (10:00-14:00) - NY Morning
2PM (14:00-17:00) - NY Afternoon (3 hours only)
Five Checkpoints:
10PM Checkpoint - After 6PM closes
2AM Checkpoint - After 10PM closes
6AM Checkpoint - After 2AM closes
10AM Checkpoint - After 6AM closes (most critical)
2PM Checkpoint - After 10AM closes (highest conviction fade signals)
HOW IT WORKS: THE THREE-FACTOR STATE SYSTEM
At each checkpoint, the indicator evaluates three critical factors to determine probability:
1. ELIMINATIONS (Quantity)
An "elimination" occurs when a candle trades beyond a previous candle's high or low, effectively removing that candle from contention for HOD/LOD.
Example at 10AM Checkpoint:
6PM high = 18,000
10PM high = 18,050 (eliminates 6PM high)
2AM high = 18,100 (eliminates 10PM high)
6AM high = 18,075 (does NOT eliminate 2AM high)
Result: 2 eliminations
The number of eliminations indicates trend strength:
0 eliminations = Range-bound, high probability extremes already set
1-2 eliminations = Moderate trend
3-4 eliminations = Strong trend day, range likely to extend
2. STRUCTURE (Pattern Type)
The indicator distinguishes between two elimination patterns:
Sequential: Eliminations occur in order (6pm → 10pm → 2am → 6am → 10am)
Indicates smooth, consistent trend
Example: 10pm eliminates 6pm, then 2am eliminates 10pm (sequential)
Skip: Eliminations skip candles
Indicates choppy/reversal behavior
Example: 2am eliminates 6pm but NOT 10pm (skip pattern)
Why it matters: Skip patterns show 2X probability differences compared to sequential patterns. At 10AM checkpoint with 2 eliminations, skip pattern shows 64% participation rate vs 36% for sequential pattern with previous survived.
3. PREVIOUS CANDLE STATUS
Did the immediately prior candle get eliminated?
Eliminated: Previous candle's high/low was taken out
Indicates relentless trend
Higher probability of continuation
Survived: Previous candle's high/low still intact
Indicates trend pause
Higher probability of mean reversion or range completion
Critical insight: High and low are tracked separately. At 2AM checkpoint, 10PM might have eliminated 6PM high (relentless uptrend) but NOT eliminated 6PM low (low survived). This creates different probabilities for HOD vs LOD.
VISUAL ELEMENTS
4-Hour Candle Boxes
Each 4H candle is displayed as a colored box showing its range:
Gray = 6PM (evening)
Blue = 10PM (Asia)
Purple = 2AM (early London)
Orange = 6AM (London + NY Open) - THE CURVE SESSION
Teal = 10AM (NY morning) - THE MONEY SESSION
Red = 2PM (NY afternoon) - THE FADE SESSION
HOD/LOD Lines
Black horizontal lines extend from current HOD/LOD with labels showing:
Which candle set the extreme
Current price level
THE CHECKPOINT TABLE EXPLAINED
Table Header:
Shows current checkpoint (e.g., "🎯 10AM CHECKPOINT") or "⏳ PRE-CHECKPOINT" if between checkpoints.
Main Metrics (Side-by-Side Comparison):
The table displays HOD and LOD separately in two columns because they can have different patterns:
METRIC
HODLOD Eliminations
Number of candles eliminated so far for highs
Number of candles eliminated so far for lows
Structure
Sequential or Skip pattern for highs
Sequential or Skip pattern for lows
Prev Candle
Was previous candle's high eliminated or did it survive?
Was previous candle's low eliminated or did it survive?
Pattern
Combined interpretation: Relentless/Paused/Skip/Early
Combined interpretation: Relentless/Paused/Skip/Early
Color Coding:
Structure Row:
White = Sequential (smooth trend)
Orange = Skip (choppy/reversal)
Previous Candle Row:
Red = Eliminated (relentless trend continuing)
Blue = Survived (trend paused)
Pattern Row:
Red = Relentless (previous eliminated + sequential = strong trend)
Blue = Paused (previous survived + sequential = trend pause)
Orange = Skip/Chop (skip pattern = reversal likely)
Gray = Early (0-1 eliminations, too early to tell)
Probability Section:
Prob Already In: Percentage chance that HOD/LOD has already been set
Color coding:
Green (>75%) = High confidence extreme is in, FADE
Yellow (45-75%) = Moderate confidence
Red (<45%) = Low confidence extreme is in, CONTINUATION likely
Sample Size: Shows how many historical occurrences match this exact state (n=XXX)
Larger samples = higher confidence
Most common states have n=500-2,000+
Current: Which candle currently holds HOD/LOD
Pattern Guide Section:
Appears when you have 2+ eliminations. Provides interpretation:
📈 Paused: Trend has paused, 2pm more likely to set extreme
📈 Relentless: Breaking higher/lower, continuation expected
📈 Skip/Chop: Choppy pattern, next session likely
Same for lows with 📉 symbol.
PRACTICAL TRADING EXAMPLES
Example 1: High Conviction Fade Setup
State at 10AM Checkpoint:
Eliminations: 0 (both HOD/LOD)
Structure: None (no eliminations yet)
Prev Candle: Survived
Table shows:
HOD Prob Already In: 68.9% (n=582)
LOD Prob Already In: 73.6% (n=785)
Interpretation: Range is likely complete. Fade extremes. With 0 eliminations and 70%+ probability, this is a high-conviction mean reversion signal.
Example 2: Strong Continuation Signal
State at 10AM Checkpoint:
Eliminations: 3 (both HOD/LOD)
Structure: Sequential
Prev Candle: Eliminated (relentless)
Table shows:
HOD Prob Already In: 29.8% (n=1,758)
LOD Prob Already In: 34.6% (n=1,451)
Pattern: 📈 Relentless / 📉 Relentless
Interpretation: Strong trend day. Only 30-35% chance range is complete. Look for breakouts in direction of trend. 10AM and 2PM likely to extend range.
Example 3: Pattern Structure Edge
State at 10AM Checkpoint:
Eliminations: 2 (HOD)
Structure: Skip (orange background)
Prev Candle: Eliminated vs Alternative State:
Eliminations: 2 (HOD)
Structure: Sequential
Prev Candle: Survived
Result: Skip pattern shows 64% chance 10AM participates vs 36% for sequential+survived. Skip pattern = 2X more likely to see 10AM high. This structural edge is unique to this indicator.
Example 4: Different HOD vs LOD Patterns
State at 10AM Checkpoint:
HOD: 2 eliminations, Sequential, Previous Eliminated (Relentless) = 46.7% in
LOD: 2 eliminations, Skip, Previous Eliminated (Choppy) = 48.4% in
Interpretation: Highs show relentless uptrend but lows show choppy behavior. This divergence suggests potential for upside continuation but with volatility. Not a clean trend day.
KEY CHECKPOINT STATISTICS (DERIVED FROM 10-YEAR DATASET)
10PM Checkpoint (After 6PM):
Very early in day
13.5% HOD in, 21.3% LOD in
Most likely outcome: Range extends into 6AM/10AM
2AM Checkpoint (After 10PM):
Still early
With 0 elims: 22-31% in (balanced)
With 1 elim: 8-12% in (strong trend signal)
6AM Checkpoint (After 2AM) - Critical Decision Point:
With 0 elims: 40-47% in (balanced, could go either way)
With 2 elims: 18-22% in (strong trend into 6AM/10AM)
Most likely outcome: 10AM sets extremes (~38-40%)
10AM Checkpoint (After 6AM) - Highest Conviction:
With 0 elims: 69-74% in → FADE (high confidence)
With 3 elims: 30-35% in → BUY/SELL continuation
This is THE money checkpoint for high-probability setups
2PM Checkpoint (After 10AM) - Maximum Fade Conviction:
With 0-3 elims: 67-95% in → FADE strongly
With 4 elims: 49-61% in (monster trend, weaker fade)
2PM is primarily a mean reversion session
UNDERSTANDING THE UNDERLYING DATA
All probabilities are derived from analysis of:
Instrument: NQ Futures (E-mini NASDAQ-100)
Timeframe: 1-minute bars
Period: January 2013 - December 2025
Sample: 3,136+ complete trading days
Methodology: Real-time checkpoint analysis with zero forward-looking bias
Why NQ-Specific?
Each futures contract has unique:
Session characteristics (6AM in NQ shows 60-64% curve behavior, other sessions differ)
Timing patterns (NQ's 10AM session has 67-74% immediate takeouts)
Volatility profiles (NQ 2PM shows 56% bullish bias vs ES shows different bias)
Using this indicator on ES, RTY, or other instruments will produce inaccurate results because the probability tables are NQ-specific.
ORIGINALITY & INNOVATION
What Makes This Indicator Unique:
Zero Forward-Looking Bias: State locks at checkpoint moments. Traditional indicators recalculate continuously, introducing bias. This indicator freezes probabilities at the exact moment a 4H candle closes.
Three-Factor State System: Combines elimination count, structure pattern, and previous candle status. Most indicators only track one dimension. This multi-factor approach provides 2X+ probability differentials.
Separate HOD/LOD Tracking: Highs and lows can have different patterns simultaneously (relentless high with choppy low). This indicator tracks them separately for precision.
Pattern Structure Analysis: Distinguishes between sequential and skip patterns, a concept not found in standard indicators. Skip patterns show mean reversion while sequential shows continuation.
10+ Year Statistical Foundation: Every probability is backed by hundreds to thousands of historical occurrences (sample sizes shown in table). Not based on theories or assumptions.
Checkpoint-Specific Probabilities: Different checkpoints have different probability profiles. 10AM checkpoint with 0 eliminations = 70%+ fade. 6AM checkpoint with same state = 40%+ fade. Context matters.
HOW TO USE THIS INDICATOR
Step 1: Wait for Checkpoint
The table will show "⏳ PRE-CHECKPOINT" until a 4H candle closes. Probabilities are only valid at checkpoint moments.
Step 2: Read the State
Check the three factors:
How many eliminations?
Sequential or skip?
Previous candle eliminated or survived?
Step 3: Check Probability
Look at "Prob Already In" percentage:
>75% (Green) = High confidence extreme is set, fade
45-75% (Yellow) = Moderate confidence, use other confirmation
<45% (Red) = Low confidence extreme is set, continuation likely
Step 4: Check Sample Size
Larger sample (n=1,000+) = higher confidence
Smaller sample (n=50-200) = use caution, edge is real but less robust
Step 5: Consider Pattern
Read the pattern guide:
Relentless = trend continuing
Paused = trend stalled, mean reversion
Skip/Chop = reversal/range likely
Step 6: Compare HOD vs LOD
If both show similar patterns = cleaner signal
If divergent patterns = complex day, be cautious
BEST PRACTICES
Focus on 10AM and 2PM checkpoints - These have the highest conviction signals
Combine with price action - Don't fade blindly at 90% probability if price is breaking out strongly
Larger samples = better edges - Prioritize setups with n=500+
Watch for pattern divergence - When HOD and LOD show different patterns, expect complexity
Remember session characteristics:
6AM = THE CURVE SESSION (60-64% mean reversion when Q2 breaks Q1)
10AM = THE MONEY SESSION (67-74% immediate takeouts, highest conviction)
2PM = THE FADE SESSION (67-95% extremes already in)
SETTINGS
Show 4H Candle Boxes - Display colored boxes for each 4H candle
Show HOD/LOD Lines - Display horizontal lines at current extremes
Show Checkpoint Analysis - Display probability table
Table Position - Choose where to place the checkpoint table
Table Size - Tiny/Small/Normal
Colors - Customize box colors for each session
LIMITATIONS & DISCLAIMERS
NQ FUTURES ONLY - Do not use on other instruments
Not a standalone system - Use as confluence with your strategy
Historical data - Past performance doesn't guarantee future results
Sample size variance - Some states have smaller samples, use judgment
Requires understanding - Read this guide fully before trading with this tool
FINAL NOTES
This indicator represents 10+ years of NQ futures data distilled into actionable, real-time probabilities. The checkpoint methodology ensures zero forward-looking bias, while the three-factor state system provides granular edge that traditional indicators miss.
Remember: This tool provides probabilities, not certainties. Trade with proper risk management, and use this as one input in your decision-making process.

DWM HLOC, Mid & WicksSimple, yet effective.
1. Automatically calculate and projects key price levels from a previous period (Yesterday, OR Last Week / Month) onto the current trading session. It acts as an immediate Support & Resistance map based on historical price action.
2. Multi-Timeframe Logic
Modes --
Daily Mode: Projects yesterday's data onto today.
Weekly Mode: Projects last week's data onto the current week.
3. Key Levels Visualized The script calculates seven distinct price levels:
OHLC: Previous Open, High, Low, and Close.
Equilibrium (Mid): The exact 50% mark between the previous High and Low.
Wick Midpoints (New):
Upper Wick 50%: The midpoint between the High and the top of the body.
Lower Wick 50%: The midpoint between the Low and the bottom of the body.
4. Smart "Gap" Visualization The script uses unique starting points to help traders visualize market gaps:
Standard Levels (High, Low, Open, Mids): These lines originate from the Previous Period's Open, showing the full context of the level relative to time.
Close Level: This line originates from the Current Period's Open. This visually highlights the "Gap" (the jump in price between where the market closed previously and where it opened today).
5. Full Customization
Aesthetics: Every line can be individually toggled on/off.
Styling: Users can independently change the color, line style (Solid, Dotted, Dashed), and thickness for every specific level.

OHLC Lines – Yesterday & Today (Minimalist Option)This indicator draws horizontal lines representing the Open, High, Low, and Close (OHLC) levels of yesterday and today directly on your chart. It automatically updates each day, showing only the lines for the previous day and the current day, keeping your chart clean and focused.
Features:
Display Yesterday’s OHLC levels.
Display Today’s OHLC levels.
Optional Minimalist Mode with customizable color, width, and line style.
Lines automatically update each day and remove old lines.
Fully customizable colors, visibility, and line width for each OHLC level.
Use Case:
Perfect for traders who want to monitor key daily price levels, identify support/resistance zones, or incorporate OHLC levels into intraday strategies.

VWAP Balance Zones - SessionsVWAP Balance Zones Sessions Version is an alternate take on the Original VWAP Balance Zones indicator. The Sessions version allows users to select a specific session to view the VWAP Balance Zones at while still utilizing the full ETH Data.
The Session version provides a better focused display while still maintaining the core functions of the original script with mindful optimizations.
Author's Note: "VBZ Sessions was made with logistics in mind, for the users who only trade within certain times of the day. While it displays the same core concepts, it is not as "Raw" of a display as the Original. For this reason, some users may prefer the Original VWAP Balance Zones, which is why I have opted to release this alternate version instead of updating the original."
> What are VWAP Balance Zones?
"VWAP Balance Zones" is an original concept aimed at identifying the equilibrium area between market participants within the current trend by averaging the Daily Extremes and the Daily VWAP.
Refer to the illustration below for a better understanding of exactly how VWAP Balance Zones are formed:
These zones are displayed for the Daily, Weekly, and Monthly VWAPs, with the most interactive timeframe being the Daily.
> Features
1. The Session Version uses ETH data at all times, and does not solely rely on the chart's data to create the VWAPs or Zones.
This allows the user to focus on a specific trading session, while not losing out on the full VBZ Calculation, with the notable benefit of a cleaner display.
The Original VBZ starts drawing at the beginning of the chart's "Day", and would produce different results when using an RTH chart vs an ETH chart. Along with creating a bird's nest of unusable data at the beginning of the day.
2. Session Start and End lines are displayed for easier identification of the designated trading session.
3. The extreme "Close" Lines are no longer displayed to reduce noise and redundancy.
4. Additionally, the interior VWAP lines are no longer displayed. Ultimately, this was to reduce noise and focus the script on the 50% zones.
5. Weekly and Monthly Zones are now displayed due to the reduced noise!
6. As with the original, the weekly display will yield to the daily, and the monthly display will yield to the weekly.
In the screenshot below, you can observe this behavior.
Enjoy!

US 30 Daily Breakout Strategy The US 30 Daily Breakout Strategy (Single Trade Per Breakout/Breakdown) is a trading approach for the US 30 (Dow Jones Industrial Average) that aims to capture breakout or breakdown moves based on the previous day’s high and low levels. The strategy includes mechanisms to take only one trade per breakout (or breakdown) each day and ensures that each trade is executed only when no other trade is open.
Entry Conditions:
Long Trade (Breakout): The strategy initiates a long position if the current candle closes above the previous day's high, indicating an upward breakout. Only one breakout trade can occur per day, regardless of whether the price remains above the previous high.
Short Trade (Breakdown): The strategy initiates a short position if the current candle closes below the previous day's low, indicating a downward breakdown. Similarly, only one breakdown trade can occur per day.
Risk Management:
Take Profit and Stop Loss: Each trade has a take profit and stop loss of 50 points, aiming to cap profit and limit loss effectively for each position.
Daily Reset Mechanism:
At the start of each new day (based on New York time), the strategy resets its flags, allowing it to look for new breakout or breakdown trades. This reset ensures that only one trade can be taken per breakout or breakdown level each day.
Execution Logic
Flags for Trade Limitation: Flags (breakout_traded and breakdown_traded) are used to ensure only one breakout or breakdown trade is taken per day. These flags reset daily.
Dynamic Plotting: The previous day’s high and low are plotted on the chart, providing a visual reference for potential breakout or breakdown levels.
Overall Objective
This strategy is designed to capture single-directional daily moves by identifying significant breakouts or breakdowns beyond the previous day’s range. The fixed profit and loss limits ensure the trades are managed with controlled risk, while the daily reset feature prevents overtrading and limits each trade opportunity to one breakout and one breakdown attempt per day.

HT: Intraday LevelsIndicator draws several most important intraday levels: last day RTH high/low, ETH high/low, Half Back, Day Close and current day RTH Day Open. These levels often act as support/resistance for intraday price movements. Also, they can help to assess day character and control of power.
Indicator can be used for ETH + RTH sessions.
Important notes:
• User must specify RTH session time, appropriate for his time zone and exchange
• Half-back is calculated as a middle line between RTH High and Low.
• Day Close is always equal to close of the last bar of the previous day
• RTH Day Open will be redrawn for the current day as soon as it is known (after RTH session opens and at least one bar gets confirmed).
Known issues:
• Day open will not be shown if there is no bar, clearly corresponding to RTH open time (e.g. if 4h timeframe is selected)
• For some ETH sessions it is not possible to determine session’s last bar (this is pine script limitation) until next day trading starts. This means that daily levels will be also update with only then.
Parameters:
Date – user can select date, for which levels will be plotted. Works only if “Use” check box is on. Otherwise, levels will be plotted for the last day. (“time” value doesn’t matter; unfortunately, there is no way to hide the input box)
RTH Open/Close time – it is important to specify time, appropriate for your time zone.
Time zone – your chart time zone (as UTC offset)
Visuals – controls visibility and colors
Script is published as an open source. It uses two libraries: Levels Lib and Functions Lib. First one demonstrates how to work with pine-script object model and arrays. You can also reuse it in your custom scripts where there is need to construct any support/resistance levels. The second library contains some useful functions for working with time and dates.
Disclaimer
This indicator should not be used as a standalone tool to make trading decisions but only in conjunction with other technical analysis methods.

MoonFlag BTC Daily Swing PredictorThis script mainly works on BTC on the daily timeframe. Other coins also show similar usefulness with this script however, BTC on the daily timeframe is the main design for this script.
(Please note this is not trading advice this is just comments about how this indicator works.)
This script is predictive. It colors the background yellow when the script calculates a large BTC swing is potentially about to happen. It does not predict in which direction the swing will occur but it leads the price action so can be useful for leveraged trades. When the background gets colored with vertical yellow lines - this shows that a largish price swing is probably going to occur.
The scripts also shades bands around the price action that are used to estimate an acceptable volatility at any given time. If the bands are wide that means price action is volatile and large swings are not easily predicted. Over time, with reducing volatility, these price action bands narrow and then at a set point or percentage (%) which can be set in the script settings, the background gets colored yellow. This indicates present price action is not volatile and a large price swing is potentially going to happen in the near future. When price action breaks through the narrowing bands, the background is no longer presented because this is seen as an increase in volatility and a considerable portion of the time, a large sudden drop in price action or momentous gain in price is realized.
This indicator leads price action. It predicts that a swing is possibly going to happen in the near future. As the indicator works on the BTC daily, this means on a day-to-day basis if the bands continually narrow - a breakout is more likely to happen. In order to see how well this indicator works, have a look at the results on the screenshot provided. Note the regions where vertical yellow lines are present on the price action - and then look after these to see if a sizeable swing in price has occurred.
To use this indicator - wait until yellow vertical lines are presented on the BTC daily. Then use your experience to determine which way the price action might swing and consider entering a trade or leveraged trade in this direction. Alternatively wait a while to see in which direction the break-out occurs and considering and attempt to trade with this. Sometimes swings can be unexpected and breakout in one direction before then swinging much larger in the other. Its important to remember/consider that this indicator works on the BTC daily timeframe, so any consideration of entering a trade should be expected to cover a duration over many days or weeks, or possibly months. A large swing is only estimated every several plus months.
Most indicators are based on moving averages. A moving average is not predictive in the sense in that it lags price actions. This indicator creates bands that are based on the momentum of the price action. A change in momentum of price action therefore causes the bands to widen. When the bands narrow this means that the momentum of the price action is steady and price action volatility has converged/reduced over time. With BTC this generally means that a large swing in price action is going to occur as momentum in price action then pick-up again in one direction or another. Trying to view this using moving averages is not easy as a moving average lags price action which means that it is difficult to predict any sudden movements in price action ahead of when they might occur. Although, moving averages will converge over time in a similar manner as the bands calculated by this script. This script however, uses the price action momentum in a predictive manner to estimate where the price action might go based on present price momentum. This script therefore reacts to reduced volatility in price action much faster than a set of moving averages over various timescales can achieve.
MoonFlag

52 Week High/Low FibonacciThe primary purpose of this indicator is to calculate and plot the 52-week high and low prices along with the Fibonacci retracement levels on the price chart. Fibonacci levels are commonly used in trading to identify potential support, resistance, and price reversal points.
First, the script initializes the Fibonacci levels and their corresponding colors, which will be used to plot the levels on the chart. Next, it calculates the 52-week high and low prices by finding the highest and lowest prices over the last 252 trading days, approximately equivalent to one year. Then, it identifies the overall trend direction by comparing the number of bars since the highest high and the lowest low. If the highest high is more recent, the trend is considered downwards; if the lowest low is more recent, the trend is upwards.
The script then plots the Fibonacci retracement levels on the chart, using horizontal lines at the respective price levels. It also creates labels for each level, displaying the percentage and the price value. Additionally, it draws a line connecting the 52-week high and low prices, providing a visual representation of the price range during the 52-week period.
Pros of this indicator include:
-Automatic calculation and plotting of Fibonacci levels, saving time for traders
-Clear trend identification based on 52-week high and low prices
-Visually appealing and easy-to-read chart representation with color-coded levels
-Provides insight into potential price reversal areas based on widely used Fibonacci levels
Cons of this indicator include:
-Only works on daily timeframes, limiting its usefulness for intraday and weekly traders
-Assumes that the trend will continue in the same direction, which may not always be accurate in real-world markets
-Does not provide explicit buy or sell signals, leaving the trading decision-making process up to the trader
-Solely relies on Fibonacci levels, which may not always be accurate; it is recommended to use other technical indicators or strategies alongside this indicator for a comprehensive trading approach
In conclusion, the '52 Week High Low Fibonacci' indicator is a valuable tool for traders interested in using Fibonacci levels for identifying potential price reversal points. By automatically calculating and plotting these levels based on 52-week high and low prices, the indicator provides a clear, color-coded visual aid, which can be especially helpful for traders who base their strategies on these levels.
However, it's worth noting that this indicator is limited to daily timeframes and doesn't provide explicit buy or sell signals, requiring traders to incorporate their own analysis and judgement in their decision-making process. The indicator also operates on the assumption of trend continuation, which may not always hold true.
While it's a beneficial tool, relying solely on this indicator for trading decisions may not be advisable. It's best used in conjunction with other indicators and trading strategies, providing a more balanced and comprehensive approach to trading in the financial markets. As always, risk management should be a key part of any trading strategy.
**YOUR INSIGHTFUL FEEDBACK OR SUGGESTIONS FOR REVISIONS TO THIS CODE ARE HIGHLY APPRECIATED. PLEASE FEEL FREE TO SHARE YOUR THOUGHTS TO FOSTER ITS CONTINUAL IMPROVEMENT**

Extended Session High/Low - Intraday and daily chartsThis script plots the extended session highest high and lowest low levels. It works on any time frame from 1 minute to daily.
Please note that during the extended session, TradingView stops updating the daily chart. This means that once the script is loaded on a daily chart, it will not be updated until the market opens, unless you manually reload the layout (Ctrl+R). For this reason, it is recommended to use a multi-timeframe layout, so when the pre/post market line is near the extended session high/low on the daily chart, you can compare these values with those on an intraday chart of the same ticker.
The extended session high/low are important for day traders because they represent the maximum and minimum limits within which the trades have taken place during the extended trading hours. This can make them levels of support/resistance that can be useful for planning trend following, reversal and range-bound strategies.
By displaying the extended session high/low on the daily chart, traders can also see if there are any significant levels nearby that are related to the daily time frame, such as trendlines, support/resistance levels, or moving averages. This can help the trader evaluate whether there is enough room for a price movement in the direction of his trading strategy.

Furious PivotsSimple script marking out quarter points plus weekly and daily highs and lows! pretty damn useful
