50% Daily RangeIndicator plots the midpoint of the current Daily price range. This midpoint is very helpful since it acts as a point of interest where buyers or sellers might step in.
The midpoint line is dynamic and updates as price moves, in order to always have an accurate plot of the average price for the current day.
Cerca negli script per "daily"
ADR - Average Daily Range [KasTrades]This is an Average Daily Range (ADR) indicator.
There are two settings for ADR:
Two Look back period ADR range (e.g. 7 and 14 days)
One Look back period ADR (e.g. 5 days only)
Two day ADR ranges are typically used in equities and index futures whereas one day ADR is typically used in forex.
The opening time by default is 17:00 New York (Eastern) time. The ranges are always calculated from the opening price of the first bar on the respected timeframe.

BMSB Watchlist Alert - Daily w/ 1% Proximity# Bull Market Support Band - Daily Updates with Proximity Alerts
## Overview
This indicator tracks the Bull Market Support Band (20-week SMA and 21-week EMA) with daily resolution updates and proximity warnings. The weekly moving averages update every day on your chart, giving you more frequent signals than traditional weekly-only scripts.
## What It Does
The script monitors price action relative to the BMSB and generates alerts for:
- Price crossing above or below either the 20W SMA or 21W EMA
- Price coming within 1% of either moving average (early warning system)
This proximity feature is useful for catching potential support/resistance tests before they actually happen, giving you advance notice to prepare for entries or exits.
## Key Features
- Weekly MAs that update daily for more responsive monitoring
- Configurable proximity threshold (default 1%, adjustable from 0.1% to 5%)
- Visual proximity zones shown as dotted lines around each MA
- Color-coded background highlighting (green when above both MAs, red when below both, orange when in proximity zone)
- On-chart labels for crosses and proximity warnings
- Status table showing current position relative to the band
## Setup for Watchlist Alerts
1. Add the indicator to any chart
2. Create alerts using these conditions:
- "BMSB Cross Alert" - fires on actual crosses
- "BMSB Proximity Alert" - fires when entering the 1% zone
3. Set interval to 1 day (recommended) or 4 hour for more frequent checks
4. Use "Once Per Bar Close" for the trigger option
5. Apply the same alert to your entire watchlist
## Settings
You can toggle on/off:
- Cross above alerts
- Cross below alerts
- Proximity alerts
- Proximity percentage adjustment
- Visual elements (labels, MA lines, proximity zones)
## Notes
The BMSB is commonly used in crypto markets to identify bull market pullback support levels. This implementation adds the proximity warning system to help you anticipate potential tests of these key levels rather than waiting for confirmed crosses.
Works on any timeframe but designed for daily monitoring of weekly moving averages.

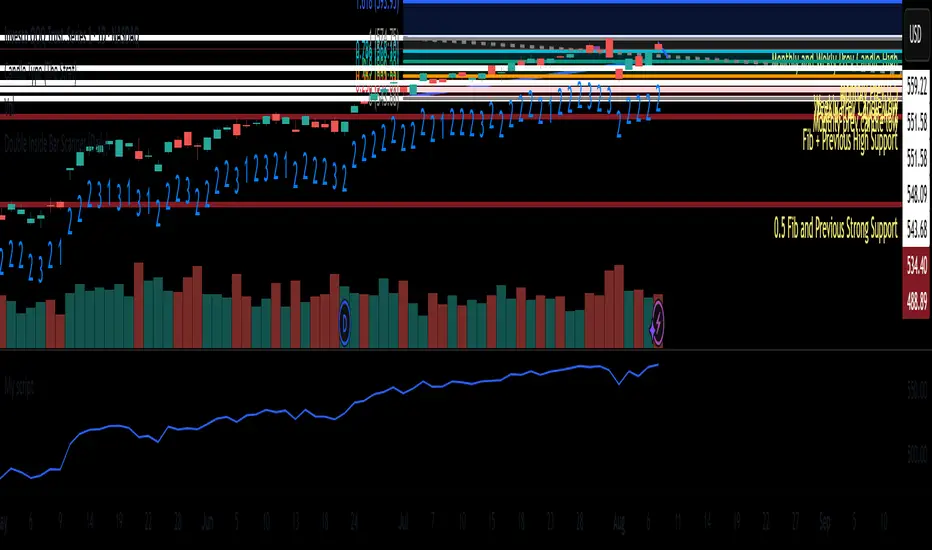
NS ND - EVR - Daily Bias - TRFxVolume & Price Action Signals
What It Does
Combines three proven trading methodologies: Effort vs Result (EVR), No Supply/No Demand (NS/ND), and Daily Bias tracking for intraday traders.
Features
Effort vs Result (EVR)
- **Bullish**: Green triangle below bar when price sweeps previous low with high volume and significant wick
- **Bearish**: Red triangle above bar when price sweeps previous high with high volume and significant wick
- Identifies potential reversals where volume doesn't match price movement
No Supply / No Demand (NS/ND)
- **No Demand (Red dot)**: Up-candle with declining volume - buyers weakening
- **No Supply (Green dot)**: Down-candle with declining volume - sellers weakening
- Grey dots = unconfirmed, colored dots = confirmed within lookahead period
- Based on Volume Spread Analysis (VSA) principles
Daily Bias Label
Top-right corner shows market direction:
- **BULLISH ↑** - Closed above Previous Day High
- **BEARISH ↓** - Closed below Previous Day Low
- **BULLISH/BEARISH REV** - Swept level but closed back inside
- **RANGE ↔** - Trading between PDH/PDL
## Settings
- **EVR**: Toggle on/off, volume multiplier, wick %, inside bars, transparency
- **NS/ND**: Toggle on/off, lookahead bars (default: 10)
- **Daily Bias**: Toggle label display
## Best For
✓ Intraday trading (1m-1h timeframes)
✓ Reversal setups
✓ Volume analysis
✓ Confluence trading (all signals align)
How to Use
1. Enable components you want (all can be toggled independently)
2. Trade EVR signals in direction of Daily Bias
3. Look for NS/ND confirmation at key levels
4. Wait for colored dots (confirmed signals) over grey (unconfirmed)
**Note**: Works on intraday timeframes only. NS/ND signals may repaint during confirmation period.

VWAP Daily/Weekly/Monthly - Automatic AnchoredExplanation:
This script plots Volume-Weighted Average Price (VWAP) lines that are automatically anchored to the beginning of key timeframes — daily, weekly, and monthly. VWAP is a widely used trading indicator that shows the average price of an asset weighted by trading volume, making it useful for identifying fair value and institutional trading levels.
The “automatic anchored” feature means that you don’t have to manually select starting points. Instead, the script automatically resets the VWAP at the start of each day, week, or month, depending on the chosen setting. This ensures the VWAP always reflects the true average price for that period, providing traders with a consistent reference for support, resistance, and trend direction across multiple timeframes.
Notice:
On the chart, you may notice visible “jumps” in the VWAP lines. These are intentional. Each jump marks the reset point at the start of a new day, week, or month, depending on the selected setting. This design keeps the VWAP history from the previous period intact, allowing you to clearly see how price interacted with VWAP in past sessions.
By keeping these historical resets, you can easily compare short-term (daily) VWAP behavior against longer-term levels like weekly and monthly VWAP. This provides valuable context, helping you spot when price respects or diverges from fair value across different timeframes.
In short:
Daily VWAP resets at the start of each trading day.
Weekly VWAP resets at the beginning of each trading week.
Monthly VWAP resets at the start of each month.
This makes it easy to analyze how price interacts with VWAP levels across different time horizons without manual adjustments.

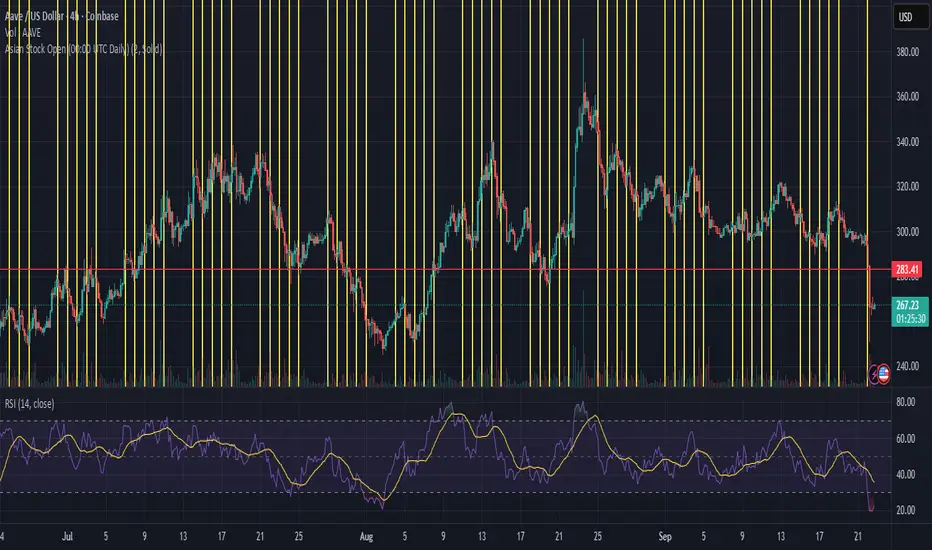
Asian Stock Open (00:00 UTC Daily)Simple TSE daily open indicator, 500 line history, to help prepare for potential weekly open volatility from Asia trading
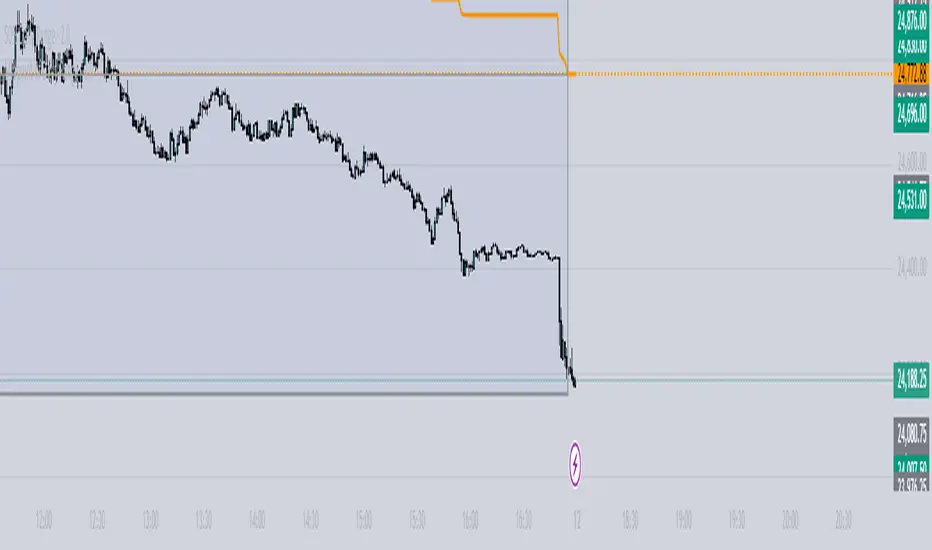
Smart Money LITE — Daily Sweep → HQ Signals (VWAP • FVG • CHoCH) 🔗 PRO VERSION (VWAP + FVG + CHoCH — full confirmations, all timeframes):
chartedgepro.gumroad.com/l/rmnbhw
Daily liquidity sweep → confluence signals with VWAP, FVG & CHoCH. Works on all timeframes & markets (Indices, Forex, Crypto).
WHAT IT DOES
Smart Money LITE+ highlights high-quality LONG/SHORT signals only after daily liquidity is swept (previous day high/low) with confluence from VWAP, FVG and structure (BOS/CHoCH).
Works on all timeframes and across markets: indices, forex, crypto.
KEY FEATURES (Lite)
• Daily sweep logic (PDH/PDL) + previous day zones
• VWAP + deviation bands (optional) and proximity filter
• 3-bar FVG boxes (visual) with adjustable extension
• ATR/volatility filter, optional HTF trend filter
• Anti-spam cooldown, clean LONG/SHORT labels
• Alerts: HQ LONG / HQ SHORT
HOW TO USE
1. Wait for price to sweep PDH/PDL → indicator opens “signal window”.
2. Look for confluence: VWAP touch/proximity + CHoCH or BOS in direction.
3. Enter with proper risk management (stop beyond swing/zone, partials).
SETTINGS TIPS
• Enable “Require VWAP Confluence?” for strictest setups.
• Use “HTF Trend Filter?” to align with higher-timeframe EMA trend.
• Adjust “After sweep (bars)” to define signal validity window.
• FVGs are visual in Lite — advanced filtering and confirmation are in Pro.
WHO IT'S FOR
Scalpers, intraday, and swing traders looking for objective, visual signals based on liquidity sweeps and VWAP/FVG confluence.
PRO VERSION (full confirmations)
Adds advanced FVG/iFVG logic, more confluence filters, dynamic risk tools and extended alert packages — optimized for all timeframes.
👉 chartedgepro.gumroad.com/l/rmnbhw
NOTES
• For educational purposes only. No financial advice.
• “Lite” is open-source; redistribution of code follows TradingView rules.

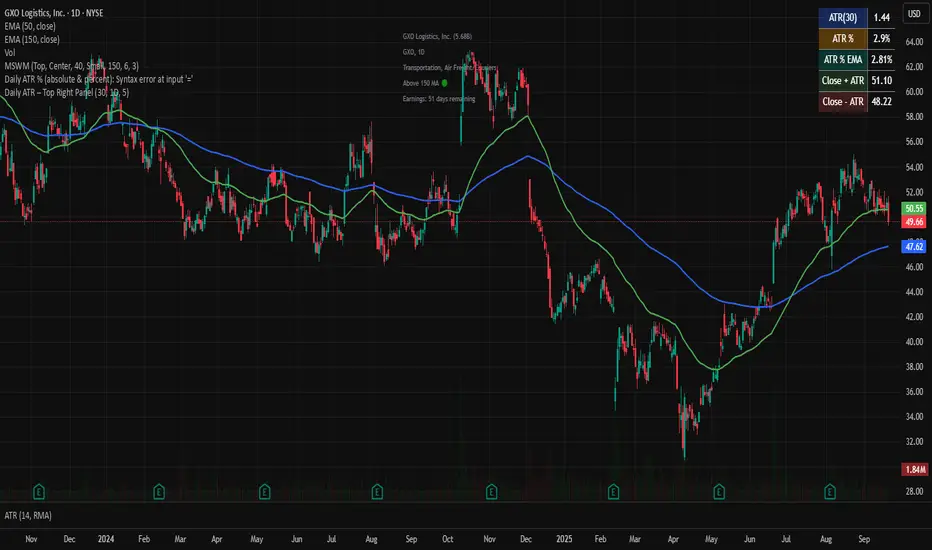
nitai Daily ATR – Top Right PanelThis script calculates the Daily ATR (Average True Range) and displays it in a compact panel on the top-right corner of the chart.
The panel includes:
• ATR in USD (based on a user-defined period, default = 30)
• ATR% – volatility expressed as a percentage of the price
• ATR% EMA – smoothed volatility trend using an Exponential Moving Average
• Close + ATR and Close – ATR – projected upper and lower daily range levels
Use this tool to quickly assess daily volatility, compare stocks by relative movement, and support risk management (e.g., stop-loss placement).
Designed for traders who want a clean and simple volatility dashboard directly on the chart.
BB + OBV + RSI Strategy (Enhanced + Daily Table) Script Brief – *BB + OBV + RSI Strategy (Enhanced + Daily Table)*
This TradingView Pine Script combines **Bollinger Bands (BB)**, **On-Balance Volume (OBV)**, **Relative Strength Index (RSI)**, and **Exponential Moving Average (EMA)** to help traders identify potential trend conditions and market strength.
**Key Features:**
* **Bollinger Bands** (20-period SMA ± 2 Std Dev by default) to track volatility and price extremes.
* **OBV & OBV Moving Average** to confirm buying or selling pressure.
* **RSI** to highlight overbought and oversold zones.
* **200 EMA** as a long-term trend filter.
* **Daily Comparison Table** (top-right corner):
* Displays today’s vs. yesterday’s values for Close, RSI, OBV vs MA, BB Position, and EMA Trend.
* Helps quickly assess whether momentum and trend conditions are strengthening or weakening.
**Usage:**
* The chart shows **BB lines and EMA** for real-time analysis on any timeframe.
* The **table provides higher-timeframe context** (daily values), making it easier to confirm signals across multiple timeframes.
* Best applied with backtesting and proper risk management.

Modified - Pivot Points Standard with Daily H/L/CThis indicator plots Pivot Points Standard with six calculation methods (Traditional, Fibonacci, Woodie, Classic, DM, Camarilla) and flexible anchors (Auto/D/W/M/Q/Y and multi-year). You can restrict pivots to the current day/week/month, choose daily-based data (uses higher-timeframe OHLC; futures use settlement close) or intraday aggregation, and independently style pivots versus previous-period lines with solid/dashed/dotted types and custom widths. Per-level colors are provided (PP/R/S), with R4/R5 and S4/S5 off by default, plus optional labels showing prices positioned left or right. It also draws the previous Day/Week/Month High, Low, and Close across the current period using completed higher-timeframe values (lookahead_off with ), ensuring they always reflect the prior session/period. Rendering is optimized by limiting historical pivot sets and auto-cleaning old lines for smooth performance on any timeframe.

Dani u nedelji + midnight open @mladja123This indicator breaks the weekly timeframe into cycles and marks the midnight open for each day. It helps traders visualize weekly structure, identify key daily openings, and track market rhythm within the week. Perfect for analyzing trend patterns, swing setups, and session-based strategies.

Aggressive Phase + Daily Buy Visual Screener — v6Aggressive Phase + Daily Buy Visual Screener — v6 for bullish, neutral and bearish zone identification

Average Daily Range TrackerAverage Daily Range Tracker
This indicator helps you measure volatility in real time by tracking the Average Daily Range (ADR) and comparing it to the current day’s price action.
🔑 Features
Calculates the ADR over a user-defined lookback period (default = 14 days).
Displays today’s developing range (High–Low) as the session unfolds.
Shows what % of the ADR has already been consumed intraday.
Visual progress bar makes it easy to see how close today is to its historical average range.
Optional ADR plot available in a separate pane.
📈 How traders use it
Spot when a market has already made its “typical” daily move.
Adjust intraday trade expectations: avoid chasing after the bulk of the move is done.
Use % of ADR consumed as a volatility filter for setups.
Combine with support/resistance to identify exhaustion zones.
⚙️ Customization
Lookback length for ADR calculation.
Progress bar size and color.
Optional toggle to plot ADR in its own panel.

Auto Daily High/Low/50%This indicator automatically plots the current daily high and low, as well as the midrange.

Volume Spikes + Daily VWAP SD BandsVolume Spikes + Daily VWAP SD Bands
This indicator combines volume spike detection to help traders identify potential absorption zones with daily VWAP and standard deviation bands , key price levels, continuation opportunities, and possible institutional bias.
Features:
Volume Spike Detection
Highlights candles with unusually high volume relative to a configurable SMA.
Optional filters:
Local highs/lows only (Only Use Valid Highs & Lows)
Candle shapes: Hammer / Shooter only
Candle color match: bullish spikes on green, bearish on red
Plots small circles above/below bars for bullish and bearish volume spikes.
Alerts available for both bullish and bearish spikes.
Interpretation: Volume spikes at local highs/lows can indicate absorption, where one side absorbs aggressive buying/selling pressure.
Daily VWAP
Calculates volume-weighted average price (VWAP) for the current day.
Optionally shows previous day’s VWAP for reference.
Plot lines are customizable with optional circles on lines for visual clarity.
Labels on the last bar show exact VWAP values.
Institutional Bias Insight: Price above both current and previous VWAPs may indicate bullish positioning; price below both VWAPs may indicate bearish positioning. Many professional traders consider this a clue to institutional bias, but it’s not guaranteed. Always confirm with volume, delta, or orderflow analysis.
Standard Deviation Bands
Optional x1 and x2 SD bands around the daily VWAP.
Visual fill between bands shows price volatility zones.
Can be used to identify potential support/resistance or absorption zones.
Use Case: Price bounces off first SD band may indicate continuation signals, especially when volume spikes occur at those levels.
Customizable Visuals
Colors for bullish and bearish volume spikes
VWAP and SD band colors and thickness
Optional circles and filled bands for better readability
Alerts
Bullish / Bearish Volume Spikes
Supports TradingView alert system for automated notifications
Advanced Use Cases:
Combine with Cumulative Delta or Orderflow tools to confirm true absorption zones.
Identify high-volume rejection candles signaling possible trend continuation.
Use VWAP positioning relative to price to assess potential institutional bias, keeping in mind it is probabilistic, not guaranteed.
Visualize intraday VWAP levels and volatility with SD bands for better trade timing.
Settings: Fully customizable, including volume multiplier, SMA length, session filter, candle shape, color options, and VWAP/SD display preferences.

Market Sessions & Daily Range ProThis tool is designed for market visualization. It displays the real trading sessions (Asia, Europe, and America) together with the daily range (00:00–24:00). Boxes and labels show daily highs, lows, open/close levels, and current extremes. The purpose is to provide traders with a clear visual map of how price behaves across sessions and within the daily structure.

LevelsThis Indicator is meant to plot some of the most common levels that traders use.
The display of these levels is highly customizable, as you can choose the line type , color , thickness and whether it shows you no label, price only, reduced label or full label next to the line. All labels (except for "no Label") will show the price at this level.
Also You have the option to mark the start on each timeframe with either a individually colored background or a vertical line where you can choose the line style and color.
Full List of available Levels and Optional inputs to these levels:
Previous HTF Candle Levels:
• Previous HTF Candle Open
• Previous HTF Candle High
• Previous HTF Candle Low
• Previous HTF Candle Close
Optional:
• Choose any higher timeframe
• Mark start of new HTF candle
Session Levels:
• Session Open
• Session High
• Session Low
• Session Close
Optional:
• Choose any time as start and end of your session
• Mark start of session
• Mark full session
Daily Levels:
• Current Day Open
• Current Day High
• Current Day Low
• Previous Day Open
• Previous Day High
• Previous Day Low
• Previous Day Close
Optional:
• Choose start of day (standard, NY Midnight, custom start time)
• Mark start of day
Weekly Levels:
• Current Week Open
• Current Week High
• Current Week Low
• Previous Week Open
• Previous Week High
• Previous Week Low
• Previous Week Close
Optional:
• Mark start of Week
Monthly Levels:
• Current Month Open
• Current Month High
• Current MonthLow
• Previous Month Open
• Previous Month High
• Previous Month Low
• Previous Month Close
Optional:
• Mark start of Month

Weekly and Daily EMA levelsThis Pine Script indicator provides important weekly and daily levels for lower time frame traders, whom trades based on reaction of these levels.
Dedicated to Prof Michael G
Key Features:
Multi-timeframe EMAs: Shows 12, 21, 50, 100, and 200 period EMAs from both Weekly and Daily timeframes
Horizontal dotted lines: Uses plot.style_linebr to create the dotted/dashed line effect
Works on all timeframes: The lines will appear on any chart timeframe you're viewing
Customizable: Individual toggles for each EMA period and timeframe
Settings Available:
Toggle Weekly/Daily EMAs on/off
Enable/disable individual EMA periods (12, 21, 50, 100, 200)
Customize colors for each EMA line
Adjust line width
Optional labels showing current EMA values
How to Use:
Copy the code into TradingView's Pine Editor
Click "Add to Chart"
Adjust settings in the indicator's Style tab as needed
The weekly EMAs appear with slightly more opacity (30%) while daily EMAs have higher transparency (60%) to help distinguish between timeframes. The lines will automatically update as new bars form and will be visible regardless of what timeframe you're currently viewing on your chart.

HTF Bias Signals (Daily EMA Bias + LTF EMA Cross)clean, flexible indicator (Pine v5). It defines higher-timeframe (HTF) bias from Daily and/or Weekly EMAs, then only fires entries on your chart’s timeframe when that bias agrees with a simple fast/slow EMA trigger. It also includes alertconditions so you can automate alerts.


Monthly weekly daily Naked LevelsFor example, if the day closes positive and the next day closes negative, or vice versa, you have a daily level. The next time the price returns to this level, you can consider it an S/R level.
This indicator shows these levels until the first touch.
Double Inside Bar Scanner [Daily]Double Inside Bar Scanner . Captures Double Inside based on last 2 daily Bars